MERGERS AND ACQUISITIONS
ARM TAKEOVER BY INTEL
Raul Custódio
Advisor: Peter Tsvetkov
Dissertation submitted in partial fulfillment of requirements for the Degree of MSc in Economics at the Universidade Católica Portuguesa
ii M&A: ARM takeover by Intel
Abstract
By the end of 2009 a lot had already been talked about ARM prospects for the future and its sustainability. Several rumors surfaced that the company could be one of the intervenients in the most interesting deal of the last years among IT companies. Among others, Intel was pointed as the most obvious candidate for the acquisition, however Intel had the company of Google, Apple and Samsung, just to name a few.
In this thesis we analyzed the hypothesis of a deal between Intel and ARM, what value
would be created for Intel and ARM shareholders, and how much competition would
Intel face in the case it decided to move forward.
We concluded that the deal is feasible and would create value for Intel and ARM
shareholders, at the expense of the current ARM customers and, most likely, final
consumers.
There seems to be no other firm with capabilities and reasons to go for such deal, and
Intel would face no competition, offering a premium of 55% over ARM market value.
This would leave value for Intel as we calculated the synergy at 73% the actual ARM
market value.
Finally as a separated note, it should be kept in mind that such a deal would probably face a tough time being approved by regulators, such is already the dominant position Intel has in the market.
iii M&A: ARM takeover by Intel
TABLE OF CONTENTS
1. INTRODUCTION ... 1 2. LITERATURE REVIEW ... 2 2.1. VALUATION APPROACHES --- 2 2.1.1. Cash-Flow Approaches ... 22.1.1.1. Estimating Cash Flows ... 3
Types of Cash Flow ... 3
Cross Border Cash-Flows ... 3
2.1.1.2. Terminal Value ... 4
2.1.1.3 The Discount Rate ... 5
2.1.1.4. Cost of Equity ... 6
2.1.1.5. The Risk Free Rate ... 7
2.1.1.6. The market risk premium ... 8
2.1.1.7. The Beta (β) ... 8
2.1.1.8. Cost of Debt ... 9
2.1.2. APV vs. WACC ... 9
2.1.3. Relative Valuation – Multiples ... 10
2.2. M&A ISSUES --- 11
2.2.1. Types of M&A ... 11
2.2.2. Value Creation ... 12
2.2.3. Synergies ... 13
2.2.4. Inefficiencies on the target company ... 14
2.2.5. Method of Payment ... 14
2.2.6. Value Sharing Between Shareholders ... 15
3. INDUSTRY AND COMPANY ANALYSIS ... 17
3.1. INDUSTRY ANALYSIS --- 17
3.1.1. Market Size and Structure ... 18
3.1.1.1. Microprocessors... 19
3.1.2. Margins and Growth ... 21
3.1.3. Market Prospects and Trends ... 22
3.2. RECENT TRENDS IN M&A MARKET AND INSIGHTS SEMICONDUCTOR INDUSTRY --- 24
iv M&A: ARM takeover by Intel
3.2.2. Rational for the deal ... 25
3.3. COMPANY ANALYSIS--- 27
3.3.1. Intel Corporation ... 27
3.3.1.1. Business Structure ... 29
3.3.1.2. Margins and Profits ... 30
3.3.2. ARM ... 30
3.3.2.1. Business Structure ... 31
3.3.2.2. Margins and profits ... 32
4. COMPANY VALUATION ... 34
4.1. INTEL --- 34
4.1.1. Revenues and Gross Margin ... 34
4.1.2. Administrative Costs and R&D ... 36
4.1.3. Taxes ... 37
4.1.4. Capex, Depreciation and Working Capital ... 37
4.1.5. Cost of Capital ... 38
4.1.6. Company valuation and Multiples Valuation ... 39
4.2. ARM --- 39
4.2.1. Revenues and Gross Margin ... 40
4.2.2. Administrative Costs and R&D ... 42
4.2.3. Taxes ... 42
4.2.4. Capex, Depreciation and Working Capital ... 42
4.2.5. Cost of Capital ... 43
4.2.6. Exchange Rate ... 43
4.2.7. Company Valuation and Multiples Valuation ... 44
4.3. VALUE OF THE MERGED COMPANY --- 46
4.3.1. Revenues and Gross Margin ... 46
4.3.2. Administrative Costs and R&D ... 48
4.3.3. Taxes ... 48
4.3.4. Capex, Depreciation and Working Capital ... 48
4.3.5. Cost of Capital ... 48
4.3.6. Synergy ... 48
5. DEAL STRUCTURE ... 51
v M&A: ARM takeover by Intel
5.1.1. Other potential bidders ... 51
5.1.2. Target Shareholders ... 52
5.2. FINANCING THE ACQUISITION --- 54
6. CONCLUSIONS ... 55
7. APPENDIX ... 56
APPENDIX 1: BASIC VALUATION FORMULAS ... 56
APPENDIX 2: ARM AND INTEL SHAREHOLDER STRUCTURE ... 57
APPENDIX 3: PREDICTIONS FOR UNIT SALES, PRICES AND MARKET SHARES IN MICROPROCESSOR MARKETS ... 58
APPENDIX 4: INTEL DCF VALUATION AND BALANCE SHEET ... 60
APPENDIX 5: ARM DCF VALUATION AND BALANCE SHEET ... 62
APPENDIX 6: INTEL AND ARM MULTIPLES VALUATION ... 64
APPENDIX 7: JOINT COMPANY DCF VALUATION AND BALANCE SHEET ... 65
8. BIBLIOGRAPHY ... 67
Academic Literature: ... 67
Company and Industry Data Documents: ... 69
vi M&A: ARM takeover by Intel
Preface
Going through the process of writing this dissertation will certainly have a huge impact on my future career. All the steps and challenges faced provided me a set of tools that will certainly be incredibly useful in the future, not only in the professional, but also in my personal life. All the effort done would not be enough however to complete such a task, and Professor Peter Tsvetkov played a fundamental role in the process that finally culminated with this thesis. It would had been impossible for me to complete this work without the technical knowledge, guidance and encouragement from Professor Peter Tsvetkov.
I would also like to appreciate the help given by my colleagues Pedro Bernardes and Pedro Cardoso, when analyzing the industry and discussing specific topics of my thesis.
Finally I would like to recognize the contribution of the ones that are closest to me, with all their support, who kept me focused and motivated during all the process.
1 M&A: ARM takeover by Intel
1. Introduction
Following stressful years, in the beginning of the century with the threat posed by AMD, Intel has managed to get clear of their competitors and enjoy a clear dominance in the microprocessors market. From 2003 until now, Intel has only known success and increasing revenues and profits. However this dominance seems, at least, shadowed in the next few years.
With the increasing number of smartphones and mobile platforms, a new company emerged as the future of mobile and light computation: ARM. Although barely recognized by the general consumer, ARM designs, are the most sold nowadays. Every, but every smartphone carries an ARM microprocessor, whether it is manufactured by Apple, Samsung, Nokia or someone else. ARM does not actually produce any hardware, it just develop the architecture, leaving manufacturing for other companies.
In the last few years ARM has just consolidated its market position, dominating virtually 100% of the Smartphone’s market in the world. However with the new Windows 8 (compatible with ARM architecture) it seems the actual equilibrium may be in cause.
In the next chapters we analyze the possibility of a deal, with Intel buying ARM. In first place we review the academic literature regarding mergers and acquisitions and valuations, then we present company and market analyzes and after that we move to the valuation of the companies. In the end we evaluate the firm that would emerge in the case of a deal a finally we propose the deal itself.
2 M&A: ARM takeover by Intel
2. Literature Review
The final purpose of this Master Thesis is to evaluate the possibility of a deal between Intel and ARM. Mergers and Acquisitions (M&A) are a usual tool for firms trying to deliver value for shareholders, however final results can vary a lot between deals, from the ones with very good results to the ones that destroyed a lot of value.
The focus will be on the strategy behind the deal and on the structure of the deal itself, trying to understand how value can be created and shared among the shareholders of both companies. This creation of value can be achieved in two ways: through synergies or through improvements in the management of the target company.
Solid knowledge in various financial topics are needed to undertake such task and these topics will be divided in two main areas: valuation techniques and other M&A issues.
2.1. Valuation Approaches
Valuation is a vital piece of any M&A. It is essential to estimate correctly the value of an asset if anyone wants next to create value with it. A misevaluation is a simple way to throw away shareholders money in an acquisition.
There are several types of valuation techniques but I will concentrate on the most common two of them: Discounted Cash-Flow techniques and the Multiples approach. Multiples’ approaches are widely used by investment bankers and dealmakers, however most business schools teach their students DCF techniques (Kaplan and Ruback, 1996). Goedhart, Koller and Wessels (2005) point the merit of multiples analyses but they also concede that DCF are the “most accurate and flexible” methods for valuing projects. However, sometimes, more important than the use of advanced financial models, is the use of plausible assumptions in the valuation process (Sirower and Sahni, 2006).
2.1.1. Cash-Flow Approaches
DCF calculates the value of an asset as the present value of the expected future cash flows from that asset. Several types of DCF models exist but they should yield the same results if one is consistent with the assumptions. As Luehrman (1997) refers, present value is a function of cash-flows and their timing and riskiness. Some models calculate the value of equity only – FCFE – some others calculate the value of the entire asset, including debt – FCFF and APV.
3 M&A: ARM takeover by Intel
2.1.1.1. Estimating Cash Flows
Firm value is derived from cash and not from earnings as some may think. How to calculate these cash flows is of the upmost importance for any valuation since any error in the estimation of this component will result in mistakes in final valuation (Goedhart et al. 2005)
Types of Cash Flow
The cash flows used depend on the model used. Damodaran (2006) presents a wide variety of DCF models and among others the following cash flows can be used:
1. Dividends per share (DPS) can be used to calculate the equity value of the firm using a dividend discount model (DDM), however according Damodaran (2006), since the 1990s that companies started to distribute cash to shareholders in the form of stock buybacks and so this model can undervalue firms that use this method of distribute cash.
2. Free Cash Flow to Equity (FCFE) deals with the problems of the of a DDM given that it assumes that all the cash the is left in the firm after reinvestment needs and debt payments is returned to shareholders. This model assumes that a strong corporate governance system is in place.
3. Free Cash Flow to the Firm (FCFF) is an alternative cash flow that can be used in a WACC based DCF valuation or in an APV valuation. FCFF reflects the firm cash flow after taxes and reinvestment decisions but it does not reflect any debt and interest payments.
Cross Border Cash-Flows
In our case we will have a British company – ARM – bought by an American company – Intel. As the currencies differ we will need to use some tools to adjust the Pound Sterling value of ARM to US Dollars. These tools will solve problems related to different real interest rates and inflation expectations and also differences in tax systems among countries.
Regarding the estimation of cash flows, it can be done both in the home or the local currency. In our case both solutions are easy to adopt as spot and forward exchange rates are easily available for the USD/GBP. Froot and Kester (1995) refer that both methods should yield similar results as long as the assumptions are consistent in both cases:
In the case of the estimates being done in GBP, which is our local currency for ARM, the local cost of capital should be used to discount them to the present. In the end the NPV in GBP is converted to USD at the spot rate yielding the firm NPV in Intel home currency.
4 M&A: ARM takeover by Intel The other option would be to convert each cash flow at the correspondent forward exchange rate and then discount them, at the domestic cost of capital. In the case Forward rates are not available interest rate parity can also be used (Zenner, Matthews, Marks and Mago, 2008). Other question is whether one should use remitted cash flows or earned cash flows. Froot and Kester (1995) argue that to decide on that we should look at the countries involved. In our case, we are facing a company established in the UK, so the recommendation is to use earned cash flows, because even if they are not immediately distributed they should earn an adequate rate of return and so increase the value of the company.
Each situation has different tax treatments but Froot and Kester (1995) recommend the use of the higher of the marginal tax rates paid by companies as a valid assumption.
2.1.1.2. Terminal Value
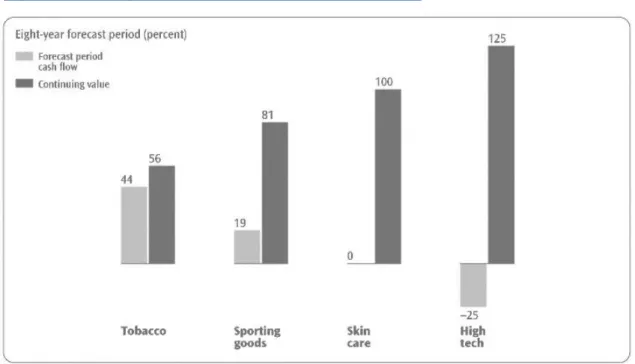
As time goes by it gets harder and harder to continue estimating cash flows in a reliable way. From a certain point on it is advised to assume that cash flows will grow at a certain growth rate. Copeland, Koller and Murrin (2000) call it terminal value and give it a great deal of
attention given the high percentage of firm value that is dependent on it. As we can see in figure 1 we should be especially careful in the analyses of the ARM terminal values given that for the hi-tech industry the terminal values can represent up to 125% of the value of the firm.
5 M&A: ARM takeover by Intel However in our case this should not happen given that ARM, despite its growth opportunities, is an already mature company with positive net cash-flows.
Generally terminal values are calculated as a perpetuity, discounting the first cash flow after the explicit period at a discount rate that is the difference between the cost of capital and the expected growth rate of the cash flow used.
It is important to notice that when estimating the cash flow used to calculate the terminal value, the value of the CAPEX must be at least equal to depreciation, otherwise the firm would have no capital to operate in the long run (Kaplan and Ruback, 1996). Another important point is the fact that it is difficult, even more when considering great companies, to keep growth rates above those of the economy for a long period of time, what means that the growth considered in the terminal value should be no higher than the economy expected growth rate (Damodaran, 2008). Other important aspect stressed by Damodaran (2008) is that return on new invested capital is often below the cost of capital which leads to destruction of value through growth.
2.1.1.3 The Discount Rate
The discount rate should represent the opportunity cost of funds invested. This opportunity cost is the return an investor could expect to receive if he invested his money in an asset with similar risk (Froot and Kester, 1995). Opportunity cost can also be seen as a risk premium added to a risk free rate (Luehrman, 1997).
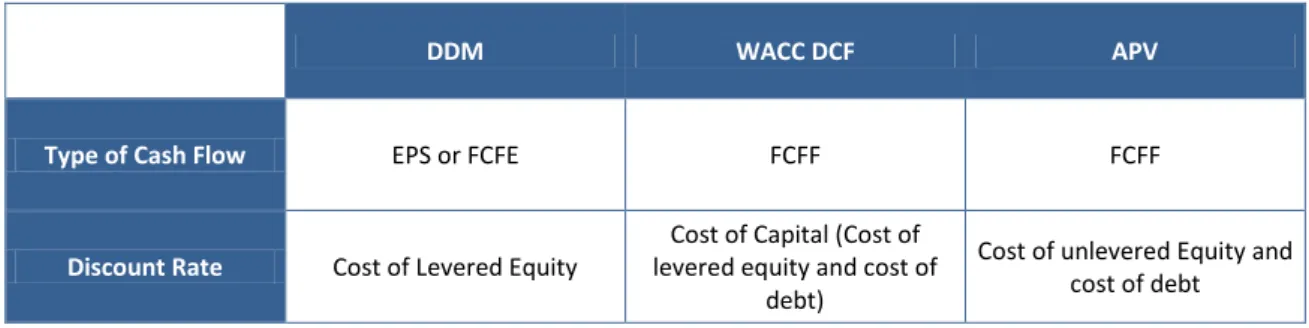
Different discount rates should be used depending on the DCF technique we are using: Table 1: DCF techniques and discount rates
DDM WACC DCF APV
Type of Cash Flow EPS or FCFE FCFF FCFF
Discount Rate Cost of Levered Equity
Cost of Capital (Cost of levered equity and cost of
debt)
Cost of unlevered Equity and cost of debt
6 M&A: ARM takeover by Intel
2.1.1.4. Cost of Equity
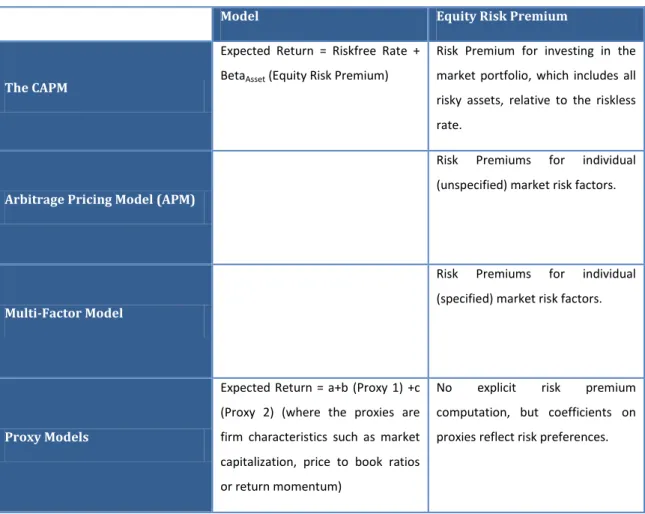
Table 2: Equity risk premium models (Damodaran, 2010)
Model Equity Risk Premium
The CAPM
Expected Return = Riskfree Rate + BetaAsset (Equity Risk Premium)
Risk Premium for investing in the market portfolio, which includes all risky assets, relative to the riskless rate.
Arbitrage Pricing Model (APM)
Risk Premiums for individual (unspecified) market risk factors.
Multi-Factor Model
Risk Premiums for individual (specified) market risk factors.
Proxy Models
Expected Return = a+b (Proxy 1) +c (Proxy 2) (where the proxies are firm characteristics such as market capitalization, price to book ratios or return momentum)
No explicit risk premium computation, but coefficients on proxies reflect risk preferences.
As we can see in table 2 there are several models for estimating equity risk premiums. We will focus our attention on the first one: the Capital Asset Pricing Model (CAPM). The model presented first by Sharpe (1964) and Lintner (1965) is the most widely used in Finance.
The CAPM will use three components to calculate a return on equity (re): a risk free rate (rf), a
market risk premium (rm-rf) and a β. This will result in the following model:
The model is based on the assumption that an investor can be diversified in the market and that what is really important is the market risk the investor bears and not the specific company risk. This way the β will be a measure of the market exposure that an investor can get through certain asset, and thus the investor should be compensated by such exposure to the market.
7 M&A: ARM takeover by Intel
2.1.1.5. The Risk Free Rate
The risk free rate is the building block for estimating both the cost of equity and the cost of capital. The risk free rate is the return that an investment delivers in any scenario, no matter what the return on this investment will be uncorrelated with other risky investments. This means that the return will have no variance around the expected return and that the final return will be equal to the expected return.
There are two basic conditions for an investment to be risk free (Damodaran, 2008):
1. There can be no default risk, which means that only government securities can be seen as risk free because governments control the printing of currency which means that they can at least guarantee the payment of the nominal amount promised. Some caution however must be used when stating that government securities are default free because it can be the case that governments refuse to honor their obligations, or in some cases governments issue debt in different currencies that their own, which means that they have no control over the printing of that currency.
2. More subtle is the requirement that there can be no reinvestment risk in the investment for this to be risk free. A bond that pay a fixed amount every six months during five years can be default free, but the fact that one cannot know the interest that the intermediate coupons will earn after being received. A good solution to overcome this problem is to use a zero coupon bond, which only pays the totality of its value in the end of the five year period, giving us an explicit risk free rate for that five year period. This means that risk free rates for different periods must be taken from bonds with different maturities.
Since risk free rates vary depending on time horizons and the cash flows we are discounting come from different periods, Damodaran (2008) suggests the use of an average duration of cash flows (a weighted average of the cash flows and the time remaining for their existence) to calculate the duration of the risk free security used as the risk free asset.
Copeland et al. (2000) suggest the use of a ten year bond rate as the risk free rate. In our case, the US treasury bond will be used as the risk free rate for the home cash flows and the British government bond will be used as the risk free rate for the foreign cash flows.
8 M&A: ARM takeover by Intel
2.1.1.6. The market risk premium
The market risk premium is the difference between the return on the market and the return on the risk free investment (rm-rf). Several ways can be used to estimate risk premiums,
Damodaran (2010) points three ways to proceed with this estimation:
1. Survey Premiums – Going directly to investors and ask them about the expected return they require to invest in the market. Despite the increasing number of surveys available few analysts use this method to evaluate risk premiums. Among other reasons for not using this method, Fisher and Statman (2000) found that the relation between this surveys and the real risk premiums has the wrong sign.
2. Historical Risk Premiums – This is the most widely used approach to estimate risk premiums. Three factors must be taken into account when calculating risk premiums. The first is the time period to use. Goetzmann and Ibbotson (2005) suggest the use of a long time series to calculate the risk premium in order to achieve a more accurate estimation. The risk free rate used and the market index used also play a part on the final results that. A broadest market index should be used and the index should be market-weighted and free of survivor bias. Finally the averaging can be arithmetic or geometric but if we accept that returns are uncorrelated over time Damodaran (2010) says that the arithmetic average is the better and most unbiased estimate of the risk premium.
3. Implied Equity Premiums – Implied risk premiums in current dividend yields or risk premiums implied by Option Pricing Models could be used and, if we consider that they are forward looking instead of historical and mean reverting premiums, are very appealing, however the disagreement over their predictive power make this option less used.
2.1.1.7. The Beta (β)
To complete the model, we will use a relative measure of the systematic risk the company is exposed to. The value is standardized around one and a value bigger than one would mean that the company amplifies the market fluctuations. The β is a measure of the covariance of the returns of an asset with the returns of a market portfolio, divided by the variance of the market portfolio (Kothari and Shanken, 2002) and Damodaran (2002) refers that the usual procedure to the estimation is to regress the returns of the asset against the returns on a market index, if possible a market index that is market-weighted and with the largest possible number of securities, however Fama and French (1996) pointed that good proxies for this
9 M&A: ARM takeover by Intel market portfolio were yet to find and that could be the reason why βs were not enough to explain expected return. The time period to use in the regression should be reasonable, with a minimum of three years but preferentially five or ten years. One must be careful when calculating betas to understand if in the last years the company suffered important changes that would change the landscape of the firm and this way the beta of the firm. Copeland et al. (2000) suggest the estimation of industry betas to provide information about the reasonability of our company beta. The author also suggests the de-leverage of the betas in order to estimate the industry average beta and the re-leverage of the beta only in the end of the process. Another advanced hypothesis is the use of unlevered industry betas publicly available. The relation of levered and unlevered betas is given by the following expression:
2.1.1.8. Cost of Debt
The cost of debt is composed by a premium on top of the risk free rate. If we assume that the projects we are valuing are of the same risk as the company, a good estimate for the cost of debt are the observed market rates of return on the firm’s debt securities (Miles and Ezzel, 1980), Froot and Kester (1995) also agree with the use of market rates of return on the firm’s debt securities as long as the firm’s debt is “nearly riskless”. Another reasonable approach is to use rating agencies’ bond ratings to sum up a spread on top of the risk free rate.
2.1.2. APV vs. WACC
Weighted Average Cost of Capital (WACC) and Adjusted Present Value (APV) are the most common DCF methods used. They differ on discount rates used and on how they treat tax shields.
The WACC model discounts the cash flows to the firm as if the firm had no debt or tax shield from interest payments. According to Damodaran (2006) the tax benefits and the bankruptcy costs are implicit in the model through the discount rate:
The equity and debt values used should be the market values.
APV in the other end does not capture the effects of the tax shields and bankruptcy costs on the discount rate. Introduced by Myers (1974), this model sum up two pieces, to get to the company value: the first piece is the FCFF discounted at the unlevered cost of equity (the cost
10 M&A: ARM takeover by Intel of equity that would exist if the firm had no debt), and then adds the value of tax savings that arise from the use of debt. This model is used to isolate and understand the effect of taxes in valuation (Copeland et al. 2000). Tax savings are calculated in the following way:
There are different approaches regarding the rate used to discount the tax benefits, Kaplan and Ruback (1995) used a version they named Compressed Adjusted Present Value where they discount the tax benefits at the unlevered cost of equity, arguing that debt was proportional to firm value and so the tax shields were so risky as the firm itself, while Luehrman (1997) and Cooper and Nyborg (2006) prefer to use the cost of debt to discount back the tax benefits, claiming that companies will almost always be capable of paying interest, but sometimes they will not enjoy the benefits of the tax shields. The APV model also requires the estimation of the cost of Bankruptcy, but as Warner (1977) argues that the costs of bankruptcy from increased leverage are low, and in the case of our companies the levels of debt are really low, we will not focus on this question.
Both models have adherents with Luehrman (1997) stating that the APV is a better model because its more flexible than the WACC, less prone to errors and gives much more output than the WACC. By the other side Damodaran (2006) points that the major problem with the APV is that dealing with bankruptcy costs is often difficult when using the model.
To reach equity values both models need to subtract the debt value from the value of the firm.
2.1.3. Relative Valuation – Multiples
Multiples are usually ratios that link firm or equity values to performance indicators. As long as firms have a peer group or an industry to be compared against, multiples is a valid way to go.
Multiples can take several forms: Price/Earnings, Price /Book Equity, Price/Sales, EV/EBITDA, EV/Sales. Any performance measure that seems adequate to infer the value on that relative industry is valid, and specific measures are more suited to specific industries.
Kaplan and Ruback (1996) find evidence that DCF methods explain better market prices but they stress that when used together, “comparable-based estimates added explanatory power to the DCF-based estimates”. Goedhart et al. (2005) refer that multiples are a good way to stress-test the cash-flow valuations done previously. Moreover multiples are forward looking
11 M&A: ARM takeover by Intel because they are based on market expectations and in the presence of possible transactions they already include the premiums.
EBITDA based multiples yield the best results on the sample studied by Kaplan and Ruback (1996) and Enterprise Value/EBITDA is one of the most widely used multiple in practice, according to Fernandez (2001).
According to Goedhart et al. (2005) there are some rules to create the right multiple. The Return on Invested Capital (ROIC) should be similar among firms and the same should happen with their growth prospects. The multiples used should be forward looking: the inclusion of expected profits would be the better but if reliable forecasts are not available then it is imperative to use the latest possible data. The use of enterprise value multiples is also advisable because they are not so reactive to the firm financial structure, when comparing with price/earnings ratios for instance. Finally one must adapt the result for nonoperating items as excess cash in the firm.
2.2. M&A Issues
For an acquisition to make sense, the total value creation (synergy) from the deal should be positive (Eckbo, 2009) and this is usually the case. However the acquirer will only increase its value if it can achieve performance improvements that are greater than the premium paid (Dobbs, Huyett and Koller, 2010). There are several possible outcomes in an acquisition attempt: the acquirer may fail to take control of the target, it may lose it to an offer from a rival company or it can be successful. The strategy and the rationale behind the deal, the fit between the companies and even the bidding strategy used by the acquirer play an important defining the final outcome. In this section we will focus on the main M&A issues. Initially we will focus on the different possible types of M&A deals, then there will be a section on the value creation (synergy) that arises from the deal, a third section will be dedicated to how this synergy is shared between the target’s and the acquirer’s shareholders and in the last section we will address the deal structure.
2.2.1. Types of M&A
For different reasons, acquisitions do not take always the same format. Damodaran (2002) divides them into different categories, depending on the buyer and on the method of execution:
12 M&A: ARM takeover by Intel The acquisition can take the form of a merger. When this is the case the acquired firm becomes part of the acquiring firm. For this to happen shareholders of both firms must agree with the merger.
Another possible form is a consolidation. In this case a new firm is created and the shareholders of both the acquirer and the target receive shares of the new firm.
Tender offer is traditionally used for hostile takeovers. One case where this is usual is
when firms find an underperforming target and try to redirect their operations into a more profitable direction (Bruner, 2004). In this procedure the acquiring company bypasses the board of the target and goes directly to its shareholders with an offer. If the acquiring firm is successful in acquiring the totality of the stocks the target ceases is absorbed by the acquirer and a merger happens, otherwise the target firm continues to exist.
There is also the possibility of buying only part of a firm. This can be done through a
purchase of assets. Despite the firm is not being sold, there is the need for the
shareholders of the target firm to vote the deal.
There is also the possibility of the company be bought by its own management or a group of investors. These deals take the form of MBO’s when the management buys the firm and LBO’s when the operation is largely financed by debt. In both cases the firm ceases to be publicly traded and becomes a private firm. This will not be the case however and we will not focus our attention in these two cases.
2.2.2. Value Creation
The value creation in any acquisition depends on the magnitude of the gains achieved by the new entity born from the deal. The literature refers mainly two types of gains that can be made: Sirower and Sahni (2006) refer to synergy as a key factor for the success of an acquisition, stating that, when a company fails to achieve it, acquiring shareholders lose money due to the premium paid. Another source of value referred by the literature is the existence of inefficiencies in the target company. Kini, Kracaw and Mian (1994) and Wruck (2008) even refer the market of corporate takeovers as a mean to discipline managerial boards and forcing them to achieve higher shareholder return. While the criteria for overall value creation stated above is usually met, this does not mean that the acquirer company always make money. For the acquirer to create value a stricter restriction must be met and the
13 M&A: ARM takeover by Intel acquirer must achieve performance improvements that are greater than the premium paid (Dobbs, Huyett and Koller, 2010).
2.2.3. Synergies
Damodaran (2005) provides a very good framework for synergy analyses. He divides synergy into two general categories and then divides these two categories into several sub-divisions. The broader general categories are operating synergies and financial synergies. While financial synergies can take the form of higher cash-flows or lower discount rates, operating synergies only appear as increased cash-flows. Operating synergies are sub-divided into four categories:
Economies of scale, which usually arises in horizontal mergers and come from the fact
that average costs should go down with dimension.
Increased market power. As the first, this synergy is more likely to occur in horizontal
mergers and occurs because of the higher market share. This leads to higher profit margins and consequently to higher cash-flows.
Combination of different functional strengths. This is a very general synergy that can
be applied to any merger.
Higher growth in existing markets and presence in new markets. As the previous one,
this synergy is very general and can be applied in any kind of merger. A good example of this kind of synergy is the acquisition of established companies in developing economies by companies of developed economies to rapidly enter the market.
Financial Synergies can also take several forms:
The combination of a firm with high return investment opportunities and no cash available and a firm with vast cash piles and no investment opportunities is a very appealing reason for a merger.
Increased debt capacity, potentiated by the decreased variance in the combined firms
profits. With higher stability the combined firm should be able to borrow more than the two companies individually.
Tax benefits. When firms can take advantage from the merger to reduce the amount
of taxes paid. This can be achieved by either acquiring a loss making firm or by being able to increase the depreciation charges with assets bought.
The last reason is diversification, however this is not a consensual reason for a merger in the literature.
14 M&A: ARM takeover by Intel
2.2.4. Inefficiencies on the target company
The other way to create value is through the acquisition of underperforming companies. Wruck (2008) points the case of managers of publicly traded companies with little equity incentives: “focused mainly on growth and diversification, often at the expense of profitability and value”. This kind of companies can be a good target for acquisitions, and then for restructuring. Shivdasani and Zak (2007) point some measures to take when restructuring public companies: their greater focus goes to increasing leverage, as a way to concentrate ownership and tightening the financial discipline of the board; divestitures of the non-core assets, going against those who point business diversification as a synergy and focus on cash-flow and cash distributions. Adding to that, Wruck (2008) also advises companies to change the incentives of boards, specifically giving equity related ownership to management. The adoption of new performance measures and the decentralization of decision making are also referred.
Despite the superior financial performance of private equity firms, the implementation of these measures does not come without costs. Cost of equity does no longer benefit from the risk-bearing economies provided by the capital markets. This creates an incentive for a return to public equity markets, however, companies that return to public ownership do not completely let go the private equity governing rules.
2.2.5. Method of Payment
Acquisitions are usually paid using cash, stocks or a mixed form of both. Additionally tailored agreements (“earnout” contracts) can be made (Zenner et al. 2008). This contracts link a future payment to the performance of the bought asset, with a higher performance resulting in a higher payment. Bruner (2004) refers other risk managing device, the use of collars, a contract that changes a future payout, if the stock of the buyer falls or rises above a certain level. These hypothesis for financing the transaction will lead to a decision that depends on several factors as the type of deal proposed, the type of firm being bought or the risk involved in the deal. Martynova and Renneboog (2009) present a framework with the reasons for the different payments. When there is asymmetric information regarding the target firm and the valuation cannot be made precisely, acquirers prefer to use equity as payment, sharing the risk of future devaluations with the target’s shareholders. The bigger the value at risk (VAR – premium paid/market value of the acquirer) the greater the incentive for paying with equity (Sirower and Sahni, 2006). Overvalued stock or credit constraints are also an incentive for using equity
15 M&A: ARM takeover by Intel as payment, the same happening with taxes, where cash is immediately taxed and equity may be kept and taxed only later. By the other side when the payment in equity may cause changes on firm control, firms tend to use more cash and less equity to finance the deal. In the case of cross-border acquisitions, cash is also preferable because target’s shareholders may not have access to information about the acquirer and consequently they will not be available to accept shares as payment. Tender offers are other case where cash is more used than equity increasing the probability of success of the bid and finally, cash is also commonly used when buying unlisted targets due to the fact that their shareholders usually sell with the objective of cash out.
2.2.6. Value Sharing Between Shareholders
Corporate Takeovers deal with a huge amount of money and they usually create value, through synergies or better use of assets. However it is important to understand how the gains from the deal are shared between the two companies’ shareholders. The three main findings in research point that target shareholders earn significant positive abnormal returns from all acquisitions, while acquirer’s shareholders end up with small or no abnormal returns from tender offers and negative abnormal returns from mergers (Loughran and Vijh, 1997).
Damodaran (2005) highlights the fact that, while in theory the division of value should be made according to the contribution each company would give to the creation of value, what happens in practice is that target’s shareholders make much more money on average than acquirer’s shareholders. This may be linked with the fact that target companies can create a process where interested companies bid for the target, creating competition among them. Sirower and Sahni (2006) argue that a better initial preparation and presentation is critical for better performance from acquirers, given that, most of the times the negative initial reaction from the market is persistent overtime. They attribute this lack of preparation, in some degree, to excessive self-confidence and consequently to a biased evaluation of the target so that the deal is done. Bruner (2004) adds that in a specific type of deal, the “merger of equals”, the evidence is even most striking, with the returns being much smaller than in the other kind of deals, and argues that in these deals target’s managers forget value creation in order to have more influence in the outcome or a better position in the new firm.
The mode of acquisition and payment also play a role on the profitability of the deal. Loughran and Vijh (1997) find that cash tender offers create superior returns for the acquirers, while stock mergers have significant lower returns. The replacement of the inefficient management
16 M&A: ARM takeover by Intel is one of the reasons for the success of cash tender offers. Additionally when acquisitions are paid in cash, markets are surer about the virtues of the deal, while when they are paid with equity markets become suspicious of overvalued equity and the quality of the deal proposed. Bruner (2004) also points these facts and add some points to this analysis. Credible synergies, mainly cost synergies are better accepted by the market, creating positive reactions, while revenue synergies may be viewed as more risky. Buying during cold M&A markets also pays better than during hot ones. Finally companies which maintain the focus on the core business achieve better results than companies who try business diversification.
17 M&A: ARM takeover by Intel
3. Industry and Company Analysis
3.1. Industry Analysis
Semiconductors play a crucial role in today’s life and have changed society in uncountable ways, during the last forty years. Nowadays semiconductors are present in an incredible large number of devices people use every day, from dishwashers to machine tools, passing through computers and mobile phones. The internet world we know and the last decades innovations would not be possible without the rapid expansion the semiconductors’ industry experienced. Even today, the Moore’s Law, dated from late 60’s, is still valid and the number of transistors that can be placed on a standard processor continues to double every 18 to 24 months. This rule from Gordon Moore, co-founder of Intel, helps to explain the incredibly fast rhythm of change and innovation in this industry.
Within the industry it is possible to identify five main business models:
1. Integrated Device Manufacturers (IDM) – This is the business model where Intel Corporation (from now on referred to as Intel) fits in. The companies organized as IDM operate along the entire value chain of the semiconductor industry, including the design and manufacturing of the components. As they operate along the entire production process, these companies are also the responsible for the major part of the market revenue.
2. Fabless – These companies do not own their own production facilities. They design the semiconductors and pay other companies to manufacture them. These firms control the sale of the final products. The advantage of this model is to avoid the costs incurred with the construction of the production facilities and also the fixed costs of these factories.
3. Licensing or Intellectual Property (IP) – These companies design the products and license them to another companies interested in using the design. There are no sales operations and all the final distribution is done by the companies that buy the designs. ARM operates under this method, licensing their designs to another companies, who manufacture and sell them. As a result of only operate in a small part of the production process, the sales volume from IP companies is a small part of the overall market.
18 M&A: ARM takeover by Intel 0 50 100 150 200 250 300 350 2006 2007 2008 2009 2010 Figure 3: Market size by components (PWC – A change of pace in the semiconductor
industry) Sensors and Actuators Optical Semiconductor s Discrete Semiconductor s Analog ICs Logic MPUs and MCUs
4. Foundries – These companies do not design their own products. Instead they operate modern production facilities and manufacture semiconductors for other market participants as fabless companies. The success of these companies highly depends on the capacity to keep high levels of capacity utilization in large factories.
5. Back-end Processes (Assembly and Testing) – The specialization in the industry and the increased globalization as led to the creation of companies specialized only in testing and packaging of components. Due to the lower automation of these services, these companies are mostly based in South-East Asia, particularly in Taiwan, Singapore and Malaysia, due to low labor costs.
3.1.1. Market Size and Structure
The market has some large players with market power in the specific segment they operate, as the case of Intel, which largely dominates the picture in the data processing segment, producing mainly microprocessors and the respective chipsets. However no firm has a dominant position in the entire semiconductor market. Intel is the largest firm in the sector, with a market share of approximately 14% while ARM has a much lower market share of only 0.21%. The market was worth approximately 307 billion USD in 2010.
Demand in the industry is not driven by final consumers, but instead by the needs of the industrial sectors that interact with the semiconductors industry. The main absorber of semiconductors is the data processing industry, followed by communications and consumer electronics, a wide variety of industrial applications and the automotive industry are the other
0% 2% 4% 6% 8% 10% 12% 14% 16% Int el Sam su ng E le ct ro ni cs To sh iba Te xas Ins tr um ent s R ene sa s El ec tr o ni cs C o rpo rat io n AR M
Figure 2: Market Shares in semiconductors
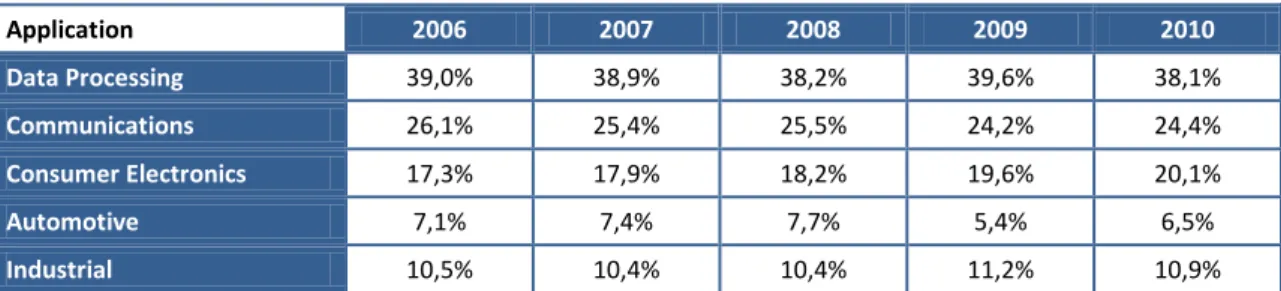
19 M&A: ARM takeover by Intel sectors that consume a huge amount of semiconductors. The sectors that have the greatest importance for our companies are the Data processing and consumer electronics sectors. Table 3: Revenue by Final Application (PWC – A change of pace in the semiconductor industry)
Application 2006 2007 2008 2009 2010 Data Processing 39,0% 38,9% 38,2% 39,6% 38,1% Communications 26,1% 25,4% 25,5% 24,2% 24,4% Consumer Electronics 17,3% 17,9% 18,2% 19,6% 20,1% Automotive 7,1% 7,4% 7,7% 5,4% 6,5% Industrial 10,5% 10,4% 10,4% 11,2% 10,9%
These divisions within the semiconductor market create a variety of small markets, which are the markets we are really interested in.
For instance Samsung, the second biggest player of the industry, produces mainly memories and storage components and also Analog ICs and image sensors, segments where Intel has only a minor presence and ARM does not compete.
3.1.1.1. Microprocessors
With that in mind it is important to have a closer look at the segment that is really at stake: the microprocessors segment. Historical data for market shares and sales are not readily available but some data from 2010 is known.
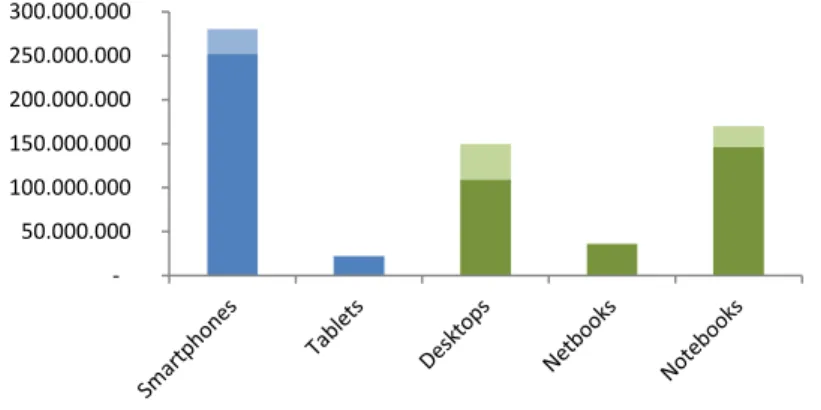
The market can be divided into different dimensions, namely the architecture used and the destination platform. The most used architectures are the x86 (Intel and AMD are the main producers); ARM developed by ARM; Cell Broadband Engine Architecture developed jointly by IBM, Sony and Toshiba; Power Architecture developed by IBM and Sun Scalable Processor Architecture developed by Oracle. From all this we will focus our attention on the two most widely used: x86 and ARM. As destination platforms we have desktops, notebooks, netbooks, tablets and smartphones. Servers will not be present in our analysis because we do not expect them to be in the center of the dispute between x86 and ARM architecture.
As one can easily see in the graph below, the x86 architecture dominates the segments where processing power is the final objective: Desktops, notebooks and also the netbooks. ARM architecture is most used in low power devices, given its greater efficiency and lower energy consumption, providing longer battery life for portable devices, like tablets and smartphones.
20 M&A: ARM takeover by Intel - 50.000.000 100.000.000 150.000.000 200.000.000 250.000.000 300.000.000
ARM Architecture market Share Intel Market Share - x86
AMD Market Share - x86 Others
Figure 4: Unit Sales by platform
A closer look at the notebook, netbooks and desktop segment shows that these segments are dominated by Intel, with market shares always above 70%. AMD also plays an important role in these segments, with market shares that can reach almost 30% in the desktop segment.
By the other side the smartphone and tablet markets are dominated by the various providers of ARM architecture – Qualcomm, Broadcom, Texas Instruments, Nvidia, among others. This dual market is expected to end in the near future, with both architectures entering the segments of the other one. Notebooks and Netbooks using ARM architecture are already planned for 2012 and Intel already announced mobile phones with Atom processors for the second quarter of 2012. With this said the trend for the future should be for architectures to lose some ground where they are very strong, and on the other side to gain share where they are not present right now. For now, ARM seems to start with a small advantage, because the lower power of their devices is compensated by a larger battery-life, and even if some computers already reach about ten hours of battery life, for sure there is a market for computers than can run for longer than ten hours without the need of external power. However, for Intel to make the other way around, it should be slightly more difficult, as actual smartphones have some troubles running for an entire day if not idle (browsing the web, playing music, receiving e-mail), and Intel processors are believed to be more powerful but also more power hungry.
However during the past years Intel has achieved incredible progresses, both on performance and power consumption of his x86 processors for computers and notebooks, giving AMD a secondary role in those markets, and it is difficult to imagine that, with their research
21 M&A: ARM takeover by Intel capabilities (more than $6Bn in 2010) and some time, Intel will not be able to fiercely compete with ARM products.
3.1.2. Margins and Growth
The data collected regarding profit margins, across the entire market, is scarce and only accounts for 2007 and 2008.
The values represented in the graph are the average profit margins collected by Price Waterhouse Coopers (PWC) in their report. The averages for 2008 are all negative with special focus on the memory IDM companies, where high installed capacity and the world economic downturn created a downward pressure on prices, leading to the losses we can see here. It is interesting to note that Intel over perform their IC IDM peers in both 2007 and 2008 and also that ARM does better than the average of the companies presented. The lack of a control group for ARM should also be noticed, as the segment is not relevant enough for PWC to present values on the IP companies.
The values presented for margins can be in part explained by a market with a very cyclical behavior. During periods of high growth operating margins usually assume higher values, as installed capacity is not enough to satisfy all the demand, while in periods of economic contraction, the accumulation of stocks and the excess installed capacity create the conditions for price falls that lead to negative profits. During the last 20 years this process has happened repeatedly, and sometimes with incredible contractions and expansions in the total market size. -80% -60% -40% -20% 0% 20% 40% IC IDM Memory IDM Fabless Foundry
Assembly and Testing
2008 2007 Figure 5: Profit Margins for the Semiconductor Industry (PWC – A change of pace in the semiconductor industry)
22 M&A: ARM takeover by Intel As it is possible to see in the graph the growth of almost 40% in 2000 was followed by a sharp downfall of about 30% in 2001, to lower values that the ones from 1999. Due to this characteristic of the market, many firms opted to accumulate a great portion of capital, in order to accommodate some negative years and enjoy the high CAGR this market as proportioned during the last 20 years (8.9% in the 1988-2008 period).
3.1.3. Market Prospects and Trends
The last years saw the semiconductors and microprocessors industry diverging from the historical performance the industry was used to achieve. However the next years should bring a return to high growth and to higher profits. Growth should be achieved by higher unit sales in developing countries and by new products and also increased unit sales in developed economies.
The following years should also experience the following trends in the market:
1. Platforms are going mobile. Microprocessor receptors are increasingly portable or mobile equipments – smartphones or tablets. The number of desktop sales should even decrease until 2015 according to Royal Bank of Scotland expectations. This will create the need for more energy efficient microprocessors, which can increase the battery life of these smaller devices. The fourth generation of cellular wireless should also be a factor with positive influence with respect to this factor.
45 49 51 55 60 77 102 144 132 137 126 149 204 139 141 166 213 227 248 256 249 -40% -30% -20% -10% 0% 10% 20% 30% 40% 50% 0 50 100 150 200 250 300 1988 1989 1990 1991 1992 1993 1994 1995 1996 1997 1998 1999 2000 2001 2002 2003 2004 2005 2006 2007 2008 Sales Growth rate Figure 6: Semiconductor Historical Sales (PWC – A change of pace in the semiconductor industry)
23 M&A: ARM takeover by Intel Figures 7a e 7b: Unit’s predictions (Royal Bank of Scotland) for microprocessors sales and revenue estimation (using Intel asp predictions) until 2015
2. Cloud Computing. With the increase in the number of small and relatively low power devices, cloud computing is on the next door. This means that the work that is done nowadays in each device, will be done in the future in some datacenter, with enough processing power to run heavy applications, and the mobile device should only be seen as an interface between the end user and the application.
3. Integration of several semiconductor components into one chip set. Both Intel and AMD already have solutions that provide both processing and graphic units in only one chip set and more and more similar architectures should reach the market in the near future. This solution provides greater energy efficiency and also better performance than the separate components would provide.
- 200 400 600 800 1.000 2010 2011 2012 2013 2014 2015 M ill io n s
Units
Notebooks Netbooks Tablets Desktops Smartphones $0 $5 $10 $15 $20 $25 2010 2011 2012 2013 2014 2015 B ill io n s
Revenues
Notebooks Netbooks Tablets Desktops Smartphones
24 M&A: ARM takeover by Intel
3.2. Recent Trends in M&A market and insights semiconductor industry
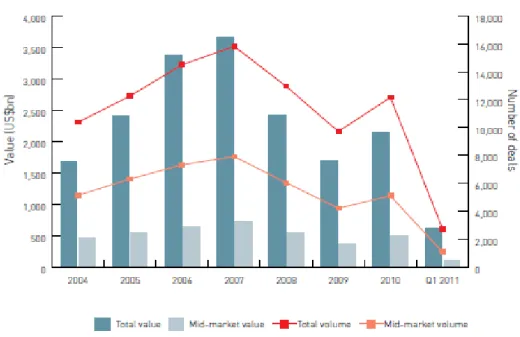
In 2011 the global M&A market should still be far from reach the value achieved in 2007. Since then the M&A market faced tough years, with lack of confidence and credit restrictions. 2009 was the year with the least transactions and value transacted. Private equity firms were the ones that contributed the most for this scenario, given that in 2009 the volume they created was almost 10% of the volume transacted in 2007. Corporate transactions also suffered but they sustained the market during 2008 and 2009. It is important to notice that, if M&A volume decreased a lot, the volume as a share of global market capitalization remained fairly stable, which is and indicator that M&A was not as harshly affected as it may seem.
Figure 8: M&A trend (A Global View on M&A 2011 – KPMG)
During the last months the volume of transactions increased and in 2010 the market recovered for 2008 values. The year in progress is expected to continue the recovery and some big deals already happened in the first quarter of the year. Leading the recovery, the energy sector provided some deals early this year (Duke Energy Corporation acquisition of Progress Energy Inc. valuated in more than $25Bn is just an example). Telecommunications is another sector that provided big deals, the most notorious being the acquisition of T-Mobile USA Inc. by AT&T in a deal valuated in $39Bn.
25 M&A: ARM takeover by Intel This increase in M&A activity is being fuelled by different objectives, from consolidation in Telecoms, to expansion objectives in Consumers giants. In the technology sector there is also an increase in M&A activity in the first quarter of 2011, with a share of 4,5% in the total M&A activity measured in values, which corresponds to almost $28Bn, $18Bn more than in the same period last year. There are several reasons for this increase in the technology sector. First of all, businesses seek to provide an end-to-end business solution. Intel acquisition of Mcafee and Oracle acquisition of Sun Microsystems are just two examples of companies trying to offer a wider range of products to consumers. Cloud computing is in the next corner and companies are also trying to get ready for what is to come. Virtualization and networking technologies will be the key in this new cloud computing environment, and companies with cutting edge management tools and the most flexible security products will be the most probable acquisition targets. In the end all of this will be possible due to the rich cash balances accumulated during the crisis by technology companies.
3.2.1. Intel and ARM recent acquisitions
Even during the crisis Intel and ARM made several acquisitions, widening their capabilities and providing better offering in their micro processing solutions.
ARM made several acquisitions since the creation of the company. These acquisitions are usually small and intend to use the technologies of these companies. The last acquisition announced was the bought of Obsidian Software, a privately owned firm expert in verification and validation used in the design of increasingly complex processors. Before that, in 2006 the company acquired Falanx, a developer of 3D graphic accelerators and SOISIC, a company specialized in physical IP.
The hottest period of acquisitions by Intel was between 1997 and 2002, when the company acquired about forty companies. In more recent years Intel has not been so active in the market, however in the last year it announced several acquisitions: Wind River, Wireless Solutions Business of Infineon (WLS) and most recently McAfee in a deal valued in $7.68Bn. The most interesting for our case is the acquisition of WLS, which already provides Intel with an access to ARM technology for Smartphones and other mobile applications.
3.2.2. Rational for the deal
Despite the multiple deals Intel conducts every year, few should have the dimension of the proposed one. Most acquisitions are done to get access to small new technologies that can be
26 M&A: ARM takeover by Intel incorporated in already existing components. Some others, as the case of McAfee right now, are used to provide more complete solutions in their products.
This particular deal is different from the two previous pointed cases. ARM does not represent some small new technologies that can be incorporated into existing Intel microprocessors, and ARM also does not represent some technologies outside Intel core business, as it is the case of McAfee. ARM is in fact a competitor of Intel, with totally different microprocessor architecture. The particular reasons that make this buying attractive for Intel are the following: 1. Getting rid of the threat ARM represents in the netbook/notebook space, particularly
in the low end segment, where performance is not that important, and weight, battery-life and price are key. Nowadays this segment is dominated by Intel, with a small share owned by AMD, but ARM processors are now trying to enter this market, being tablets the entrance door. It is critical for Intel to maintain its position here because the notebook/netbook space represents more than 25% of Intel total revenue.
2. Entering the tablet/smartphone market, which Intel is already trying but without much success. If in 2015 Intel had 15% of market share in smartphones, that would give them about $2.5Bn revenues per year, which is respectable but relatively small when compared to the notebook business that should be worth more than $15Bn by then. However if they could reach a market share more similar to the one ARM is predicted to dominate by then, Intel could collect almost $10Bn in revenues in 2015. The same, even if in a lower degree, scenario is applicable to tablets.
It will be difficult to get immediate results from this strategy, as the technology that should be used in the next few years is already licensed. However as the time goes by and the licensed technology becomes obsolete, Intel should create and edge that can guarantee the technologic leadership of the market. This should not happen before 2014/2015.
3. Capture a larger share of the added value than ARM does. Nowadays the typical value of a tablet microprocessor rounds $20. This is also the target price for the processors of the most powerful smartphones.
ARM receives a fee of about 1-2.5% which translates in 20 to 50 cents of dollar for each processor. Intel would be able to receive the entire value of the microprocessor. A simple exercise can exemplify how Intel would put this in practice.
27 M&A: ARM takeover by Intel Table 4: Revenue Hypothesis for the smartphones and Tablet markets
Company Smartphone and Tablet
Units/year Average Selling Price Revenue/year
ARM ~272M 20 USD * 2% = 0,4 USD $108M
Intel 50M 20 USD $1 Bn
Even if Intel could only take about 50M of the current 270M units being sold nowadays by ARM, Intel revenues would be approximately ten times larger.
If Intel manages to keep a gross margin in line with its historical one, about 60%, each chip will be much more valuable for Intel than what they are nowadays for ARM and Intel will be able to extract much more revenue than ARM from this market.
4. Getting return from the cash reserves. Intel has a total of $22Bn ($5.5Bn in cash and $16.4Bn in short-term assets) that can be used to finance new investments and provide better returns to shareholders. With this amount Intel can easily buy ARM and also keep a cash amount that provides liquidity enough to keep the business running without concerns.
The deal would also face some difficulties. If a counter-bid by one company alone does not seem likely (actual ARM customers do not have the dimension to carry the deal easily), a deal from a consortium of several of that companies would not seem so improbable. The actual ARM customers seem to be the ones that can lose the most from this deal and it seems natural that they would try to keep “their” research company working with them instead of losing it for their main competitor.
Another possible barrier would be the approval of the transaction by competition authorities, given that Intel already has such a dominant position in the microprocessor market, and this transaction would just increase that dominance.
3.3. Company Analysis
3.3.1. Intel Corporation
Intel is the largest semiconductor company in the world, with total sales in 2010 totalizing more than 43 billion Dollars. The company was founded in 1968 by Gordon Moore and Robert Noyce, former employees of Fairchild Semiconductors. The company initially focused its business on memory devices, namely in static random access memory (SRAM) chips, before turning its attention to other types of devices.
28 M&A: ARM takeover by Intel In 1971 Intel presented the first microprocessor in the history, the Intel 4004, developed for a calculator. In 1972 they followed with one of the first microcomputers and during the seventies Intel developed some more work in the field on microprocessors. It was only during the decade of 1980 that, with reduced profitability in the memories market and the success of the IBM personal computer, Intel changed the business model and focused its attention on microprocessors. During the eighties and the last decade of the 20th century Intel met
incredible growth and the Pentium brand became a beacon in the industry.
Turning into the new century Intel faced some challenges, posed by slower growth in demand for high-end microprocessors and increased competition from Advanced Micro Devices (AMD) in Intel main market (x86 architecture microprocessors). AMD entered the market initially through low-end and mid-range processors, but it achieved significant market share across the entire product range.
It was only in 2006 that Intel started to react to the challenge posed to its market position. Faced with declining market shares and profits Intel introduced a new product development program. This program was based on a quicker architecture development regarding microprocessors and it delivered results very quickly. In 2007 Intel launched its Core architecture, which was a huge improvement over the previous generation performance and just like that Intel regained the domination it had enjoyed several years before. Since then Intel continued to improve its products and has nowadays a clear domination of the x86 microprocessor market.
By the end of the decade, Intel has regained his position as the uncontestable leader of the market. In 2010 its main source of revenue continues to be Microprocessors but Intel also has entered into other business areas. Chipsets and motherboards are offered by Intel has a mean to complete their microprocessor offer, given that the entire set is necessary for a computer to work; wired and wireless connectivity solutions are available, both in the form of embedded cards for desktops, notebooks and netbooks or more complex solutions for fixed or mobile networks; NAND flash memory, for use in consumer electronics, as cameras or music players, or in the form of solid-state drives (SSD), is also part of the Intel product portfolio.
29 M&A: ARM takeover by Intel
3.3.1.1. Business Structure
Figure 9: Intel Revenue by Operating Segment Figure 10: Revenue Growth by Segment
Intel is divided into five operating segments. The PC Client Group offers microprocessors and related chipsets for the desktop, notebook and netbook markets. It also offers motherboards and wireless connectivity products related to this segment. The range of microprocessors available goes from the i7 second generation desktop processor to the energy efficient Atom processor for netbooks. In 2009 more than 75% of the total revenue of this segment was originated by microprocessors sales, and only the rest from all the other components.
The Data Center Group activity is related with the products sold to companies for use on servers, workstations, datacenters or cloud computing environments. Xeon and Itanium are the families of processors now in use in the field. The importance of microprocessors in this segment is even more evident than in the PC Client Group with more than 82% of revenue driven by microprocessors sales.
The Embedded and Communications Group - offers processors and chipsets for embedded components for industrial, medical and in-vehicle applications - together with the Ultra-Mobility Group - supplies Atom processors for handsets - and the Digital Home Group - supply several products for applications in consumer electronics (digital TVs, Blu-ray devices, Hard-Disk Drives, among others) - form the Other Intel Architecture Operating Segment. This is the group where the new revenues by increased sales from ARM processors should be included. Other revenue comes from the NAND solutions group and the Wind River Software Group, which offers software solutions for embedded and handset segments.
- 5.000 10.000 15.000 20.000 25.000 30.000 35.000 40.000 45.000 50.000 2007 2008 2009 2010 Corporate Other Revenue Other Intel Architecture Operating Segments Data Center Group PC Client Group -40% -20% 0% 20% 40% 60% 80% 100% 120% 2008 2009 2010 PC Client Group Data Center Group
Other Intel Architecture Operating Segments Other Revenue