CATHOLIC UNIVERSITY OF
PORTUGAL
.
PORTO
FACULTY OF ECONOMICS AND MANAGEMENT
MASTER
Master in Services Management
Master’s Final Work Type
Subject
Student name
Date
Acknowledgments
Sincere gratitude is hereby extended to the following who contributed and helped in the elaboration of this manuscript.
Prof. Conceição Portela, the thesis supervisor, for all useful critics, constant support and excellent guidance during the different phases of this Master‟s Final Work;
Jose Torres and Gonzalo Vilar, CEO and partner of Bloom Consulting, for the opportunity of developing this study in an incredible work environment and for all demonstrated support;
For the motivation, encouragement and many clarifications provided by my colleagues at Bloom Consulting;
My family and friends who always supported me moral and emotionally.
List of abbreviations
B2B: Business to Business B2C: Business to Consumer
CAGR: Compound Annual Growth Rate CRS: Constant Returns to Scale
DEA: Data Envelopment Analysis DMU: Decision Making Unit
EMS: Efficiency Measurement System EG: Economic Growth
EP: Economic Performance EU: European Union
FCTY: Fashion City
FDI: Foreign Direct Investment HDM: Hierarchical Decision Model IPA: Investment Promotion Agency
ISYDS: Integrated System for Decision Support
MICE: Meetings, Incentives, Conferences and Exhibitions
OECD: Organisation for the Economic Co-operation and Development OP: Online Performance
RT: Rating SM: Social Media
TBO: Tourism Board Organization VRS: Variable Returns to Scale WR: Weight Restrictions
Abstract
This manuscript develops a study performed during a four months internship at Bloom Consulting firm, aiming to build a tourism ranking based on a construction of a composite indicator. This ranking measures the effectiveness of brand strategies used by each of the fifty US States to attract tourism. The final goal relies on comparing Bloom Consulting results with a new ranking, obtained through the application of the Data Envelopment Analysis (DEA) methodology. Additionally, in this thesis, it was also performed a distinct analysis which relies on evaluating the ability of local Tourism Board Organizations (TBOs) to promote tourism according to the level of the budget provided.
After a detailed characterization of Bloom Consulting methodology (which ranks the nations based on the aggregation of their ranking performance on five different criteria using pre-specified weights), it was applied a different model based on DEA in order to build a new ranking of US States. Hence, using Bloom Consulting data, distinct scenarios were settled with real or rank values for the five variables and with or without weight constraints. Besides that, this manuscript also contains an analysis of the literature on the construction of nations or regions rankings, including academic studies and rankings build by other consulting firms.
The use of DEA allowed a more accurate and less subjective evaluation, where each state is able to optimize its performance score. The choice of applying the real data instead of the rank values has also contributed to a more precise analysis.
Table of contents
1. Introduction ... 1
2. Work carried out during the internship ... 2
2.1. Characterization of Bloom Consulting ... 2
2.2. Main tasks ... 2
2.2.1. US State Tourism and Trade Ranking Project ... 2
2.2.2. India Tourism Ranking Project ... 4
2.2.3. Fashion City Brasil Project ... 6
3. Methodologies for ranking nations or regions ... 8
3.1. Characterization of composite indicators ... 8
3.2. Data Envelopment Analysis (DEA) approach ... 9
3.3. Bloom Consulting approach ... 13
4. Country Branding – concepts and previous studies ... 21
4.1. Review of previous studies on countries and regions rankings ... 22
4.1.1 Existing nations or regions brand rankings build by consulting firms ... 23
Future Brand ... 23
Anholt–Gfk ... 25
4.1.2 Academic studies regarding nations or regions rankings ... 27
5. Case study – using Bloom Consulting data to produce a ranking for US states using a DEA methodology ... 29
5.1. Evaluation of state efficiency in the promotion of tourism ... 30
5.1.1. DEA model based on rank values ... 30
5.1.2. DEA model based on real values ... 33
5.2. Applying virtual weights restrictions ... 38
5.2.1. DEA model with weight restrictions in scenario I ... 38
5.2.2. DEA model with weight restrictions in scenario II ... 42
5.3. Parallel with Bloom Consulting ranking ... 44
5.5. Efficiency of Tourism Board Organizations in the promotion of tourism ... 58
6. Conclusion ... 61
References ... 63
Annexes ... 67
Annex 1: Example of Alabama clustering process for tourism... 67
Annex 2: Rank and real values databases including Economic Performance (EP), Economic Growth (EG), Social Media (SM), Online Performance (OP) and Rating (RT) values ... 69
Annex 3: DEA model based on rank values without weight restrictions ... 71
3.1. Efficiency scores and peers ... 71
3.2. Virtual weights ... 73
Annex 4: DEA model based on real values without weight restrictions ... 75
4.1. Efficiency scores and peers ... 75
4.2. Virtual weights ... 77
Annex 5: DEA model based on real values with weight restrictions in scenario I .. 79
5.1. Efficiency scores and peers ... 79
5.2. Virtual weights ... 81
Annex 6: DEA model based on real values with weight restrictions in scenario II . 83 6.1. Efficiency scores and peers ... 83
6.2. Virtual weights ... 85
Annex 7: Database used to analyse the ability of local TBOs in promoting tourism including TBO Budget, Online Performance (OP) and Rating (RT) values ... 87
Annex 8: DEA model based on the budget TBO, online Performance and rating values aiming to evaluate the ability of local TBOs in promoting tourism ... 89
8.1. Efficiency scores and peers ... 89
Tables Index
Table 1: Examples of Alabama clustering process ... 3 Table 2: Rating scale classification ... 18 Table 3: Relative normalisation process of the economic performance variable for the 50 US states ... 19 Table 4: Comparison of the 13 benchmarks of DEA model based on rank values without WR in terms of virtual weight of each variable ... 31 Table 5: Comparison of the 13 benchmarks of DEA model based on rank values without WR in terms of rank data ... 32 Table 6: Comparison of the 9 benchmarks of DEA model based on real values without WR in terms of virtual weight of each variable ... 34 Table 7: Original and normalised data of the 9 efficient states in DEA model based on real values without WR ... 36 Table 8: Scenario I - Attributed virtual weights restrictions to each variable ... 39 Table 9: California as a peer in the DEA model with WR in scenario I (CA - California; NY - New York) ... 41 Table 10: Scenario I Ranking ... 42 Table 11: Scenario II - Attributed virtual weights restrictions to each variable ... 42 Table 12: Comparison of scenario I and II in terms of efficiency score and variables attributed weight regarding New York and Florida ... 43 Table 13: Scenario II Ranking ... 44 Table 14: Comparison between Bloom Consulting ranking and DEA rankings with and without weight restrictions (WR) ... 45 Table 15: Correlations between DEA (with and without WR) and Bloom Consulting rankings ... 47 Table 16: Comparison of Illinois, New Jersey and Hawaii attributed weights in Bloom Consulting and scenario I ... 48 Table 17: Comparison of real and rank values of New Jersey and its peer (New York) ... 50
Table 18: Inverted ranking and normalised rank and real values for New Jersey and its peer (New York) ... 50 Table 19: Comparison of real and rank values of Illinois and its peer (New York). 53 Table 20: Inverted ranking and normalised rank and real values for Illinois and its peer (New York) ... 53 Table 21: Original and normalised data of Delaware, West Virginia and Road Island ... 57 Table 22: Comparison between Maryland TBO original data and its peers (Utah, West Virginia and North Dakota TBOs) ... 60
Figures Index
Figure 1: Top 10 of Bloom Consulting Country Brand Ranking Tourism Edition 2012 (Source: Bloom Consulting, 2012a, pp. 7) ... 15 Figure 2: The Nation Brand Hexagon (Source: adapted from Anholt 2005) ... 25 Figure 3: Comparison of the 5 variables average virtual weight for DEA model based on rank values ... 32 Figure 4: Comparison of the 5 variables average virtual weight for DEA model based on real values ... 35 Figure 5: Comparison of the 9 benchmarks of DEA model based on real values without WR in terms of original data ... 37 Figure 6: Efficiency score variation of the benchmarks of the DEA model without weight restrictions (WR) and of the benchmarks in scenario I ... 39 Figure 7: Graphical comparison of rank and real values between New Jersey and its peer (New York) ... 51 Figure 8: Graphical comparison of rank and real values between Illinois and its peer (New York) ... 54 Figure 9: Comparison of the original data between the three worst states in DEA ranking with WR in Scenario I ... 57
1
1. Introduction
This report aims to provide an overview of the research conducted in country branding field, associating an internship carried out at Bloom Consulting firm with an analysis of the ranking of US states using Bloom Consulting data. The main goal encompasses a critical analysis on Bloom Consulting methodology for ranking nations/regions and the suggestion of a new one.
After a brief introduction in the first part of this manuscript, section 2 describes the activities carried out during the internship at Bloom Consulting, including some of the key projects and details regarding the main tasks carried out. In the third section it is conducted a description of the main steps to build a composite indicator, focusing on Data Envelopment Analysis (DEA) methodology. It also includes a detailed explanation of the approach followed by Bloom Consulting in order to construct nations/regions rankings. A detailed analysis on country branding and nations/regions rankings is provided in section 4 with a literature review on this subject. Lastly, section 5 presents an alternative approach to nations/regions brand rankings, particularly to US states brand ranking released by Bloom Consulting in 2012. It is also possible to find a comparison between the two methodologies. In this last section the ability of local Tourism Board Organizations (TBOs) to promote tourism given their level of budget is also evaluated.
2
2. Work carried out during the internship
This section contains a brief description of the firm and the main tasks carried out during the internship at Bloom Consulting in Madrid, performing activities as an analyst.
2.1. Characterization of Bloom Consulting
Bloom Consulting is a strategy consulting firm founded in 2003, specialized in country branding working for both nations and cities around the world. Every year Bloom Consulting launches the Country Brand Ranking for both tourism and trade. Besides development of countries, Bloom Consulting also works on business strategy projects such as positioning, strategy and business plans, innovation and internationalization, as well as human asset management.
2.2. Main tasks
During the internship at Bloom Consulting it was possible to participate in several projects, performing very different tasks. However, the more relevant ones were US State Tourism and Trade Ranking, India Tourism Ranking and Fashion City Brasil. The US and India projects are associated to the development of countries, namely regions brand ranking. Fashion City as a strategy and positioning project belongs to the business strategy area.
2.2.1. US State Tourism and Trade Ranking Project
The US project relies on ranking the 50 American states in terms of tourism and trade. It is an internal project, in the sense that no client commissioned this project. The 2012 edition is the first edition of the US State Ranking released by Bloom
3
Consulting, which evaluates the last five years of all fifty states‟ branding performance.
The elaboration of the ranking includes different variables as will be explained later in this manuscript. Some of the tasks performed during the internship regard the collection of hard and soft data to be used in the ranking analysis. In particular, the author was involved during the internship in the collection of soft data relating to one of Bloom Consulting‟s variables called rating or state brand strategy. The collection of data for constructing this variable is complex and time-consuming and requires numerous tasks, most of them performed during the internship. The rating variable assesses the efficiency of the communication strategies used by states in order to promote tourism or trade. In order to analyse the country state strategy, Bloom Consulting studies the communication strategy used by states and tries to understand if the state is really promoting what people are looking for. In other words, Bloom Consulting studies the supply - Tourism Board Organizations (TBOs) or Investment Promotion Agencies (IPAs) - and demand - tourists or investors. Therefore, the promotion messages used online through the official website of each TBO or IPA are collected and assigned to a certain category (named cluster) for identification.
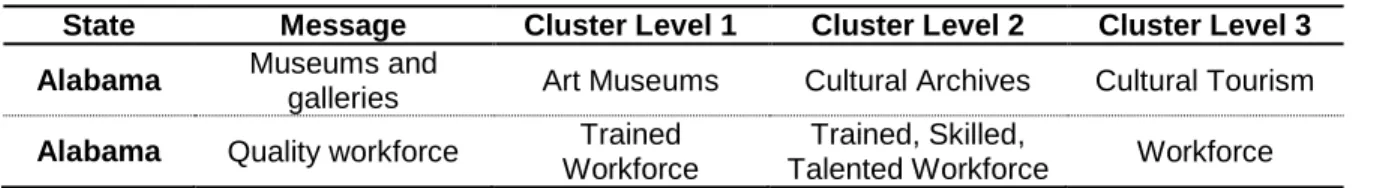
There are four main clusters for tourism: (1) Cultural Tourism, (2) Holiday, Leisure and Recreation Tourism, (3) Nature and (4) Sport. In terms of trade, the key clusters are (1) Sectorial Expertise, (2) Economic Characteristics, (3) Workforce and (4) General Country's Characteristics. Inside each one there are sublevels (namely levels 1 and 2). Two examples, one for tourism and another for trade, are illustrated in Table 1.
Table 1: Examples of Alabama clustering process
State Message Cluster Level 1 Cluster Level 2 Cluster Level 3
Alabama Museums and
galleries Art Museums Cultural Archives Cultural Tourism
Alabama Quality workforce Trained
Workforce
Trained, Skilled,
4
Alabama promotes museums and galleries in its TBO website in order to attract tourists. This message is associated to the Art Museums cluster (level 1), which belongs to Cultural Archives (level 2) which consequently belong to the main cluster of Cultural Tourism (level 3). On the other hand, in terms of trade Alabama promotes quality workforce. This message belongs to the trained workforce cluster 1, which is associated to Trained, Skilled, Talented Workforce (cluster level 2) and consequently Workforce (cluster level 3). Annex 1 presents the entire clustering process for Alabama in terms of tourism as an example.
The description presented before only reflects the supply perspective. In order to study the demand (tourists or investors) it is performed a study using Google Analytics which will be explained later in section 3.
During the internship it was possible to join both the tourism and trade US projects. The main tasks relied on collecting messages from the official websites, categorize each message using the predefined clusters, search for hard data and performing Google Analytics. The empirical part of this work details on the analysis undertaken to rank US states, based on the approach used by Bloom Consulting and on an alternative approach proposed in this manuscript. Therefore in the remaining of this section we will mainly detail on the tasks performed for the two other projects (India Tourism rating and Fashion City Brasil).
2.2.2. India Tourism Ranking Project
The project carried out with India is about positioning the 35 Indian regions only in terms of tourism. In fact, there are 28 states and 7 union territories, but here they are referred as regions. It is called the India State Brand Ranking and Bloom Consulting is currently developing it. This is an internal project as well.
Most of the activities performed during the internship, as far as this project is concerned, are related to the collection of soft data. Such as the US project, Bloom Consulting analyses the communication strategies launched by each Indian TBO
5
and verify if they match with what tourists are looking for. The methodology is exactly the same as the one used in the US states project. However, in this case the clusters are not the same. As it can be perceived, the messages used by Indian regions to promote their tourism are occasionally different from the US. Therefore, it was developed a new list of clusters adapted to Indian tourism. An example of this difference is the religious heritage such as Buddhism, Hindu and Islamic religions which have a huge impact on Indian tourism. Other cases are for instance meditation, yoga and Bollywood tourism. After collecting, gathering and categorizing the messages, demand behaviour is analysed using Google Analytics. Finally, the two sides are compared and it is verified if they match.
As an intern it was possible to participate on the creation of the new data base of clusters, contributing with ideas and suggestions in several brainstorming meetings. Some of the performed activities include the selection of the promotion messages on TBOs‟ website and the use of Google Analytics tool. Besides the collection of data to create the state brand strategy variable, the internship has also involved searching and gathering hard data for the other variables (which will be introduced in section 3), such as tourism receipts, international and national tourist arrivals per region for the last five years.
The final report produced by Bloom Consulting includes the ranking of the 35 Indian regions and also their rating position. At this point, it is important to clarify the difference between a ranking and a rating. In fact, a ranking consists of an ordered list of entities based on a quantitative metric, while a rating is a qualitative classification of that entity. In this case, the rank of an Indian region reflects an aggregate of all variables applied by Bloom Consulting. Nevertheless, the rating focuses on one single variable - the rating or the state brand strategy variable. Thereby, besides the rank in the final report it is also possible to consult the performance of the communication strategies of regions.
6
2.2.3. Fashion City Brasil Project
Fashion City Brasil (FCTY) is a marketing and brand positioning external project aiming to create a wholesale shopping in Belo Horizonte, Brazil. Apart from shopping, the vision is to make this project a role model for society. It should be sustainable in social, economic and environmental terms. “After analysing all the variables, Bloom Consulting understood that Fashion City Brasil was about to become a destination, meaning, a place where visitors would come from all over the country and as a consequence bring both good things to the region, such as business activity and opportunities”. (Bloom Consulting, 2013)
Fashion City project (FCTY) was divided into three phases: Research, Strategy and lastly Programs and Activities.
The first phase is about Bloom Consulting Research methodology. At this stage, Bloom Consulting identified nine main criteria necessary for FCTY to become a destination: „To be safe and politically stable‟, „To have good infrastructure‟, „To be accessible by good transportation‟, „To offer quality services‟, „To be known‟, „To be perceived for something‟, „To align perceptions with reality‟, „To be loved‟ and „To offer a unique experience‟. Bloom Consulting studied each criterion using stakeholder interviews, industry expert interviews, desk research and online surveys. FCTY ranked positively in four of the nine main criteria. Therefore Bloom Consulting proposed some recommendations for each negatively ranked criterion. The Strategy phase encompasses the definition of FCTY‟s brand strategy, target market, brand identity and economic impact. Bloom Consulting identified „inspiring‟ as the main idea of FCTY. Therefore, all involved parties should feel inspired and admire everything that happens in this wholesale shopping. Consequently, all activities, products and marketing campaigns should be inspiring too. Bloom Consulting defined three requirements crucial to transform a place, object or person into something inspiring: „To be the first or unique‟, „To be new or different‟ and/or „To be a reference or a leader‟.
7
Regarding target market, FCTY´s tourism strategy aims to attract not only more retailers but also other target markets such as the MICE (Meetings, Investment, Conferences and Exhibitions) tourism and local Belo Horizonte community. Bloom Consulting was also responsible for defining the brand identity. Again, all the creativity outputs are aligned with FCTY‟s central idea of inspiration, from the logotype to the advertising campaign. The economic impact of Fashion City project on local GDP was also analyzed. The expected economic output of FCTY will represent 0,88% of the gross domestic product (GDP) of the Metropolitan Region of Belo Horizonte and 1,99% of the GDP of Belo Horizonte.
The last phase represents the Activities necessary to activate the brand idea. This includes an activity map, the activities in detail and the chronogram required to execute the programs. Instead of departments, FCTY will have „Secretarias‟ of (1) Inspiration, (2) External Relations, (3) Intern Relations, (4) Sustainability, Education, Culture, (5) Tourism and Logistics and (6) Economy, Finance and Justice. „Secretarias‟ should be represented by one person who may or may not have a team of people working for them according to the workload. Moreover each „Secretaria‟ may have outsourcing needs. These needs were marked by Bloom Consulting in the chronogram.
As an intern it was possible to join the last two phases of FCTY project. The main tasks involved the elaboration of the final reports of phases II and III, as well as the presentations to the client. During the internship, it was also possible to participate in brainstorming meetings regarding the elaboration of the activity map, proposing new inspiring programs and activities which FCTY could apply, as well as suggesting the FCTY‟s chronogram.
8
3. Methodologies for ranking nations or regions
This section describes the methodologies used to construct composite indicators, including the Data Envelopment Analysis (DEA) approach and Bloom Consulting method.
3.1. Characterization of composite indicators
According to OECD (2008) composite indicators are useful in comparing countries, regions, states or cities performances, facilitating policy analysis and public communication. As a general definition an indicator is a quantitative or qualitative measure derived from observed facts. Indicators are helpful in identifying trends, monitoring performance and benchmarking. “A composite indicator is formed when individual indicators are compiled into a single index on the basis of an underlying model” (OECD, 2008, pp. 13).
Using composite indicators involves some pros and cons as mentioned by OECD (2008). As strengths OECD mentions the ability of summarise complex reality, helping decision-makers and facilitating communication with general public, the ease of interpretation, the ability of assessing countries‟ progress over time and the capacity of not losing the underlying information base. On the other hand, applying composite indicators may lead to misinterpreted policy messages, may conduct to simplistic conclusions and may be misused if the construction process is not transparent. The selection of variables, indicators and weights is also subjective and may not be understood or some variables may be ignored.
OECD (2008) presented several steps to be followed when building a composite indicator. The first step relies on developing a theoretical framework since it provides the basis for selecting indicators, which constitutes the step number two. The variables should be relevant, measurable and easy to access. Then, imputation of missing values is needed. This problem can be solved using means or removing the variables with missing data, for instance. Thereafter, a multivariate analysis is necessary in order to study and assess the overall structure of the
9
dataset. This step is followed by the normalisation process, where indicators are normalised in terms of measurement units with the purpose of becoming more comparable between them. The sixth step relies on aggregating and weighting the indicators according to the lines of the underlying theoretical framework. There are different weighting and aggregation methods that will be discussed further on this manuscript. The next step consists in assessing the robustness and sensitivity of the composite indicator, in order to check if some indicators should be added or excluded, if the treatment of missing data was adequate and if the selection of weights was the most appropriate. At the end, it is important to guarantee that the composite indicator is transparent, to check correlation and causality, to correlate the composite indicator with others and to decide about the way the indicator should be presented and visualised.
Some of these steps need subjective judgement such as the selection of variables, the weights for each indicator, the treatment of missing values and the choice of the aggregation model (Cherchye, et al., 2008). Thus it is important to identify the sources of the subjective assessment and potential data errors and use sensitivity analysis and uncertainty during the construction of the composite indicator.
3.2. Data Envelopment Analysis (DEA) approach
OECD (2008) presents several methods for weighting indicators such as Data Envelopment Analysis (DEA), Benefit of the Doubt Approach (BOD), Unobserved Components Model (UCM), Budget Allocation Process (BAP), Public Opinion, Analytic Hierarchy Process (AHP), among others. In this study we will only address the first two methods.
First introduced by Charnes el al. (1978), DEA is a linear programming technique used to compare the efficiency of a relatively homogeneous set of organizational Decision Making Units (DMUs). This tool derives a single summary measure of efficiency for each unit, which is a result of the comparison of each unit with other
10
units in the sample. DEA identifies the efficient units, estimating an efficiency frontier which contains the examples of best practices (i.e. 100% efficient) which are used as benchmarks (also named peers). It detects inefficient units as well, where the distance to the frontier constructed from the benchmarks constitutes the magnitude of their inefficiency (Morais and Camanho, 2010). As mentioned by Storrie and Bjurek (2000), the main advantage of benchmarking relies on the observation of the real world. This means that the best performance is not theoretical or abstract but it is defined by observing the best performer(s).
DEA looks for endogenous weights which “maximize the overall score for each decision-making unit (DMU) given a set of other observations” (Cherchye et al., 2008, pp. 239). Model (1) presents the DEA linear programming model, where yrj
corresponds to the value of the output r of DMU j, and 𝑥ij to the value of the input i of DMU j. The DMU being evaluated is DMU o. (r=1, ..., s)represents the weight attributed to output r and (i=1, ...m)the weight assigned to input i. The composite indicator is scored between 0 efficiency (the worst scenario) and 1 or 100% efficiency (the best scenario). A unit can reach the best score following the best practices observed in peer units (i.e. the units considered good performers when evaluated with the weights of the unit under assessment).
Max h0 = ∑ ∑ S. to: ∑∑ j=1, …, n, (1) ; r=1, …, s; i=1, …, m.
The DEA model can be input or output oriented. According to Cooper et al. (2000), an input oriented model aims to reduce the input amounts as much as possible while keeping at least the present output levels. On the other hand, an output oriented model maximizes output levels under at most the present input consumption. DEA methodology also allows the use of Constant Returns to Scale (CRS) or Variable Returns to Scale (VRS). The first one is based on the
11
assumption that CRS predominates at the efficient frontier. As the name suggests, VRS relies on allowing for increasing, decreasing or constant returns to scale (Cooper et al., 2000).
An example of an application of the DEA methodology is a study performed by Morais and Camanho (2010) where 206 European cities, belonging to 25 countries, are evaluated regarding the ability of local authorities to promote urban quality life. In this case, Gross Domestic Product (GDP) per capita is considered an input in the DEA model and nine dimensions as outputs (demography, social aspects, economic aspects, civic involvement, training and education, environment, transport and travel, culture and leisure, innovation and technology). Besides measuring the relative efficiency of the DMUs, DEA is also useful on the construction of composite indicators in terms of defining weights for the indicators to aggregate. This methodology is called Benefit of the Doubt (BOD). Despite the fact of using DEA techniques, it compares all the DMUs only based on outputs. This is equivalent to consider that all DMUs have the same input levels. Therefore, the inputs are represented by a single “dummy” input equal to one in the DEA formulation (Morais and Camanho, 2010). Unlike the traditional DEA efficiency analysis, the BOD approach only considers the achievements, without taking into account the resources used.
Thus, the new linear programming model (2) selects the weights (ur) that maximize
the performance/scores for the DMU (j) under consideration and where yrj
corresponds to the value of the output indicator r. If a DMU scores less than 100% of efficiency using this procedure, it means that the remaining units perform better even when all weights are chosen to maximise its efficiency level.
Max h0 = ∑
S. to: ∑ j=1, …, n, (2)
12
This method is very popular in constructing countries, regions and cities‟ rankings. For instance, Morais and Camanho (2010) applied this methodology to evaluate the performance of 206 European cities, regarding urban quality of life in order to measure the performance of each one (level of urban quality life) and to create a cities‟ ranking. For this purpose, the authors used the nine dimensions previously presented (demography, social aspects, economic aspects, civic involvement, training and education, environment, transport and travel, culture and leisure, innovation and technology), excluding GDP per capita (the input) from this analysis. Another example is the evaluation of 23 countries regarding the Technology Achievement Index by Cherchye et al. (2008). This index was firstly introduced by the United Nations in 2001. The goal is to analyse the ability of a country to create and diffuse new or existent technologies and to provide qualified human resources for technology creation, using this methodology.
As mentioned before, DEA makes use of optimization procedures that emphasize the countries, regions and cities‟ strengths, allowing them to attach higher weights to those dimensions in which they preform relatively well (Cherchye et al., 2004). Nevertheless, this fact could lead to wrong interpretations since some attributed weights (to an indicator of a certain city or country) could be ignored and in reality that indicator can be imperative in the study. On the other hand, if the number of outputs is too high when compared with the amount of DMUs, this can lead to a situation where many DMUs can reach 100% of efficiency but with no space for discrimination between good and bad performances. In order to overcome this limitation, Wong and Beasley (1990) applied additional restrictions to weights. They introduced for the first time the concept of virtual weight restrictions (WR), i.e. restrictions on the variable value multiplied by the respective weight. Imposing constraints reduces the flexibility of DMUs in choosing their value system. These restrictions, shown in (3), limit the importance attributed to indicator r, for the DMU (j) under consideration, where yrj corresponds to the value of the output indicator
and ur to the weight.
13
The addition of restrictions in the DEA model deteriorates the efficiency scores, since DMUs do not have the same flexibility weighting their variables. An example is specifying a minimum weight for each dimension in order to avoid indicators of being ignored, as Morais and Camanho (2010) did, imposing a minimum of 1.5% for all indicators‟ weight to evaluate the urban quality of life of 206 cities. When Cherchye et al. (2004) evaluated 15 EU countries for social inclusion, they also restricted the weights for the four established dimensions (the low income rate, the income quintile ratio, the long-term unemployment rate and early school leavers) giving a minimum of 10% and a maximum of 50% to each one.
In fact, there are various types of weight restrictions. According to Thanassoulis et al. (2008), besides restricting virtual weights, there are constraints such as the absolute weight restrictions, the assurance regions of type I (involving relative weight restrictions) and assurance regions of type II (regarding input/output weight restrictions).
3.3. Bloom Consulting approach
In terms of aggregation methods, OECD (2008) has also introduced several methods such as the Additive Aggregation Methods, the Geometric Aggregation, the Multi-criteria Decision Analysis and the Non-compensatory Multi-criteria Approach (MCA). Bloom Consulting method to build a composite indicator is somehow close to the first one.
Bloom Consulting is one of the global specialists in country branding. Every year, they launch the Bloom Consulting Country Brand Ranking for tourism and trade, using new and different dimensions from their competitors. These full reports are free of charge. Bloom Consulting works with several governments of countries and regions. However, additionally they also collaborate with private companies (such as IKEA and McDonalds) developing strategies of internationalisation, positioning and innovation, for instance.
14
In its perspective, Bloom Consulting uses a 3T Approach: T1 – Attraction of Trade
T2 – Attraction of Tourism T3 – Attraction of Talent
According to Bloom Consulting perspective, these three concepts are completely antagonistic and they automatically repeal each other. Therefore, countries need to treat each dimension individually. They cannot adopt the same arguments to promote tourism and trade (Bloom Consulting, 2011a). For instance, we can mention gastronomy and relaxation to promote tourism, whereas the most valuable messages for Foreign Direct Investment (FDI) are available workforce, innovation and legal framework characteristics. Moreover, the 3T Approach has also different audiences. For example, the relationship between a nation and tourists is called Business to Consumer (B2C) and the relationship between a nation and investors is called Business to Business (B2B).
Bloom Consulting analyses annually 161 countries regarding their communication and branding strategies and the impact that this communication has on their economy. Despite the fact of distinguishing three different targets (trade, tourism and talent), Bloom Consulting only develops rankings for trade and tourism. In order to do so, the Consultancy analyses some of the country‟s hard data and its official Investment Promotion Agencies (IPAs) in the case of trade, and the official Tourism Board Organizations (TBOs) for tourism. According to the top 10 in 2012, the US leads the ranking for tourism followed by Spain and France (Bloom Consulting 2012a, pp. 7). In terms of trade, the scenario is the same for the first position, but now Luxembourg and China occupy the second and third places (Bloom Consulting 2012b, pp. 7).
In the published report, besides the ranking it is also possible to find a rating classification (one of the variables considered by the Consultancy in their final ranking, to which special attention is devoted), as mentioned in section 2.2.2. “This rating reflects the effective use of different countries‟ communication strategies”
15
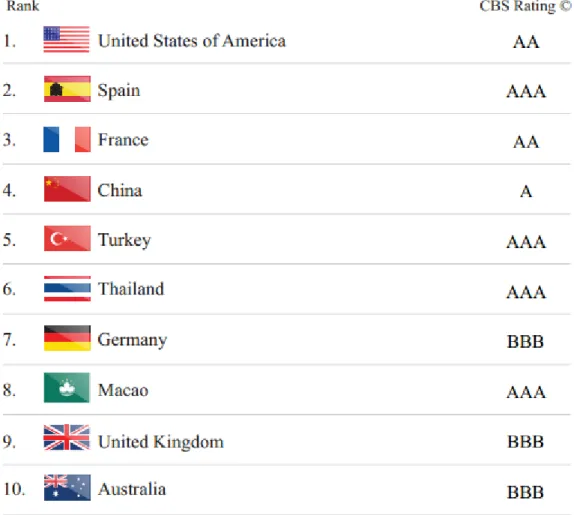
(Bloom Consulting, 2011b, pp. 11), also elaborated for both tourism and trade. The reader will understand if a country is communicating the best messages in order to increase its FDI or tourism receipts (depending if it is trade or tourism). If a country is not using the most effective communication strategy, it does not mean necessarily that it attracts less investment or tourists. In 2012 Tourism Edition, China is an example. Despite the fact that China has received a poorer rating than Macao (where AAA is the best score and A is the third best level), China is able to attract more tourists since its rank position is 4th and Macao is number 8, as illustrated in Figure 1. This means that China TBO is not using the best messages to promote the country, but even so it is able to attract more tourists than countries with more efficient communication strategies as Macao.
Figure 1: Top 10 of Bloom Consulting Country Brand Ranking Tourism Edition 2012 (Source: Bloom Consulting, 2012a, pp. 7)
16
The methodology used by Bloom Consulting to build the trade and tourism rankings is similar. However, the variables considered and their importance have some differences. For instance, in the case of trade the ranking takes into account the values of FDI, instead of tourism receipts. Tourism receipts have more influence in the final tourism score than the FDI in the trade ranking results. The two rankings have three dimensions in common, however for trade it is also considered an additional variable which is job creation. Since this report will detail on tourism ranking, the remaining of this manuscript will detail the methodology and variables applied by Bloom Consulting in order to build tourism rankings.
Bloom Consulting considers five dimensions in order to build the country brand ranking for tourism:
Economic Performance – the value of country‟s tourism receipts for the last five years;
Economic Growth – economic growth rate of tourism receipts for the last five years. For this purpose, it is applied a Compound Annual Growth Rate (CAGR) as represented in formula (4) where V represents the value and n the number of years. nyears 1 V Beggining V Ending CAGR -1 (4)
Social Media Performance – the number of followers on Twitter social network and the number of likes on Facebook social network. Each indicator has an impact of 50% on the social media performance;
Online Performance or Web Analytics – page views (estimated percentage of global page views on the website), page viewers per user (estimated daily unique page views per user for the website), reach (estimated percentage of global internet users who visit the website) and bounce rate (estimated percentage of
17
visits to the website that consist of a single page view) of the TBO‟s website of the last three months. Each indicator weights 25% on the online performance variable; Rating or Country/State Brand Strategy – effectiveness of the communication strategies and messages used by the official TBO.
As discussed before, the rating is the most complex variable that requires more time to be calculated. It consists in collecting the messages promoted by the official TBO and finding out if these messages meet people‟s online search. Bloom Consulting compares the supply (TBOs) with the demand (tourists) and sees if they meet each other.
Thus, from the demand perspective, Bloom Consulting uses Google Analytics in order to study the online search demand. In other words, the purpose of using Google Analytics relies on finding out the Google‟s search of keywords, i.e. words and expressions that people use in Google when they are searching for a region‟s tourism. On the other hand, from the supply angle, Bloom Consulting analyses each TBO‟s website and collects every message that they promote. Thereafter, the messages are classified, i.e. each message or keyword is categorised and associated to a certain cluster, as explained in section 2.2.1. Later, Bloom Consulting compares and computes the difference between supply and demand, i.e. the actual number of communicated messages and the number of messages in Google universe.
The more accurate a country is (there is no gap between supply and demand) the better the rating. The rating scores from AAA (very strong) until D (poor) (Bloom Consulting, 2012a, pp. 6). Moreover, as illustrated in Table 2, if the rating is between 7 and 5,5 it has a AAA scale, between 5,5 and 5 is AA, between 5 and 4,5 is A and in every 0,5 falls down to the level below, until the lowest level D which goes from 1,5 to 0.
18
Table 2: Rating scale classification
Rating scale Minimum range Maximum range
AAA 5.50 7.00 AA 5.00 5.50 A 4.50 5.00 BBB 4.00 4.50 BB 3.50 4.00 B 3.00 3.50 CCC 2.50 3.00 CC 2.00 2.50 C 1.50 2.00 D 0.00 1.50
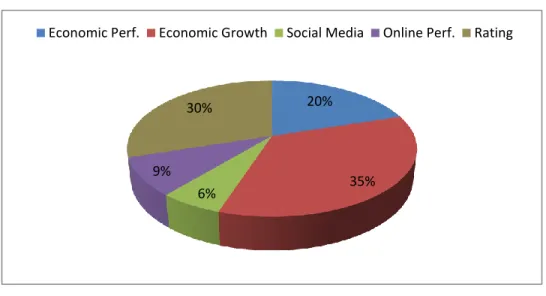
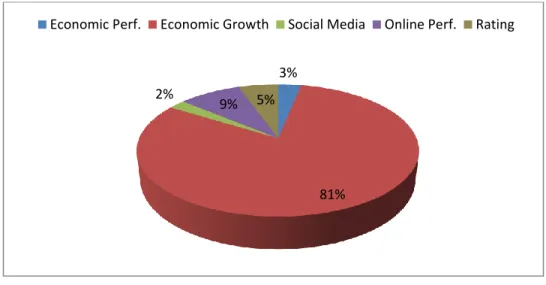
The five dimensions (from economic performance to rating) have different weights in the final score of Bloom Consulting ranking. The economic performance represents 55% of the final score, the rating influences 20%, the social media and the online performance weight 10% each and finally the economic growth represents 5%.
After gathering all data, the values used by Bloom Consulting are normalised in order to become comparable between them. All variables are normalised through a relative normalisation process. However, the economic performance and economic growth dimensions are geometrically normalised through a relative and an absolute normalisation process.
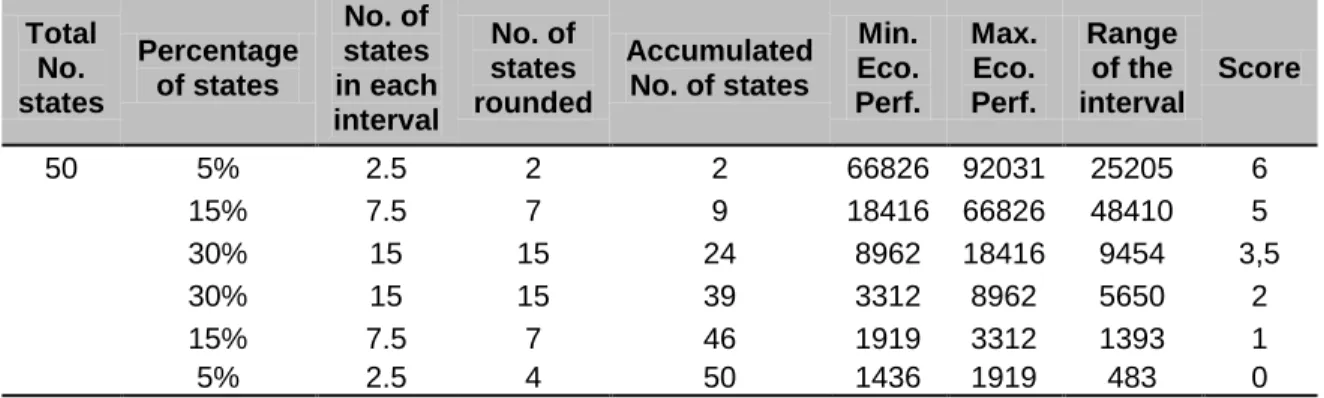
In terms of relative normalisation, Bloom Consulting considers the actual value (the number of followers on Twitter, for instance) or the average data (in the case of the economic performance and economic growth) of each country or region for the period being analysed. Consider as an example a study of the economic performance variable for the 50 US states. The value of this variable is the average value of the last five years for each state. Then, the relative normalisation distributes the 50 values of this variable into six predefined percentile intervals, as represented in Table 3 in the second column. Bloom Consulting distinguishes six percentiles, which are the best 5%, 15% and 30% states (the highest values), and the worst 30%, 15% and 5%.
19
Table 3: Relative normalisation process of the economic performance variable for the 50 US states Total No. states Percentage of states No. of states in each interval No. of states rounded Accumulated No. of states Min. Eco. Perf. Max. Eco. Perf. Range of the interval Score 50 5% 2.5 2 2 66826 92031 25205 6 15% 7.5 7 9 18416 66826 48410 5 30% 15 15 24 8962 18416 9454 3,5 30% 15 15 39 3312 8962 5650 2 15% 7.5 7 46 1919 3312 1393 1 5% 2.5 4 50 1436 1919 483 0
In order to calculate the minimum and maximum values of each interval, Bloom Consulting follows the logic illustrated in Table 3. That is, Bloom Consulting calculates the number of states in each interval, i.e. how many states are for instance in the best 5%. Since there is a total of 50 states, only two states belong to this category (5% of 50). Thereafter, the minimum value of each interval is calculated. In the case of the best 5% it is selected the minimum value of the two states. Regarding the maximum level for this percentile it is selected the maximum economic performance value of all 50 states. Concerning the other intervals, the maximum corresponds to the minimum of the prior interval, as represented in Table 3.
Thereafter, Bloom Consulting associates the value of the economic performance of a certain state with the correspondent score (from 0 to 6 – see last column in Table 3 where the score that corresponds to each percentile is shown), depending on its position throughout the intervals. For example to California with an economic performance of 92031 a value of 6 is assigned. To Connecticut with a value of economic performance of 8681 a value of 2 is associated. As these values do not discriminate between some states, Bloom Consulting further computes the distance of each value to the minimum of the interval using equation (5). That is, if the value is close to the minimum it receives an additional score around zero, and close to 1 if it is close to the maximum.
20
(5)
Therefore California receives an additional score of one 1 since it is actually the maximum of the interval (is the best state in terms of economic performance) and Connecticut obtains a score of 0.95 because it is very close to the maximum. Thereby, California and Connecticut obtain a final score equal to 7 and 2.95 respectively.
The absolute normalisation is only applied to economic performance and economic growth since these variables include values for a period of five years. This process follows exactly the same procedure. However, the absolute score considers in the definition of the range in each percentile, the maximum and the minimum of the observed values during the five years, i.e. 250 values, instead of the maximum and minimum of the average numbers. Hence, the geometric mean between relative and absolute values (6) provides the final score for these two variables.
(6)
In the end Bloom Consulting ranks each state according to their performance on this relative or geometric mean of relative and absolute rankings, and uses the rank values of the variables to aggregate them and construct its ranking.
Besides the annual world ranking, Bloom Consulting also elaborates rankings for regions and states. An example is the US State Brand Ranking for tourism and trade launched for the first time in 2012, where the same dimensions and methodology are applied in order to construct the ranking. Another example is the Indian Regions Ranking for tourism expected to be released in 2013.
Range Minimum Value Observed Score Absolute * Score Relative Score Final
21
4. Country Branding – concepts and previous studies
According to Porter (1990) leaving in a world of global increasingly competition, the role of the nation has grown. Countries try to create and sustain their competitive advantage in order to differentiate themselves in some way. Porter (1990) mentioned several sources of national competitiveness. Some authors identify this national competitiveness as a macroeconomic effect related to exchange rates, interest rates and government deficits. It is also associated to government intervention such as protection, imports promotion and subsidies. Others classify national competitiveness as a result of cheap and abundant labour, or related to management labour practices. Some authors also associate it to natural resources. After setting the nation‟s competitive advantage, the next step relies on promoting itself, i.e. applying country branding strategies.
A brand is a name with power which influences buyers (Kapferer, 2004). In country branding country names constitute brands, evoking certain meanings and associations about that place (Akotia, et al. 2011). According to Anholt (2003) country branding is used to promote a country‟s identity to gain a competitive edge. This identity is projected for internationally recognition to improve the country‟s image.
According to Kotler and Gertner (2002) a country‟s image affects its ability to attract investment, businesses, tourism and the perception people have regarding its products and services.
There are countries who manage consciously their name as a brand. Kotler and Gertner (2002) refer Colombia as an example. Colombia used its high-quality coffee to promote itself as a country. People associate a country, a city or a place to certain beliefs, impressions and images, even when this is not done intentionally. In fact, most country images are stereotypes and extreme simplifications of reality, based on people‟s perceptions and expectations. The media and the entertainment industry have a huge impact in shaping people‟s perceptions of places. On the other hand, sometimes a positive perception of a
22
country is created but this does not happen intentionally. For example, the key technology cluster in India led by Wipro and Infosys is modernizing the image of the country, as innovative, entrepreneurial and talented (Akotia, et al. 2011). Another example is New Zealand that became a very popular touristic destination thanks to the release of Lord of the Rings‟ movie (Croy, 2004).
Kotler and Gertner (2002) have also mentioned that a country name has an impact on attitudes toward products. Many consumers use country-of-origin label as an indicator of quality of products and services. For instance, products made in China have a negative connexion in terms of quality among many consumers.
According to Olins (2002) country branding seems to offer the most to unpopular countries that need to improve their reputation and image. This happens for instance with West African countries which are negatively perceived because of political instability, poverty, disease and corruption that they have been through. Anyway, under Kotler and Gertner (2002)„s point of view all nations must manage and control their branding. Nations need to strive and find its competitive advantage among the intense market competition between countries. Today this is mandatory for nations‟ survival. Thus these authors suggest three different tasks which countries must deal with: managing the image, attracting tourists and attracting companies and factories. More specifically, countries should carry out a SWOT analysis in order to determinate their own strengths (S), weaknesses (W), opportunities (O) and threats (T). The country then should define a basis for strong branding and storytelling, choosing certain industries, personalities, historical landmarks and events and natural features which nations want to promote.
4.1. Review of previous studies on countries and regions rankings
In what follows our aim is to provide an overview of previous academic studies and existing methodologies used by specialists to develop countries, regions and cities rankings. Besides academic studies, it includes the perspective and methodologies
23
used by two other main players in the Country Branding‟s field: Future Brand and Anholt Gfk.
4.1.1 Existing nations or regions brand rankings build by consulting firms Future Brand
As well as Bloom Consulting, Future Brand is an expert in the field of country branding. This company provides an annual study of country brands named Country Brand Index.
Future Brand develops different types of rankings. In the general top 25, they rank the best 25 countries in the world regarding seven main variables (Country Brand Index 2012-13, pp. 6):
Awareness – Do key audiences know that the country exists? How top-of-mind is it?
Familiarity – How well do people know the country and its offerings?
Associations – What qualities come to mind when people think of the country? Preference – How highly do audiences esteem the country? Does it resonate? Consideration – Is the country considered for a visit? What about for investment or to acquire or consume its products?
Decision/visitation – To what extent do people follow through and visit the country or establish a commercial relationship?
Advocacy – Do visitors recommend the country to family, friends and colleagues? In every annual report, Future Brand presents a brand ranking of all 118 studied countries, concerning these seven main variables and a comparison with the results of the two previous years. In 2012-13 Edition Switzerland occupies the first position, after being in the second place in 2011-12. Switzerland, Canada and Japan are the top 3 for 2012-13. Afghanistan and Pakistan are in the last two positions of 2012-13 ranking (Country Brand Index 2012-13).
24
Besides that, Future Brand also ranks the 25 best countries taking into consideration only one of the seven main variables - associations. They identify five sub dimensions for this variable (Country Brand Index 2012-13, pp. 70):
Value System – Political Freedom, Environmental Friendliness, Stable Legal Environment, Tolerance, Freedom of Speech;
Quality of Life – Education System, Healthcare System, Standard of Living, Safety, Job Opportunity, Most Like to Live In;
Good for Business – Investment Climate, Advanced Technology, Regulatory Environment, Skilled Workforce;
Heritage and Culture – History, Art and Culture, Authenticity, Natural Beauty; Tourism – Value for Money, Attractions, Resort and Lodging Options, Food.
Thus, Future Brand constructs the top 25 best countries for each sub dimension: (1) value system, (2) quality of life, (3) good for business, (4) heritage and culture and (5) tourism. Additionally, it also develops the top 15 best countries for each indicator inside the sub dimensions (a ranking for (1) political freedom, (2) environmental friendliness, (3) stable legal environment, (4) tolerance and (5) freedom of speech, for instance).
In terms of methodology, Future Brand collects quantitative data from 3,600 opinion-formers and frequent international business or leisure travellers. They use Future Brand‟s proprietary Hierarchical Decision Model (HDM) to determine how residents, investors, tourists and foreign governments perceive a country‟s brand. Through HDM Future Brand can also measure the performance and progress of a country over time. This model takes into consideration the seven main variables discussed previously (Awareness, Familiarity, Associations, Preference, Consideration, Decision/visitation and Advocacy) (Country Brand Index 2012-13, pp. 5).
Besides HDM, Future Brand also counts with some global experts who provide their opinion in areas such as policy and governance, international relations, economics and trade, international law, national security, energy and climate
25
change, urban and regional planning, immigration and the media (Country Brand Index 2012-13, pp. 5).
Anholt–Gfk
Every year Anholt-Gfk launches a top 50 nation brand ranking measuring the power and quality of each country‟s image. This report is called Anholt-GfK Roper Nation Brands IndexSM or NBI. The NBI represents a “unique collaboration combining the heritage and authority of GfK Roper's three-quarters of a century of experience in public affairs research with the expertise of Simon Anholt to offer a unique barometer of global opinion.” (Anholt-GfK, 2009, pp. 2). Their main clients include government ministries, public-private sector partnerships, foundations and cultural institutions, media and communication agencies around the world. The full reports are available for purchase.
The methodology relies on interviewing approximately 21,000 adults (age 18 or over) from twenty core panel countries. This panel encompasses developed and developing countries which play important and diverse roles in international relations, trade and the flow of business, cultural and tourism activities. In the 2012 NBI survey 20,378 online interviews have been conducted (Anholt-GfK, 2012). In their research Anholt-Gfk uses six different variables in order to measure the power of each country‟s brand image (Anholt-GfK, 2009, pp. 2). According to Anholt (2005), these dimensions can be seen as a hexagon known as the Nation Brand Hexagon, represented in Figure 2.
Tourism Exports
Governance People Nation Brand
Immigration and Investment Culture
26
The six hexagon‟s points represent the variables considered in the analysis, i.e. the different aspects of the intellectual property patrimony of a nation. All these dimensions together build up the idea of a nation. Being part of the intellectual property, the points of the hexagon need to be properly managed and developed (Anholt, 2005). These variables are described below:
Exports – the country-of-origin effect, i.e. whether knowing where the product is made influences people‟s decision of purchasing it. It is also considered whether a country has particular strengths in science, technology and creative energy;
Governance – competency and honesty of government, respect for citizens‟ rights and fair treatment, security, international peace, environmental protection and world poverty reduction;
Culture – cultural country‟s heritage such as traditions, music, films, art, literature and sports;
People – people‟s friendliness and human resources on a professional level; Tourism – natural beauty, historic buildings and monuments, vibrant city life and urban attractions;
Immigration and Investment – a country‟s power to attract talent and capital. The NBI score is an average of the scores from the six variables mentioned before. For each dimension there are between three and five ratings questions (from the survey). Ratings are based on a scale from 1 (the lowest and worst) to 7 (the highest and best), with 4 being the middle position which is neither positive nor negative. “Each hexagon point also has a word choice question which helps enrich the understanding of the properties of a nation‟s image”. (Anholt-GfK, 2011, pp. 5) Anholt-Gfk also ranks the countries for each dimension separately. For illustration, Japan leads the ranking regarding Exports dimension, followed by the US and Germany. On the other hand, in terms of Governance, China is the 49th on the ranking and Canada and Switzerland are in the top of this list (Anholt-GfK, 2009, pp. 8).
27
With regards to the global ranking, in 2012 the US holds number 1 position, holding the top spot for the fourth year in a row as the nation with the best overall reputation. It is followed by Germany, United Kingdom, France and Canada. In 2012 NBI, two-thirds of measured nations suffered declines in their reputation over the past year (Anholt-GfK, 2012).
4.1.2 Academic studies regarding nations or regions rankings
One can find in the academic literature several performance evaluations of countries, regions or cities based also on a set of indicators. This literature is not directly related to country branding, but the methodologies involved are comparable.
An example is a study performed by Morais and Camanho (2010) where they assessed 206 cities regarding quality of life. In order to construct a composite indicator of urban quality of life, the authors applied the Benefit of the Doubt Approach (BOD) method. The results show that only four cities scored 100% of efficiency in terms of quality life. The best cities belong to Germany and Netherlands and the worst are in Romania and Italy. The average score is 51%. Morais and Camanho (2010) also evaluated the ability of local authorities to promote urban quality life. Thus, using Data Envelopment Analysis (DEA), they compared the national conditions with quality of life levels. According to the results, Dresden (Germany) and Helsinki (Finland) are the most efficient, i.e. these cities are able to transform national wealth into quality of life.
As mentioned before, Cherchye et al. (2008) analysed the Technology Achievement Index of 23 countries using the same DEA methodology. Firstly introduced in 2001, Desai et al. (2002) specified eight indicators to evaluate this index: number of patents granted, receipts of royalties, number of internet hosts, exports of high and medium technology products, number of telephone lines, electricity, mean years of schooling and gross enrolment ratio of tertiary students in
28
science, mathematics and engineering. In this case, Finland, Sweden, Japan and the US lead the ranking. Additionally, in a previous study Cherchye et al. (2004) investigated 15 EU countries regarding social inclusion, as introduced previously in section 3. In order to evaluate the countries and construct the ranking, it was considered four variables (low income rate, the income quintile ratio, early school leavers and long-term unemployment) as outputs, in a BOD model. Sweden, Austria and the United Kingdom present the best performances in the ranking. Another example is a study performed byKaufmann et al. (2002) associated with the evaluation of 175 countries regarding six governance indicators (government effectiveness, political stability, voice and accountability, control of corruption, rule of law and regulatory quality). The authors applied a different model – Unobserved Components methodology – in order to construct updates of the governance indicators covering the period 2000-01 and compare them with the previous results of 1997/98. The new results show that in terms of government efficiency, for instance, Switzerland is in the top with the best performance, followed by Luxembourg. The same happens with political stability, for example, where Switzerland is again in the top of the list. However it has deteriorated its score comparing to the previous study.
Furthermore, Storrie and Bjurek (2000) created a composite index of the unemployment and employment rates of the EU member states in 1999 (15 countries) in order to study the labour market performance. The authors benchmark the European countries with efficiency frontier techniques, i.e. using the DEA methodology. Denmark, Netherlands and Luxembourg present the best scores.
Another example is the measurement of the efficiency of 191 countries by Tandon et al. (2000) in terms of health systems. The authors identified health, health inequality, responsiveness-level, responsiveness-distribution and fair-financing as the five indicators in the composite indicator. They used public opinion, conducting surveys to the population, in order to establish the weight percentages. According to the results, France leads the ranking and Sierra Leon is at the bottom.
29
5. Case study – using Bloom Consulting data to produce a
ranking for US states using a DEA methodology
This section describes the analysis of Bloom Consulting data in order to construct a composite indicator applying Data Envelopment Analysis (DEA) methodology. The goal of this study relies on building a new ranking of the 50 states of United States of America in terms of tourism branding. The ranking measures the effectiveness of brand strategies used by each state to attract tourism. Thereafter, the results will be compared with Bloom Consulting ranking and some suggestions for improvement will be proposed.
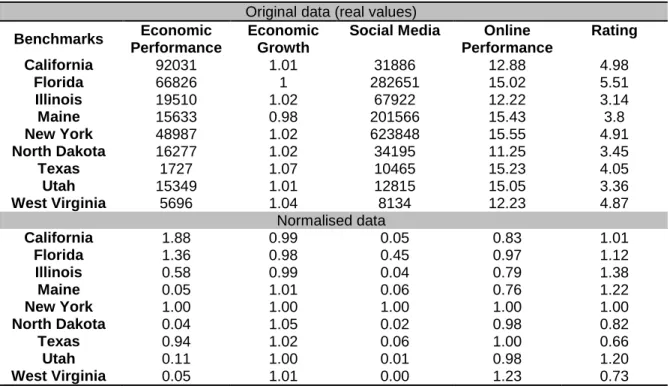
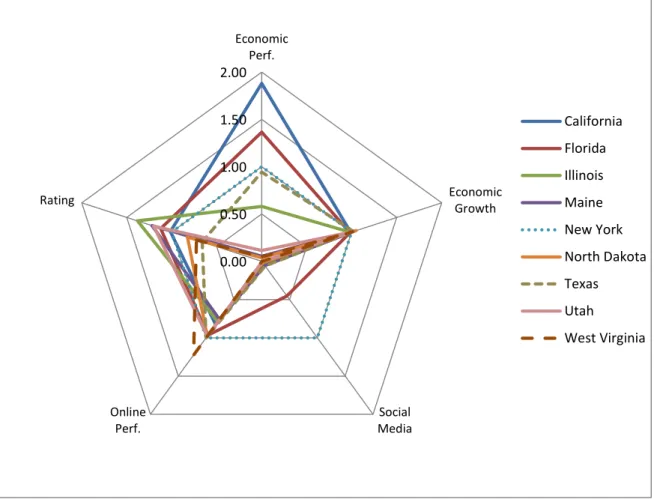
As previously said, DEA is a very rigorous method, applying linear programming techniques, that is able to compare the efficiency of several Decision Making Units (DMUs). For the matter of this study, there are 50 DMUs being analysed, representing the 50 US states. In terms of variables, it will be considered the same five dimensions used by Bloom Consulting – economic performance, economic growth, social media, online performance and rating. In terms of data, the analysis will be done considering Bloom Consulting data, using the real values collected for the study, but also the rank values, i.e. the numbers of order from 0 to 50 that are used in Bloom Consulting ranking.
Constructing a composite indicator implies comparing tourism branding of all states only based on outputs, as mentioned before. Thus, since all states have the same input levels, the inputs are represented as a single “dummy” input equal to one in the DEA formulation. Thus, the five variables are considered outputs in the DEA model. This is an example of a Benefit of the Doubt approach.
Nevertheless, regarding the analysis using the rank data, the value 1 represents the best score and 50 the worst (since the data represents a ranking, i.e. number of order). Therefore when rank data are used, the variables are considered inputs, since a small value corresponds to a better performance on that factor.
30
The advantage of using DEA is associated with the process of weighting the variables. Instead of attributing weights reflecting personal point of views, DEA calculates the best possible weights for each dimension in every scenario. In other words, DEA allows each state to select its own weighting system for the evaluation of performance, applying optimization techniques which emphasise the state‟s strengths.
In order to perform the analysis and to compute DEA efficiency measures, the software Integrated System for Decision Support (ISYDS) was used.This software allows the performance of models with different characteristics. For instance, it is possible to choose a model with constant or variable returns to scale, input or output oriented, with or without weight restrictions, the use of an inverted frontier, among many additional options, producing complete results (efficiency scores, weights, benchmarks, targets and slacks). The main advantage of using ISYDS relies on tackling virtual weight restrictions, condition that for instance Efficiency Measurement System (EMS) software is not able to calculate.
5.1. Evaluation of state efficiency in the promotion of tourism
As mentioned before, we performed two different analysis using Bloom Consulting data in order to evaluate the efficiency of all states in terms of tourism. The first one contemplates the rank values and the second analysis applies the real values for each variable.
5.1.1. DEA model based on rank values
For the analysis using rank values, an input oriented model with constant returns to scale was used, and results obtained through ISYDS.
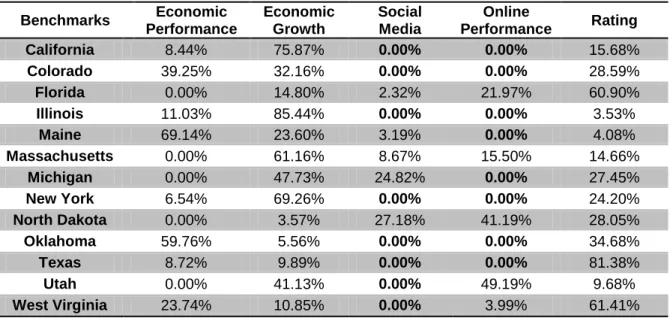
The results demonstrated in Annex 3.1. show that there are 13 best performing states: California, Colorado, Florida, Illinois, Main, Massachusetts, Michigan, New