i
Symptoms of anxiety and depression
in the Portuguese elderly
Rute Dinis de Sousa
Orientador de Dissertação: Professora Doutora Maria João Gouveia
Professor de Seminário de Dissertação: Professora Doutora Maria João Gouveia
Tese submetida como requisito parcial para obtenção do grau de: MESTRE EM PSICOLOGIA
Especialidade em Psicologia Clínica
ii
Dissertação de Mestrado realizada sob a orientação de Professora Doutora Maria João Gouveia, apresentada no ISPA – Instituto Universitário para obtenção de grau de Mestre na especialidade de Psicologia Clínica.
iii
Acknowledgements
À Professora Maria João Gouveia, por ter sido o mais feliz acaso. Com quem me senti sempre bem e que – sem passado – confiou, encorajou, ralhou. Soube ver-me e picar-me e integrar-me. Ensinar-me. Devolver-me a psicologia. Muito obrigada por ter sabido fazer disto aquilo que eu queria que fosse!
À Helena, por ser sempre mais que a Professora Doutora Helena Canhão, por ensinar sempre e ser sempre encorajadora, por achar que vale a pena, que é possível, e que está bem, por usar o seu tempo comigo e com aquilo que me importa. Por me inspirar.
À Sara, por responder com alegria aos emails que haviam de ser sempre “os últimos”, por nunca achar de mais, por ter tido a paciência para descobrir comigo. Por rir, para não chorar!
À Ana, que deu tudo o que pôde, mais do que devia, como sempre. E que me escreveu “nunca vais
estar sozinha” e eu sei que é verdade.
Ao Tiago, meu amor. Por tudo.
Ao Benjamim, por me deixar ser a sua mamã, mesmo nas ausências, mesmo com os olhos no computador. Por me encher de orgulho. Por ser a prova mais íntima que a vida é boa e eu sou capaz.
À mamã e à manovsky por fazerem de mim esta pessoinha. Muito obrigada. Sinceramente.
iv
Resumo
Introdução: O envelhecimento da população é uma tendência a longo prazo que começou há várias décadas em todo o mundo. A ansiedade e depressão nos idosos são consideradas problemas importantes das sociedades modernas.
Objetivos: Este estudo dedicou-se à análise da prevalência de ansiedade e depressão e dos seus factores relacionados, na população idosa portuguesa.
Método: Os dados derivam da coorte EpiDoC – o estudo EpiDoC 2. A coorte EpiDoC, representativa da população adulta portuguesa, é composta por 10.661 adultos. Este estudo incluiu os participantes da segunda avaliação de seguimento do estudo EpiDoC 2 com mais de 64 anos, que responderam ao Hospital Anxiety and Depression Scale (HADS), n = 1.680. Foram recolhidos dados sociodemográficos, estilos de vida, doenças crónicas auto-reportadas, qualidade de vida (EQ-5D-3D), funcionalidade (HAQ) e informação sobre o consumo de recursos em saúde. A ansiedade e depressão foram avaliadas através do HADS.
Resultados: A prevalência de ansiedade nos idosos é de 9,59% e 11,77% para depressão. A ansiedade e mais frequente em idosos com baixo nível de escolaridade e em mulheres. Neste trabalho verificámos que a pior qualidade de vida e incapacidade funcional se associam a ansiedade. Relativamente à depressão, verificámos que é mais frequente em idosos do sexo feminino, que vivam sozinhos, com baixo nível de escolaridade e baixo rendimento. Também a depressão se associou a pior capacidade funcional e qualidade de vida.
Conclusão: A ansiedade e depressão são frequentes nos idosos portugueses e associam-se a pior qualidade de vida e a incapacidade funcional independentemente de outras doenças crónicas. O nível de educação é diferenciador desta população em termos de ansiedade e depressão.
Palavras-chave
Idosos; Ansiedade e Depressão; Doenças crónicas não transmissíveis; Estilos de vida; Qualidade de vida
v
Abstract
Introduction: Population aging is a long-term trend that began several decades ago around the World. Anxiety and depression in the elderly are well studied around the world, and some authors consider them one of the most serious problems faced by modern societies.
Objectives: The present study is dedicated to the analysis of anxiety and depression prevalence, and their related factors, among Portuguese elderly people.
Methods: Data derived from second wave of follow up for EpiDoC Cohort – EpiDoC 2 study. EpiDoC Cohort is representative of adult Portuguese population, composed by 10,661 adults. The current study included all ≥ 65 years old EpiDoC 2 study participants, who responded to Hospital Anxiety and Depression Scale (HADS), n=1,680. A structured questionnaire was applied through computed assisted phone call interviews to all EpiDoC participants. Sociodemographic, lifestyles, self-reported non-communicable diseases, health related quality of life (EQ-5D-3D), physical function (HAQ) and health resources consumption information were collected. Anxiety and depression were assessed with HADS. Anxiety and depression prevalence were estimated according to study design. Multivariable linear regression was used to determine anxiety and depression score determinants.
Results: Portuguese elderly have prevalence of 9.59% for anxiety, and 11.77% for depression. Anxiety was more frequent in women and in participants with lower educational level. Depression was also more frequent in women and in elderly with lower educational level, with low household composition and living alone.
Low quality of life and physical disability were independently associated to both anxiety and depression score.
Discussion: Anxiety and depression are frequent among Portuguese elderly. Health-related quality of life and physical function are independently associated with anxiety and depression score.
Key words
Elderly; Anxiety and Depression; Non-communicable chronic diseases; Lifestyles; Quality of life; Function
vi TABLE OF CONTENTS
Acknowledgements ... iii
Resumo ... iv
Abstract ... v
List of Tables ... viii
List of Figures ... ix Abbreviations... x 1 Introduction ... 11 2 Method ... 18 2.1 Study design ... 18 2.2 Data Collection ... 20
2.2.1 Measurements, assessment and instruments ... 21
2.3 Participants ... 24 2.3.1 Sociodemographic characteristics ... 24 2.3.2 Health Characteristics... 25 2.3.3 Lifestyle characteristics... 27 2.4 Statistical analysis ... 28 2.4.1 Sample Weights ... 28
2.4.2 Analysis and Statistical Software ... 29
2.5 Ethical issues and Data protection ... 29
3 Results ... 31
3.1 Prevalence of anxiety and depression symptoms in the elderly ... 31
3.2 Anxiety & depression symptoms and non-communicable chronic diseases in the elderly….. ... 34
3.3 Anxiety & depression symptoms and Lifestyles in the elderly ... 36
3.4 Anxiety & depression symptoms and Function in the elderly ... 37
3.5 Anxiety & depression symptoms and quality of life in the elderly ... 37
3.6 Anxiety & depression symptoms and healthcare resources consumption in the elderly ……… ... 38
3.7 Anxiety and Depression in the elderly - Global Models ... 38
4 Discussion... 42
5 References... 51
vii
6.1 Annex a – Structured questionnaire for data collection ... 58 6.2 Annex b – STATA Outputs ... 58
viii List of Tables
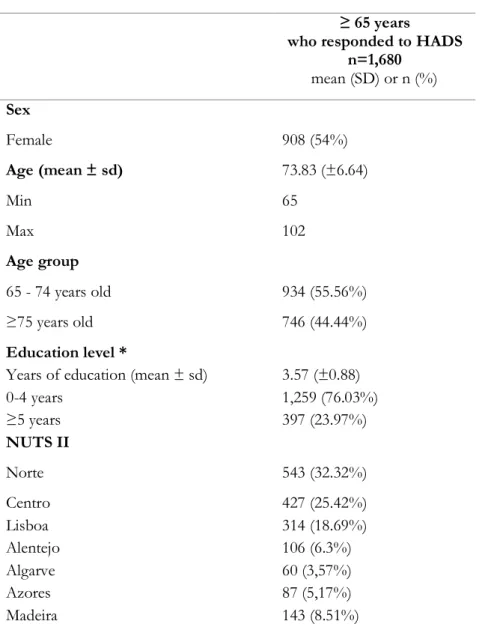
Table 1. Sociodemographic characteristics of the older adult EpiDoC 2 study population who responded to HADS.
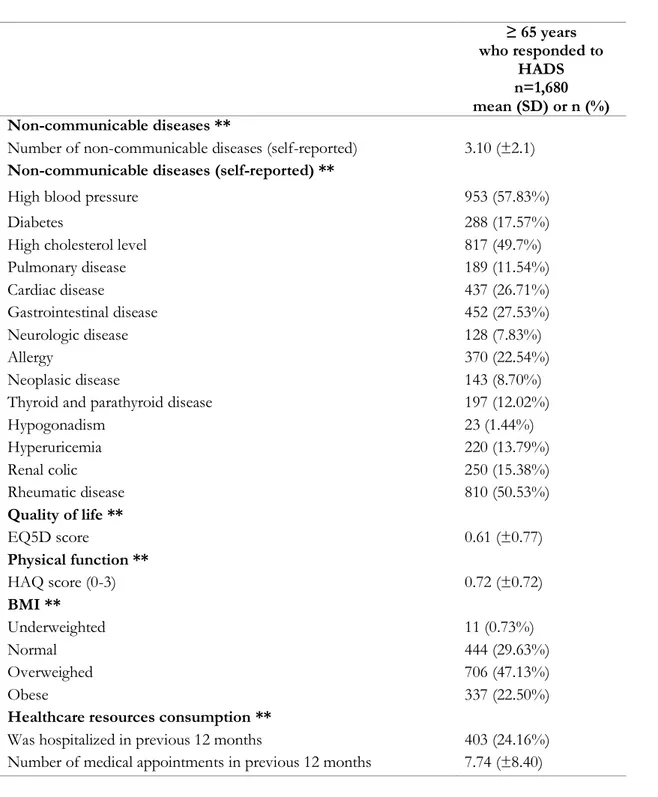
Table 2. Description of the health-related characteristics of the older adults EpiDoC 2 study Population who responded to HADS
Table 3. Description of lifestyle characteristics of the older adult EpiDoC 2 study Population who responded to HADS
Table 4. Sociodemographic and socioeconomic characteristics of the Portuguese elderly population with and without anxiety symptoms
Table 5. Sociodemographic and socioeconomic characteristics of the Portuguese elderly population with and without depression symptoms
Table 6. Association of anxiety symptoms with self-reported non-communicable diseases in Portuguese elderly
Table 7. Association of depression symptoms with self-reported non-communicable diseases in Portuguese elderly
Table 8. Global model for anxiety symptoms – a comparison between logistic and linear regression
Table 9. Global model for depression symptoms – a comparison between logistic and linear regression
ix List of Figures
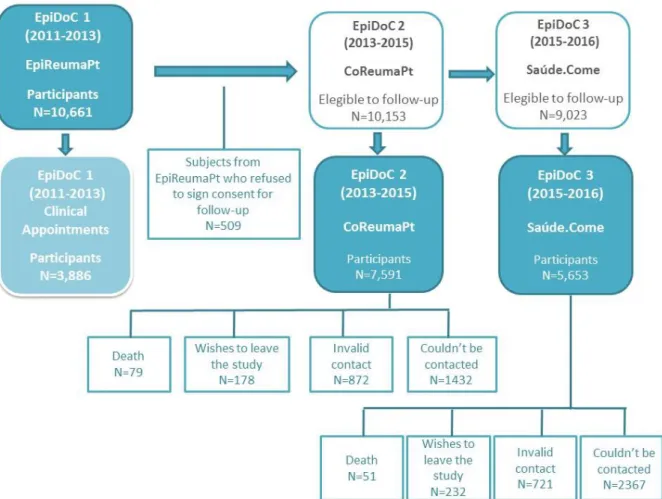
Figure 1. Flowchart of EpiDoC Cohort
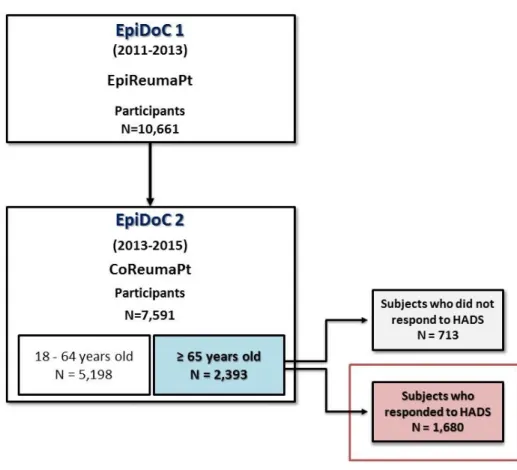
Figure 2. Flowchart describing population eligible for the present study Figure 3. Summary of collected variables
Figure 4. Population distribution by anxiety levels, according to HADS-A score Figure 5. Population distribution by depression levels, according to HADS-D score
x Abbreviations
95% CI – 95% confidence interval BMI – Body Mass Index
CAPI – computer assisted phone interview
EQ-5D-3L – European Quality of Life Questionnaire with Five Dimensions and Three Levels HADS – Hospital Anxiety and Depression Scale
HAQ – Health Assessment Questionnaire
NUT II – Nomenclature of Territorial Units for Statistics II (Norte, Centro, Lisboa e Vale do Tejo, Alentejo, Algarve, Região Autónoma dos Açores (the Azores), Região Autónoma da Madeira (Madeira))
OR – Odds ratio
SPR – Sociedade Portuguesa de Reumatologia USA – United States of America
11 1 Introduction
The present study is dedicated to the analysis of anxiety and depression prevalence, and their related factors, among a representative sample of Portuguese elderly.
Ageing
Our world is now old and aging. Population aging is a long-term trend that began several decades ago in Portugal, Europe and around the World. According to United Nations data for 2015, the number of people over 65 has increased considerably in the largest regions of the world and this aging is expected to accelerate in the coming decades (UN, 2015). The same data points out that, in 2015, 1 in 8 people in the world were 60 or older, totalling 901 million elderly people. A hundred seventy-six million of these elderly people live in Europe.
In Portugal, the number of people over 65 years of age doubled in relation to the 1970s and, by 2015, was already over 2 million, with the population over 80 years old increasing fivefold. In concrete terms, there were 836,058 people aged 65 and over in Portugal in 1971. In 1977, they surpassed one million and, in 2012, two million. In 2015 they were 2,122,996 (PORDATA, 2016). But population aging is, in fact, a success story: it is based on important changes in the birth rate and mortality, which are largely explained by developments in the social, scientific and economic development. Examples of those are the progress in reducing infant mortality, promoting access to education and employment, advances in gender equality, including in the transformation of the role of women into society - placing women in the labour market with its consequences on number of children. Significant improvements in reproductive health and access to family planning contributed decisively to reducing the birth rate (Lunenfeld & Stratton, 2013). In addition, progress in public health and health technologies coupled with the general improvement in living conditions, better hygiene and dietary lifestyle changes, mean that we are now living longer and, in most cases, healthier (Myers, 1987). Actually, babies born after 2000 in developed countries are highly likely to celebrate their 100th birthday if the current annual increase in life expectancy continues throughout the 21st century (Christensen, Doblhammer, Rau, & Vaupel, 2009).
The elderly population, despite its heterogeneity, presents several chronic diseases and medical conditions and, with aging, increases the likelihood multimorbility. Advanced ages are also
12
characterized by the emergence of geriatric syndromes, complex health states that do not fit into classified diseases (WHO, 2015).
Portugal faces major economic challenges in the 21st century, but also consequences of greater social relevance such as the quality of life of an aging population and the status of the elderly in society (INE, 2002) .
The way people live their old age depends largely on the how society itself thinks and acts before this population group (Oliveira, 2010). As Pimentel stated in 2001, “(…) the way one gets older, and the better or worse value that is given to this process, depends more on human societies than on Nature " (Pimentel, Afonso, & Pereira, 2012).
Particularly in industrialized countries, aging and the circumstances in which older people live and grow older are taking a central place in public health research.
Anxiety
Although the epidemiological investigation has begun to converge regarding the estimation of the prevalence of anxiety disorder in elderly populations, there are still quite a few discrepancies (Wolitzky-Taylor, Castriotta, Lenze, Stanley, & Craske, 2010) The sampling procedures diverge greatly: some studies use representative samples from the respective country and others use samples of convenience. In addition, there is considerable instability in age cut-offs considered for the definition of the elderly or older adult. On the other hand, there is much variation in the operationalization of anxiety, partly due to the use of different evaluation instruments.
Byrne (2002) argues that differences in anxiety prevalence rates may be owed to differences among populations, but also to differences in assessment tools and algorithms used for diagnosis (Byrne, 2002). Some studies use the hierarchical approach to diagnosis which may lead to lower prevalence by excluding individuals with diagnostic criteria that also have criteria for diagnosing other higher disorders in the hierarchy (Wolitzky-Taylor et al., 2010).
Prevalence of anxiety
Bryant and collaborators (2007) defend that significant anxiety symptoms range from 15% to 52% in community samples, and from 15% to 56% in samples in medical settings (Bryant, Jackson, & Ames, 2008).
13
Himmerlfarb and Murrell (1984) conducted an important epidemiological study in the United States to estimate the prevalence of self-reported anxiety symptoms in a population aged 55 years or older (Himmelfarb & Murrell, 1984). This assessment was not intended to estimate the prevalence of anxiety disorders but to estimate the proportion of people in this age group who would have anxiety symptoms at sufficient level to be at risk of suffering an anxiety disorder or requiring intervention of some kind. The authors had a prevalence of 20% for anxiety symptoms. Beekman et al (1998), analysing the results of Longitudinal Study of Aging in Amsterdam (LASA), indicate a global prevalence of anxiety disorders of 10.2%, with the most frequent disturbance being Generalized Anxiety Disorder (Beekman et al., 1998).
In Portugal, National Epidemiological Study on Mental Health (J. Almeida et al., 2013) using data collected in 2008-2009, found a prevalence of 2.6% for Generalized Anxiety Disorder in a representative sample of Portuguese elderly constituted by a total 386 participants ≥65 years old. Factors associated with anxiety
Himmerlfarb and colleagues found anxiety symptoms were significantly higher among women (Himmelfarb & Murrell, 1984). The symptoms of anxiety varied inversely with the socioeconomic level. Another conclusion of interest was that 73% of people with significant levels of anxiety symptoms also needed medical services, in contrast to only 55% of those without significant anxiety symptoms (Himmelfarb & Murrell, 1984).
Discussing the role of age in anxiety disorders, Beekman and collaborators (1998), concluded that age itself does not have an impact on the prevalence of anxiety disorders, as opposed to other risk factors such as female sex and low levels of education (Beekman et al., 1998). Factors that are associated with more advanced ages such as chronic illness and family losses are also risk factors for anxiety disorders.
The Epidemiologic Catchment Area (ECA Study) in USA, and Edmonton studies, in Canada, concluded that the prevalence of anxiety disorders was lower in the elderly than in all age groups combined (Bland, Newman, & Orn, 1988; Regier et al., 1988). Henderson and collaborators (1998) in Australia also concluded that anxiety symptoms decreased with age in both sexes along with other potential risk factors such as adverse events and severe economic difficulties (Henderson et al., 1998). However, the authors note that the results may have the bias of the individuals who agreed to participate in the study (Henderson et al., 1998). Bryant and colleagues (2008), in their review on anxiety prevalence in the elderly, runs against Henderson team (1998) and point out that the lower prevalence rates in older individuals may be reflecting the methods
14
of selection and sampling (Bryant et al., 2008). And indeed, Teachman, in 2006, reported a curvilinear relationship between age and anxiety symptoms, with increases in anxiety and negative affect from the age of 75 years (Teachman, 2006).
Lenze and Wetherell (2011) claim that anxiety disorders are common in older people and cause considerable disability (Lenze & Wetherell, 2011). Considering a large group of epidemiological studies focused on elderly, the authors concluded that generalized anxiety disorder is the most prevalent in this age group, despite of scare attention is given to this disorder in later life.
Factors associated with aging, such as social isolation, reduced autonomy, financial insecurity, and poor health, cause an increase in the prevalence of anxiety disorders and symptoms (Flint, 1994). Some studies point to psychosocial risk factors for anxiety disorders and late-onset depression: female gender, cognitive dysfunction, chronic illness, poor health perception, functional limitations, personality traits such as neuroticism and weak coping strategies (Tilburg, 2003; Vink, Aartsen, & Schoevers, 2008). Specifically, for anxiety disorder: not having children, low income, and experiencing traumatic events (Lenze & Wetherell, 2011). Beekman and collaborators (2000) divided the risk factors for anxiety in the elderly into external and internal (Beekman et al., 2000). External factors, or stressors, are the authors chronic illness, disability, and spouse illness. Internal factors, or vulnerability factors, include personality traits of neuroticism and low self-efficacy (Beekman et al., 2000).
In 2005, Brenes and her team studied the relation between physical function reduction – disability – and anxiety, concluding they were significantly associated (Brenes et al., 2005). Years later, the same author in an individual work, demonstrated the strait relation between anxiety and quality of life, as severity of anxiety symptoms increase, quality of life decrease (Brenes, 2007). Depression
In the last decades, there was a bourgeoning of large-scale epidemiological studies to ascertain the prevalence of depression at later ages. Some authors even consider that one of the most serious problems faced by modern societies is depression among the elderly (e.g. (Chapman & Perry, 2008).
Although depression is fairly common in the last years of life (Blazer & Hybels, 2005), there is great variation in its prevalence in studies worldwide (Castro-Costa et al., 2007). These differences may be due to actual differences in the population studied but may also be due to the different methods adopted by the authors and the different case definitions (Beekman, Copeland, & Prince, 1999).
15 Prevalence of depression
In his review on the prevalence of depression in older adults, Beekman and colleagues (1999) analysed the literature from the point of view of the case definition of depression (diagnosis or syndrome) to reduce variation (Beekman et al., 1999). Their results showed that Major Depressive Disorder, per the diagnostic criteria, is relatively rare, with an average prevalence of 1.8%. The mean prevalence of the Minor Depressive disorder increases to 10.2% and, when considering all depressive syndromes, the prevalence is 13.3%. He included studies from several European and Asian countries, USA and Canada, and Australia.
A study in India, despite the small number of participants, concluded that elderly have a high prevalence of depressive symptoms (Goyal & Kajal, 2014). And in Brazil, Almeida et al (1997), demonstrated the high prevalence of depressive symptoms and their association with increased impact on primary health care (O. Almeida et al., 1997) . As we zoom in in Europe, we found the Survey of Health, Aging and Retirement in Europe (SHARE), which is a database with health, psychological, economic and social and family support variables with approximately 123,000 individuals aged 50 years or more; it involves 27 European countries and Israel (Castro-Costa et al., 2007). Based on this database, the authors compared the prevalence of depressive syndrome in adults over 50 years of age in 10 European countries: Denmark, Sweden, the Netherlands, Germany, Austria, Switzerland, France, Spain, Italy and Greece (Castro-Costa et al., 2007). The results indicate a higher prevalence of depression in France, Italy and Spain (33%) followed by Greece (24%). In other countries prevalence is around 18-19%. The differences between countries are statistically significant (p <0.001) (Castro-Costa et al., 2007).
In Portugal, Almeida and collaborators (2013), using data collected in 2008-2009, found a prevalence of 12% for depression in the Portuguese with 65years or more (J. Almeida et al., 2013).
Factors associated to depression
The Longitudinal Study of Aging in Amsterdam (LASA) aimed to study the determinants, course and consequences of cognitive, emotional and physical functioning in aging. The researchers followed a representative group of adults aged 55 to 85 from three regions of the Netherlands (Huisman et al., 2011). Beekman (2002) followed a cohort of elderly people and concluded that, although major depressive disorder is relatively rare among the elderly, depressive symptoms are
16
severe and chronic (Beekman, Geerlings, et al., 2002). In 2016, Hoogendijk and colleagues, compiling the main results of this cohort, reported that the depressive symptomatology with a clinically significant level (but not corresponding to diagnostic criteria of Major Depressive Disorder) presents an incidence of 24% and significantly influences the quality of life and function in this population (Hoogendijk et al., 2016).
From an epidemiological perspective, the question if increasing age is a risk factor for depression is not clear. The results of the prospective study conducted by Heun (2005) demonstrate that age is a risk factor for depression (Heun & Hein, 2005), as opposed to the study by Steffens et al (2000) that found no age influence on the prevalence of depression (Steffens et al., 2000).
Alameda County is a longitudinal study beginning in 1965 on physical and mental health and mortality, representative of the adult population of Alameda County in California. In the study by Roberts and his team (1997), who analysed the data collected in 1994, points to an increase in prevalence with age (Roberts, Kaplan, Shema, & Strawbridge, 1997). However, multivariate analyses have shown that, when controlled for other psychosocial risk factors, there are no significant age effects. Thus, healthy, normal-function elderly patients are at no increased risk for depression (Roberts et al., 1997). The effects of age on depression are associated with physical health problems and associated disabilities. Also, a study in the Netherlands concluded that depressive symptoms are highly prevalent in the elderly and increase with age (van't Veer-Tazelaar et al., 2008). Nevertheless, more than attributable to increasing age, the authors ascribe this increase in prevalence to changes in age-related risk factors such as functional disability, loneliness, and falling concern (van't Veer-Tazelaar et al., 2008).
In his review of literature, Djernes (2006) systematized the predictors of depressive disorder and depressive symptoms in the elderly described in the literature, concluding that the female sex, chronic diseases, cognitive and functional disability, lack or loss of social contacts and clinical history of depression are strong predictors to consider (Djernes, 2006). Barefoot (2001) also demonstrated that female sex is associated with more depressive disorders and more depressive symptoms (Barefoot, Mortensen, Helms, Avlund, & Schroll, 2001). Being single, separated or divorced is also a predictor of disorders and depressive symptoms for both sexes (Minicuci, Maggi, Pavan, Enzi, & Crepaldi, 2002), and widowhood means increased risk of these disorders and symptoms, especially for men (van Grootheest, Beekman, Broese van Groenou, & Deeg, 1999).
17
Living alone, according to a study in a population of elderly people in Helsinki, is also associated with depressive symptoms (Valvanne, Juva, Erkinjuntti, & Tilvis, 1996)
Chronic diseases are strongly associated with the appearance of depressive disorders and depressive symptoms, as is the case of cardiac and musculoskeletal diseases (Valvanne et al., 1996).
According to McCall and colleagues (2002), lower levels of education were associated with depressive disorders and depressive symptoms (McCall, Parks, Smith, Pope, & Griggs, 2002), and other studies have shown that they were also associated to lower quality of life scores (Xavier et al., 2002).
Health-related dysfunction or disability is a risk factor for the appearance of depressive symptoms and depressive disorders (Haynie, Berg, Johansson, Gatz, & Zarit, 2001; Mezuk, Edwards, Lohman, Choi, & Lapane, 2012; Schulman, Gairola, Kuder, & McCulloch, 2002), even in very old people (Forsell, Jorm, & Winblad, 1998; Meller, Fichter, & Schroppel, 1997; Päivärinta, Verkkoniemi, Niinistö, Kivelä, & Sulkava, 1999)
Sarris and colleagues (2014) postulate that there is now compelling evidence that a range of lifestyle factors are involved in the pathogenesis of depression such as diet, physical exercise, alcohol intake, sleep and smoking (Sarris, O'Neil, Coulson, Schweitzer, & Berk, 2014).
Objectives
The study objectives are: 1) to determine the prevalence of anxiety and depression symptoms in the Portuguese elderly population, and 2) to identify relevant associations between the symptoms of anxiety and depression and chronic self-reported non-communicable diseases, lifestyles, function, quality of life and healthcare resources consumption in the Portuguese elderly population.
Given the social and economic context of our country, generating relevant evidence on anxiety and depressive symptoms in the Portuguese elderly population, and understanding them from a point of view that goes beyond the mental illness itself, by approaching the possible associated factors, is crucial. Data on elderly mental health and associated factors could be useful to address therapeutic programs and better planning of health care.
18 2 Method
2.1 Study design
To analyse the older adult Portuguese population in terms of symptoms of anxiety and depression, their association with non-communicable chronic diseases, function, lifestyles, and quality of life we used the second wave of follow up for EpiDoC Cohort – EpiDoC 2 study - done by computer assisted phone interviews (CAPI).
EpiDoC Cohort is a representative study of adult Portuguese population (Figure 1), composed by 10,661 adults (≥18 years old) who were non-institutionalized and living in private households in the Mainland and the Islands (Azores and Madeira) (Rodrigues et al., 2015). Recruitment took place between September 2011 and December 2013 and the candidate households were selected using a random route process. The adults with permanent residence in the selected household with the most recently completed birthday were recruited and face-to-face interviewed (one adult per household).
All 10,661 participants of EpiDoC Cohort signed the Informed Consent for 1st wave (EpiDoC 1
study) and 10,153 signed the informed consent for follow ups and provided their telephone number. Subjects unwilling to sign the Informed Consent, unable to speak Portuguese or with an inability to answer the questionnaire, despite being aided, were excluded (P A Laires et al., 2012). Nevertheless, a caregiver could be the one answering the questionnaire.
EpiDoC 1 study was the first wave of data collection and occurred between September 2011 and December 2013, along with the recruitment. It is a national, cross-sectional and population-based study that aimed to determine rheumatic and musculoskeletal diseases (RMD) prevalence and their burden in Portugal.
EpiDoC 2 study consisted on a structured questionnaire (Annex A), applied through phone call interviews to the same 10,153 eligible participants of EpiDoC 1 study who consented to be contacted again for follow-up. This study systematically collected and analysed longitudinal data (the nuclear questionnaire) as well as allowed adding new questions regarding life styles, health innovation and social interactions. Specific domains were addressed for all population, such as sociodemographic and socioeconomic data, anthropometric measures, non-communicable chronic diseases and risk factors for cardiovascular events, anxiety, depression, physical function and quality of life, falls and bone fractures, hospitalizations, home care assistance and medical
19
appointments, medication and other treatment, alcohol and smoking habits, physical exercise and lifestyles, mortality information, habits regarding new technologies, search for health information, development and adoption of health innovation, trust in conventional healthcare system, alternative medicines, adverse events. The study included 7,591 participants, representative of the adult Portuguese population.
20
The present study included all 65 and more years old EpiDoC 2 study participants, who responded to HADS (Figure 2) (n=1,680).
Figure 2. Flowchart describing population eligible for the present study.
2.2 Data Collection
The data collection was performed from March 26th 2013 to July 27th 2015. A trained research
assistants’ team was responsible for collecting the follow-up data from these subjects, by randomly call all the individuals. When a contact was not available, they would hold more attempts in different moments (morning, afternoon, evening and weekends) to perform six attempts. The last contact had to have at least 1 month of interval from the previous one. Only then the contact would be abandoned. Rescheduling of the telephonic interviews to a more convenient moment was also an option. The interview was telephonically performed with the assistance of a CATI (computed assisted telephone interview) system (an in-house software platform, created by the informatics team of Sociedade Portuguesa de Reumatologia (SPR)).
Data was collected in a standardized form and database access is protected by unique username and password, for each research team member, according to Portuguese Law of data collection ("Lei nº 67/98 - Lei da Proteção de Dados Pessoais," 1998).
21 2.2.1 Measurements, assessment and instruments
2.2.1.1 Sociodemographic and socioeconomic characteristics
Information on sociodemographic (sex, age, years of education, household composition, NUT II), as well as socioeconomic variables (household income) were collected in the 1st wave -
EpiDoC 1 study. Subjects were asked in the EpiDoC 2 study interview whether there have been changes.
2.2.1.2 Health characteristics
In EpiDoC 1 study, individuals were asked if they had been previously diagnosed with some chronic disease (high cholesterol level, high blood pressure, rheumatic disease, allergy, gastrointestinal disease, cardiac disease, diabetes, thyroid and parathyroid disease, urolithiasis, pulmonary disease, hyperuricemia, cancer, neurologic disease, hypogonadism) and this information was updated in the EpiDoC 2 study interview.
Self-reported height and weight were collected in EpiDoC 2. Based on these data, Body Mass Index (BMI, weight/height2, in kg/m2) was calculated and categorized according to the World
Health Organization (WHO) classification in four categories: underweight (BMI < 18.5 kg/m2), normal (BMI between 18.5-24.9 kg/m2), overweight (BMI between 25-29.9 kg/m2) and obesity (BMI ≥ 30 kg/m2) (WHO, 1995) .
To evaluate symptoms of anxiety and depression in EpiDoC 2 study, the Hospital Anxiety and Depression Scale (HADS) Portuguese validated version was applied (Pais-Ribeiro et al., 2007). The HADS was originally developed by Zigmond and Snaith (Zigmond & Snaith, 1983) as a screening tool to apprehend clinically significant states of anxiety and depression in a non-psychiatric hospital setting. “I get a sort of frightened feeling like something awful is about to happen” is an example for anxiety subscale item, and “I still enjoy the things I used to enjoy” for depression subscale. The HADS was designed to be a short, 14-item, self-assessment scale that was easily understandable and capable of distinguishing between these emotional states (Snaith, 2003). he anxiety and depression sub-scales each consist of seven items with each item having four possible answers scored 0, 1, 2 or 3. Individual anxiety and depression scores are calculated by summation
22
of the appropriate seven items and thus can range from 0 to 21, with higher scores indicating higher levels of anxiety or depression, respectively. In both subscales, a score between 0 and 7 is ‘‘normal’’, between 8 and 10 ‘‘mild’’, between 11 and 14 ‘‘moderate’’ and between 15 and 21 ‘‘severe’’ (idem). To each one the cutoff used for positive symptoms was ≥11, since Snaith (2003) suggested a score ≥ 11 was indicative of “‘caseness’’ to a mood disorder (Snaith, 2003).
Pais-Ribeiro in the instrument validation found a Cronbach alpha of .76 was found with the correlation items scale corrected for overlap between .43 and .57 and with the majority of correlation in the range 0.50 – 0.59 for anxiety subscale. In the present study, the Cronbach alpha for anxiety subscale was 0.39 (Pais-Ribeiro et al., 2007).
In instrument validation, for depression, a Cronbach alpha of .81 was found with the correlation item scale corrected for overlap between .37 and .64 and with the majority of correlations in range .60 – .69. In the present study, the depression Cronbach alpha was 0.47.
Health-related quality of life was assessed using the Portuguese validated version of European Quality of Life questionnaire (EQ-5D-3L) (Ferreira, Ferreira, Pereira, & Oppe, 2014a, 2014b) The EQ-5D-3L is a preference-based measure widely used in cost-utility analysis. It comprises five dimensions (mobility e.g. “I don’t have problems walking”, self-care e.g. “I have some problems in
dressing myself”, usual activities e.g. “I have no problem performing my usual activities”, pain/discomfort
e.g. “I have moderate pain and discomfort” and anxiety/depression e.g. “I am not anxious or depressed) with three levels each, for which a higher score corresponds to a higher quality of life. The Portuguese version of EQ5D has Cronbach alfa of 0.72. In the present study, Cronbach alfa for this tool was 0.65.
Function was evaluated based on the Portuguese version of Health Assessment Questionnaire (HAQ) (Benito-Garcia et al., 2006; Santos et al., 1996) . The Health Assessment Questionnaire (HAQ) is the most widely used and universally accepted questionnaire to evaluate rheumatology function (Fries, Spitz, Kraines, & Holman, 1980). It has been validated in various populations and languages. The Portuguese version (P-HAQ) was created based on the English version of 20 items, and this work was already published in Portugal. Functional ability is measured by nine general component categories (dressing and grooming, arising, eating, walking, hygiene, reach, grip, outside activity, and sexual activity), each of which consists of one or more specific questions. For example, “Are you able to shampoo your hair?” is one question asked in the dressing and grooming component. Each question is scored from 0 to 3. The scoring is based on the following scale: “without difficulty” = 0, “with difficulty” = 1, “with some help from another
23
person or with a device” = 2, and “unable to do” = 3. The higher score, the worse functional ability. In the present study, HAQ had a Cronbach alfa of 0.96.
To assess healthcare resources consumption, “number of medical appointments in the previous 12 months” and “hospitalization in the previous 12 months (yes/no)” were asked to participants. 2.2.1.3 Lifestyle characteristics
In EpiDoC 2 study, questions concerning lifestyle habits included frequency of alcohol intake (daily, occasionally, never), smoking habits (current smoker, past smoker, never smoked), sleep habits (number of hours of sleep per day, categorized in < 6 and ≥ 6 hours/day). Physical activity level was classified based on the question related to the reported weekly frequency of physical activity. A frequency of once a week or more was considered “yes” to regular physical exercise. Figure 3 summarizes all variables collected in EpiDoC 2 study that are relevant for the present study.
24 2.3 Participants
2.3.1 Sociodemographic characteristics
Our population of interest included 1,680 participants, 908 (54%) of those were females (Table 1). Forty four percent were 75 years old or more. With respect to educational level, almost two thirds of participants (n=1,259; 76.03%) had less or equal to 4 years of education.
Most people with 65 years of age and more reported to live on a household income of less than 1000€ per month; 35,8% reported the lowest income level of 500€/month. Moreover, elderlies tend to live in households composed by only one (25.53%) or two persons (55.89%).
Table 1. Sociodemographic characteristics of the older adult EpiDoC 2 study population who responded
to HADS.
≥ 65 years
who responded to HADS n=1,680 mean (SD) or n (%) Sex Female 908 (54%) Age (mean ± sd) 73.83 (±6.64) Min 65 Max 102 Age group 65 - 74 years old 934 (55.56%) ≥75 years old 746 (44.44%) Education level *
Years of education (mean ± sd) 3.57 (±0.88)
0-4 years 1,259 (76.03%) ≥5 years 397 (23.97%) NUTS II Norte 543 (32.32%) Centro 427 (25.42%) Lisboa 314 (18.69%) Alentejo 106 (6.3%) Algarve 60 (3,57%) Azores 87 (5,17%) Madeira 143 (8.51%)
25 Household income * ≤500€ 442 (35.85%) 501€ to 750€ 332 (26.93%) 751€ to 1000€ 168 (15.09%) > 1000€ 291 (23.60%) Household composition 1 person 429 (25.53%) 2 people 939 (55.89%) ≥3 people 312 (18.57%)
Legend: Sd: standard deviation; %: percentage; Min: minimum age found in sample; Max: maximum age
found in sample; Household composition: number of people that live in the house of the participant, including himself/herself. * Sample size is not constant due to missing data: Years of education and Education level (n=1,656), Household income (n=1,233)
2.3.2 Health Characteristics
With respect to health-related characteristics, the observed mean number of non-communicable chronic diseases was 3.10 (±2.1). The most frequently reported chronic diseases were high blood pressure (57.3%), rheumatic diseases (50.53%), and high cholesterol level (49.7%).
People 65+ years old score EQ-5D-3L on average 0.61 (±0.77) for quality of life, and Quality of life and 0.72 (±0.72) in HAQ for physical function.
The high consumption of health care resources by the older age group matches the health status. The average number of appointments was 7.74 (±8.40), and 24,16% was hospitalized in the last 12 months.
26
Table 2. Description of the health-related characteristics of the older adults EpiDoC 2 study Population
who responded to HADS
≥ 65 years who responded to HADS n=1,680 mean (SD) or n (%) Non-communicable diseases **
Number of non-communicable diseases (self-reported) 3.10 (±2.1)
Non-communicable diseases (self-reported) **
High blood pressure 953 (57.83%)
Diabetes 288 (17.57%)
High cholesterol level 817 (49.7%)
Pulmonary disease 189 (11.54%) Cardiac disease 437 (26.71%) Gastrointestinal disease 452 (27.53%) Neurologic disease 128 (7.83%) Allergy 370 (22.54%) Neoplasic disease 143 (8.70%)
Thyroid and parathyroid disease 197 (12.02%)
Hypogonadism 23 (1.44%) Hyperuricemia 220 (13.79%) Renal colic 250 (15.38%) Rheumatic disease 810 (50.53%) Quality of life ** EQ5D score 0.61 (±0.77) Physical function ** HAQ score (0-3) 0.72 (±0.72) BMI ** Underweighted 11 (0.73%) Normal 444 (29.63%) Overweighed 706 (47.13%) Obese 337 (22.50%)
Healthcare resources consumption **
Was hospitalized in previous 12 months 403 (24.16%) Number of medical appointments in previous 12 months 7.74 (±8.40)
Legend: Sd: standard deviation; %: percentage; EQ5D: European Quality of Life questionnaire five
dimensions three levels; HAQ: Health Assessment Questionnaire; BMI: Body Mass Index (kg/m2) **Sample size is not constant due to missing data: Body Mass Index (kg/m2) (n=1,498), EQ5D score (0-1) (n=1,632), Physical function HAQ score (0-3) (n=1,676) High blood pressure (n=1,648), Diabetes (n=1,638), High cholesterol level (n=1,644), Pulmonary disease (n=1,639), Cardiac Disease (n=1,636), Gastrointestinal disease (n=1,642), Neurologic disease (n=1,635), Allergy (n=1,641), Neoplasic disease
27
(n=1,643), Thyroid and parathyroid disease (n=1,639), Hypogonadism (n=1,594), Hyperuricemia (n=1,595), Renal colic (n=1,626), Rheumatic disease(n=1,603), Was hospitalized (n=1,668), Number of medical appointments (n=1,402).
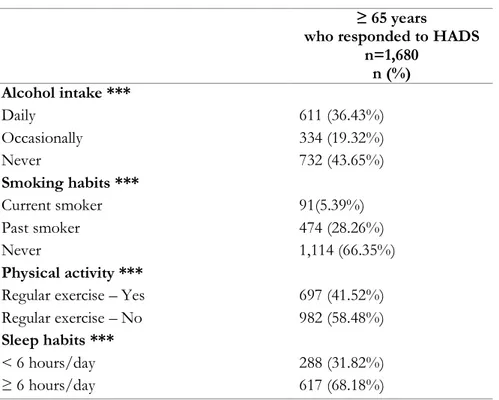
2.3.3 Lifestyle characteristics
Regarding lifestyle habits, namely in terms of alcohol intake and smoking habits, 36.43% of the individuals had reported a daily intake of alcohol beverages but only 5.39% were current smokers. Among the elderly, 43.65%of the subjects never consume alcohol and 66.35% of people aged 65 and above never smoked.
Almost 60% of individuals above 65 years old do not engage in regular physical exercise, and around 70% of the Portuguese elderly sleep 6 or more hours per day.
Table 3. Description of lifestyle characteristics of the older adult EpiDoC 2 study Population who
responded to HADS
≥ 65 years
who responded to HADS n=1,680 n (%) Alcohol intake *** Daily 611 (36.43%) Occasionally 334 (19.32%) Never 732 (43.65%) Smoking habits *** Current smoker 91(5.39%) Past smoker 474 (28.26%) Never 1,114 (66.35%) Physical activity ***
Regular exercise – Yes 697 (41.52%)
Regular exercise – No 982 (58.48%)
Sleep habits ***
< 6 hours/day 288 (31.82%)
≥ 6 hours/day 617 (68.18%)
Legend: %: percentage;
***Sample size is not constant due to missing data: Alcohol intake (n=1,677), Smoking habits and Physical activity (n=1679), Sleep habits (n=905)
28 2.4 Statistical analysis
2.4.1 Sample Weights
EpiDoC was designed to obtain a representative sample of the Portuguese population (Rodrigues et al., 2015). In order to guarantee its representativity, weighted proportions have, for this matter, been computed.
For the cohort, the initial extrapolation weights were calculated as the inverse of the inclusion probabilities, taking into account the sampling design, i.e., a stratified two-stage cluster sampling design. The stratification was based on the seven NUTS II regions and on five classes of the number of inhabitants per locality (<2,000; 2,000-9,999; 10,000-19,999; 20,000-99,999; >99,999). In each stratum, the first sampling stage consisted in the selection of localities with a probability proportional to its size (number inhabitants aged 18 years old or more), except for localities where the number of inhabitants was larger than 20,000, where all the localities were selected. In the second stage, households were selected using a pseudo-random selection procedure equivalent to the equal probability selection. These weights were submitted to a calibration process by crossing region (seven classes), size of locality (five classes), gender (two classes) and seven age categories (18-25, 26-35, 36-45, 46-55, 56-65, 66-75 and ≥76 years old). This procedure was used to reproduce the known population totals for the crossing margins of these four variables.
In order to maintain the representativeness of the sample in relation to the Portuguese population (Mainland and Autonomic Regions), extrapolation weights were computed and used in further statistical analysis. These were obtained by calibrating the extrapolation weights originally designed for the EpiDoC 1 study sample.
We first compared the participants and non-participants of EpiDoC 2 study, concerning their sociodemographic, socioeconomic and health status characteristics. Based on this comparison, we decided to adjust the weights based on the stratification by NUT II region, sex, and age group. In the present study, we used the extrapolation weights calculated to EpiDoC 2 study since the elderly who responded to HADS did not present different characteristics in terms of sex, age and NUTS II region distribution.
29 2.4.2 Analysis and Statistical Software
Descriptive data for each categorical variable was presented as the absolute frequency and the correspondent proportion, adjusted for the weight to adjust for study design. The same adjustment has been done for the mean and standard deviation (SD) for each continuous variable.
First step was to perform univariate logistic regressions to approach relations between independent variables and outcomes.
When previous analyses resulted in statistically significant associations, multivariable logistic regressions were performed, adjusting to sociodemographic characteristics: sex, age group (65-74 years old; ≥75 years old), region (NUTS II), educational level (0-4 years; ≥ 5 years) and household income (≤500€, 501€ to 750€, 751€ to 1000€, >1000€).
Finally, the separate global models for anxiety and depression were conceptualized two ways. A logistic regression was performed with all previous significant or clinically relevant independent variables, adding adjustment for sociodemographic features. In addition, considering the outcome (anxiety and depression) as a continuous variable, linear regressions were performed for all independent variables with statistical significance or considered clinically relevant, holding the adjustment for relevant sociodemographic characteristics.
Significance level was set at 0.05. All analyses were weighted and executed using STATA IC version 12 (StataCorp. 2011. Stata Statistical Software: Release 12. College Station, TX: StataCorp LP).
2.5 Ethical issues and Data protection
EpiDoC 1 study was performed by the principles established by the Declaration of Helsinki ("World Medical Association Declaration of Helsinki: ethical principles for medical research involving human subjects," 2013) and revised in 2013 in Fortaleza. The study was reviewed and approved by the National Committee for Data Protection (Comissão Nacional de Proteção de Dados) and by the NOVA Medical School Ethics Committee. The participants provided informed consent to contribute in all phases of the study.
30
The EpiDoC 2 study was also approved by National Committee for Data Protection (in accordance with the Portuguese law number 67/98, October 26th, regarding protection of
personal data) and was submitted to the same Ethics Committee. The study was conducted in accordance with the applicable laws and regulations including, but not limited to, the Guideline for Good Clinical Practice and the ethical principles stated in the Declaration of Helsinki (World Medical Association, 2013).
Participants’ confidentiality will be safeguarded by the nonexistence of identifiers on the database (only unique ID participants’ codes). Their names and contacts will be stored separately from study data transmitted to the coordinating centre (based on the headquarters of the SPR. Thus, all data for future analysis will be kept anonymously and securely by the EpiDoC 2 study authorized staff. During EpiDoC 1 study, consent was also signed by those accepting to participate in the EpiDoC 2 study. There will be absolutely no disclosure of individual health information to the general public.
31 3 Results
3.1 Prevalence of anxiety and depression symptoms in the elderly
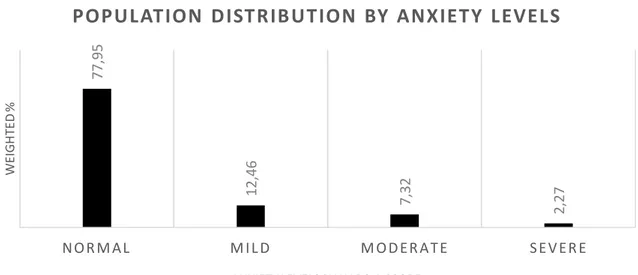
The current study found 176 elderlies out of 1,680 (10.48%) presenting anxiety symptoms (HADS-A ≥11), corresponding to a prevalence of 9.59% when weighted to Portuguese elderly population. The mean score for HADS-A was 5.04 (±3.74) and, considering anxiety, the population distributed as shown in figure 3.
Figure 4. Population distribution by anxiety levels, according to HADS-A score.
Normal: 0-7; Mild: 8-10; Moderate: 11-14; Severe: 15-21.
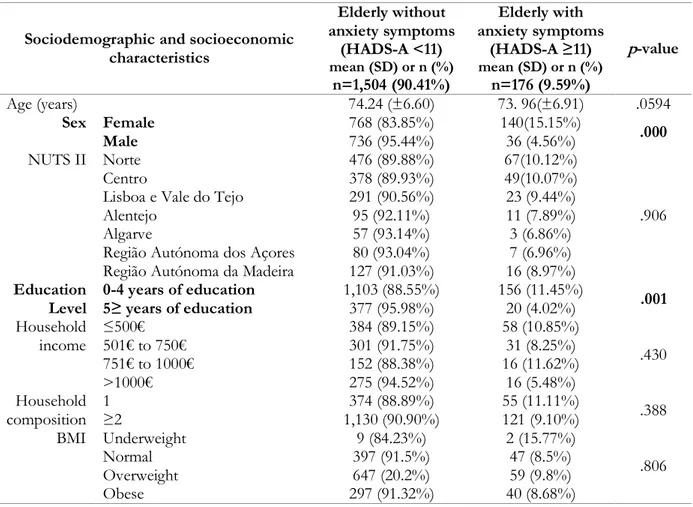
Sociodemographic and socioeconomic characteristics of the Portuguese elderly population with and without anxiety symptoms are summarized in Table 4.
77 ,9 5 1 2 ,4 6 7 ,3 2 2 ,2 7 N O R M AL M I L D M O D E R A T E S E V E R E W E IGH TE D %
ANXIETY LEVELS BY HADS-A SCORE
32
Table 4: Sociodemographic and socioeconomic characteristics of the Portuguese elderly population with and without anxiety symptoms
Sociodemographic and socioeconomic characteristics Elderly without anxiety symptoms (HADS-A <11) mean (SD) or n (%) n=1,504 (90.41%) Elderly with anxiety symptoms (HADS-A ≥11) mean (SD) or n (%) n=176 (9.59%) p-value Age (years) 74.24 (±6.60) 73. 96(±6.91) .0594 Sex Female 768 (83.85%) 140(15.15%) .000 Male 736 (95.44%) 36 (4.56%) NUTS II Norte 476 (89.88%) 67(10.12%) .906 Centro 378 (89.93%) 49(10.07%)
Lisboa e Vale do Tejo 291 (90.56%) 23 (9.44%)
Alentejo 95 (92.11%) 11 (7.89%)
Algarve 57 (93.14%) 3 (6.86%)
Região Autónoma dos Açores 80 (93.04%) 7 (6.96%) Região Autónoma da Madeira 127 (91.03%) 16 (8.97%)
Education
Level 0-4 years of education 5≥ years of education 1,103 (88.55%) 377 (95.98%) 156 (11.45%) 20 (4.02%) .001 Household income ≤500€ 501€ to 750€ 384 (89.15%) 301 (91.75%) 58 (10.85%) 31 (8.25%) .430 751€ to 1000€ 152 (88.38%) 16 (11.62%) >1000€ 275 (94.52%) 16 (5.48%) Household composition 1 ≥2 1,130 (90.90%) 374 (88.89%) 55 (11.11%) 121 (9.10%) .388 BMI Underweight 9 (84.23%) 2 (15.77%) .806 Normal 397 (91.5%) 47 (8.5%) Overweight 647 (20.2%) 59 (9.8%) Obese 297 (91.32%) 40 (8.68%)
Legend: SD – standard deviation; % - weighted percentage; NUTS II - Nomenclatura das Unidades
Territoriais, level II; BMI – Body Mass Index (kg/m2); € - euro; HADS-A – Hospital Anxiety and
Depression Scale – Anxiety subscale; bold: Variables with statistical significance
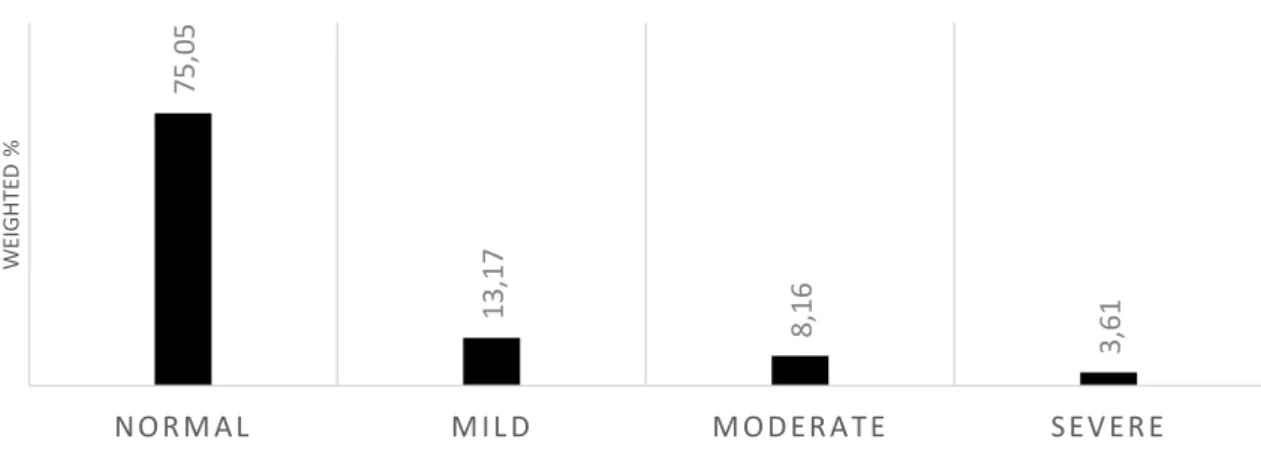
In terms of depression symptoms, figures rise to 241 (14.34% in the present sample), equivalent to a prevalence of 11.77% of the Portuguese elderly population. This population had a mean score for HADS-D of 5.27 (±4.07). Figure 4 illustrates the population distribution regarding depressive symptoms.
33
Figure 5. Population distribution by depression levels, according to HADS-D score.
Normal: 0-7; Mild: 8-10; Moderate: 11-14; Severe: 15-21.
Table 5: Sociodemographic and socioeconomic characteristics of the Portuguese elderly population with and without depression symptoms
Sociodemographic and socioeconomic characteristics Elderly without depression symptoms (HADS-D <11) mean (SD) or n (%) n=1,439 (88,23%) Elderly with depression symptoms (HADS-D ≥11) mean (SD) or n (%) n= 241 (11,77%) p-value Age (years) 73.57 (±6.51) 75.74(±7.23) .000 Sex Female 747 (84.47%) 161 (15.53%) .000 Male 692 (91.64%) 80 (8.36%) NUTS II Norte 463 (87.84%) 80(12.16%) .020 Centro 360 (85.41%) 67(14.59%)
Lisboa e Vale do Tejo 281 (93.63%) 33 (6.37%)
Alentejo 89 (87.2%) 17 (12.8%)
Algarve 50 (86.89%) 10(13.11%)
Região Autónoma dos
Açores 76 (87.77%) 11 (12.23%)
Região Autónoma da
Madeira 120 (85.62%) 23 (14.38%)
Education
Level 0-4 years of education 5≥ years of education 1,046 (65.37%) 373 (76.84%) 213 (34.63%) 24 (23.16%) .000
Household income ≤500€ 501€ to 750€ 342 (80.53%) 291 (88.06%) 100 (19.47%) 41 (11.94%) .000 751€ to 1000€ 154 (96.26%) 14 (3.74%) >1000€ 271 (93.22%) 20 (6.78%) Household composition 1 ≥2 1,092 (89.58%) 347 (84.05%) 159 (10.42%) 82(15.95%) .009 BMI Underweight 9 (74.53%) 2 (24.47%) .293 Normal 388 (89.99%) 56 (10.01%) Overweight 620 (89.98%) 86 (10.02%) Obese 284 (86.98%) 53 (13.02%) 7 5,0 5 13 ,1 7 8 ,1 6 3,6 1 N O R M A L M I L D M O D E R A T E S E V E R E W EI G H TE D %
DEPRESSION LEVELS BY HADS-D SCORE
34
Legend: SD – standard deviation; % - weighted percentage; NUTS II - Nomenclatura das Unidades
Territoriais, level II; BMI – Body Mass Index; € - euro; HADS-D – Hospital Anxiety and Depression Scale – Depression subscale. bold: Variables with statistical significance
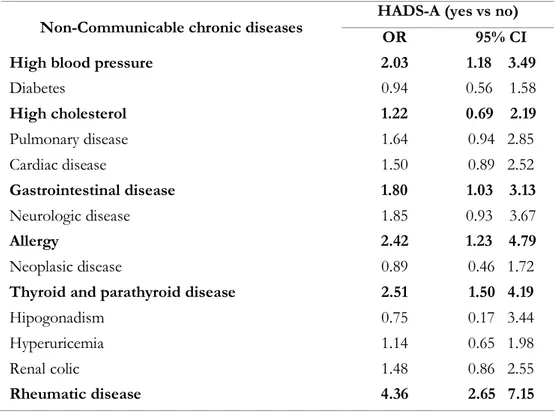
3.2 Anxiety & depression symptoms and non-communicable chronic diseases in the elderly
Regarding anxiety symptoms in Portuguese elderly and their association with self-reported non-communicable chronic diseases, diabetes, pulmonary disease, cardiac disease, neurologic disease, neoplasic disease, hypogonadism, hyperuricemia, and renal colic were not statistically significant in a univariate analysis (Table 6).
Table 6: Association of anxiety symptoms with self-reported non-communicable diseases in Portuguese
elderly
Non-Communicable chronic diseases HADS-A (yes vs no) OR 95% CI
High blood pressure 2.03 1.18 3.49
Diabetes 0.94 0.56 1.58 High cholesterol 1.22 0.69 2.19 Pulmonary disease 1.64 0.94 2.85 Cardiac disease 1.50 0.89 2.52 Gastrointestinal disease 1.80 1.03 3.13 Neurologic disease 1.85 0.93 3.67 Allergy 2.42 1.23 4.79 Neoplasic disease 0.89 0.46 1.72
Thyroid and parathyroid disease 2.51 1.50 4.19
Hipogonadism 0.75 0.17 3.44
Hyperuricemia 1.14 0.65 1.98
Renal colic 1.48 0.86 2.55
Rheumatic disease 4.36 2.65 7.15
Legend: HADS-A: Hospital Anxiety and Depression Scale – Anxiety subscale; OR: Odds Ratio; CI:
Confidence interval¸ bold: Variables with statistical significance
The multivariable analysis using the previous significantly associated self-reported non-communicable chronic diseases with anxiety symptoms, showed that only high blood pressure
35
(OR=1.72, 95% CI 1.05, 2.80) and rheumatic disease (OR=2.70, 95% CI 1.63, 4.71) remained statistically significant.
After adjusting for sociodemographic characteristics (sex, age, region, education level, and household income), only rheumatic diseases (OR=2.58, 95% CI 1.44, 4.61) remained significantly associated with anxiety symptoms.
Considering depressive symptoms and their association with non-communicable chronic diseases, the non-adjusted analysis showed depression symptoms had a significant association with diabetes, high cholesterol, pulmonary disease, cardiac disease, gastrointestinal disease, neurologic disease, thyroid and parathyroid disease, hyperuricemia, and rheumatic disease (Table 7).
Table 7: Association of depression symptoms with self-reported non-communicable diseases in
Portuguese elderly
Non-Communicable chronic diseases HADS-D (yes vs no) OR 95% CI
High blood pressure 1.35 0.95 1.92
Diabetes 1.50 1.02 2.21 High cholesterol 1.53 1.09 2.14 Pulmonary disease 1.71 1.07 2.73 Cardiac disease 1.83 1.27 2.64 Gastrointestinal disease 1.56 1.07 2.27 Neurologic disease 1.97 1.06 3.63 Allergy 1.07 0.73 1.57 Neoplasic disease 1.12 0.65 1.94
Thyroid and parathyroid disease 2.01 1.31 3.08
Hipogonadism 1.64 0.53 5.10
Hyperuricemia 1.74 1.14 2.65
Renal colic 1.41 0.90 2.21
Rheumatic disease 2.94 2.04 4.23
Legend: HADS-D: Hospital Anxiety and Depression Scale – Depression subscale; OR: Odds Ratio; CI:
36
The multivariable analysis using the previous significantly associated non-communicable chronic diseases with depressive symptoms, showed that only cardiac (OR=1.65, 95% CI 1.10, 2.49) and rheumatic diseases (OR=2.12, 95% CI 1.41, 3.20) remained statistically significant.
When adjusted to sex, age group, education level, region, household income, rheumatic disease was the one chronic disease conserving significant association with depressive symptoms (OR=2.21, 95% CI 1.35, 3.60).
3.3 Anxiety & depression symptoms and Lifestyles in the elderly
To understand lifestyles, data was collected on smoking habits, alcohol intake, physical exercise and sleep habits as described previously.
Smoke
Regarding smoking habits, none of the groups (“never smoked”, “past” and “current” smoker) presented a significant relationship with the presence of anxiety or depressive symptoms, after adjusting for sociodemographic variables (sex, age group, region, education level, and household income).
Alcohol intake
Regarding alcohol intake and anxiety, first logistic regression without adjustments for sociodemographic characteristics presented significant association between “daily” (OR=0.36, 95% CI 0.20, 0.62), when compared to “never” consuming alcohol beverages, and anxiety symptoms, suggesting daily intake was associated with lower levels of anxiety in the elderly. This was not observed in the comparison to “occasionally” intake.
The logistic regression adjusted to sex, education level, region, and income, exposed no significant association between any kind of alcohol intake and anxiety.
With respect to depressive symptoms, multivariable analysis for alcohol intake categories (“never”, “occasionally”, “daily”) revealed significant associations to depressive symptoms. However, when adjusted to sociodemographic features, only “never” consumes alcohol holds the statistical significance (OR=0.027, 95% CI 1.08, 0.76) suggesting that never consuming alcoholic beverages was associated with higher levels of depression in the elderly.
37 Physical exercise
Regular physical exercise wasn’t significantly associated with anxiety symptoms (OR=1.17, 95% CI 0.65, 2.10) but was relevant regarding depressive symptoms (OR=0.48, 95% CI 0.34, 0.69) in univariate logistic regression. When adjusted to sex, education level, region and household income, in a multivarible analysis, “regular exercise – yes” keeps significant association with depressive symptoms (OR=0.61, 95% CI 0.39, 0.95), indicating that doing physical exercise was associated with less depressive symptoms in this population.
Sleep
Univariate analysis demonstrated negative significant association between sleep ≥6 hours/day and anxiety (OR=0.31, 95% CI 0.195, 0.58) and depressive symptoms (OR=0.52, 95% CI 0. 32, 0.85). This significant relation (p=0.02) with anxiety was unaltered after multivariable analyses adjusting for sociodemographic variables (sex, education level, region, and household income) maintaining that sleeping less than 6 hours/day was associated with the presence of anxiety in the elderly. However, the association between sleep and depressive symptoms lost significance after multivariable analyses adjusting for sociodemographic variables (OR=0.65, 95% CI 0.36, 1.17).
3.4 Anxiety & depression symptoms and Function in the elderly
Univariate analyses show that function, measured by HAQ, is closely related (p=0.00) to anxiety (OR=3.37, 95% CI 2.67, 4.26) and depressive symptoms (OR=3.63, 95% CI 2.83, 4.66).
Logistic regressions adjusted to sociodemographic features, underlined the close relationship (p=0.00) between lower function and presence of anxiety (OR=3.86, 95% CI 1.66, 5.60) as well as depressive symptoms (OR=3.62, 95% CI 2.69, 4.88).
3.5 Anxiety & depression symptoms and quality of life in the elderly
In terms of quality of life (EQ-5D-3L score), and its association with anxiety and depression, univariate analyses demonstrated OR= 0.02 (CI 0.01, 0.48) and OR= 0.02 (CI 0.01, 0.04), respectively.
38
Multivariable analyses adjusting to sex, educational level, region, household income sustained a very significant association (p=0.00) between poor quality of life (EQ5D score) and anxiety (OR=0.02, 95% CI 0.01, 0.07) and depressive symptoms (OR=0.02, 95% CI 0.01, 0.05).
Deepening our observation over the several domains of quality of life, we found anxiety symptoms were associated to worse scores in “usual activities” (OR= 1.68; 95% CI 1.01, 2.80), “anxiety/depression” (OR=1.63, 95% CI 1.13, 2.35), and “global perception of health” (OR= 0.97, 95% CI 0.96, 0.98).
Regarding depressive symptoms, “usual activities” (OR= 1.72; 95% CI 1.02, 2.88) and “global perception of health” (OR= 0.96; 95% CI 0.95, 0.98) were also relevant.
3.6 Anxiety & depression symptoms and healthcare resources consumption in the elderly
Regarding hospitalizations in the previous 12 months, univariate analyses showed statically significant differences between elderly with and without anxiety (OR=2.18, 95% CI 1.14, 4.16) but not in elderly with depressive symptoms (OR=1.27, 95% CI 0.86, 1.87).
Logistic regression adjusted to sociodemographic features, stressed that having anxiety symptoms was associated with hospitalization in the previous 12 months (OR=3.27, 95% CI 1.81, 5.9,
p=0.00).
In terms of number of medical appointments in the previous 12 months, there is no significant differences between elderly with and without anxiety (OR=1.05, 95% CI 0,98, 1.11) or depressive symptoms (OR=1.00, 95% CI 0.98, 1,02).
3.7 Anxiety and Depression in the elderly - Global Models Anxiety
Multivariable logistic regression, including all previous significant independent variables, as well as sociodemographic characteristics showed that worse quality of life (EQ5D: OR=0.06, 95% CI 0.01, 0.60), being a man (OR=0.33, 95% CI 0.11, 0.96), and 75 years old or older (OR=0.40, 95%
39
CI 0.16, 1) were significantly associated with anxiety symptoms (Table 8). On the other hand, looking at anxiety score as a continuous variable, the multivariable linear regression revealed that worse function (HAQ: β= 0.62, p=0.04), and worse quality of life (EQ5D: β= -2.97, p=0.00) were associated with more anxiety symptoms. Sleep 6 or more hours/day (β=-0.78, p=0.02), being a man (β=-0.89, p= 0.00), 75 years old or more (β=-1.25, p= 0.00), and have a higher level of education (β=-0.97, p= 0.01) were associated with less anxiety (Table 8).
Table 8: Global model for anxiety symptoms – a comparison between logistic and linear regression
HADS-A (yes/no) HADS-A score
Multivariable logistic regression Multivariable linear regression
OR 95% IC p-value β coef 95% IC p-value
High blood pressure Rheumatic disease HAQ score 0.62 0.02 1.21 0.042 EQ5D score 0.06 0.01 0.60 0.017 -2.97 -4.35 -1.60 0.000 Sleep (≥ 6hours/day) -0.78 -1.41 -0.14 0.017 Hospitalization (yes) Sex (male) 0.33 0.11 0.96 0.043 -0.89 -1.40 -0.37 0.001
Age goup 70-74 y.o. -1.04 -1.69 -0.39 0.002
≥ 75 y.o. 0.40 0.16 1.00 0.050 -1.25 -1.92 -0.58 0.000 NUTS II Centro Lisboa Alentejo Algarve -- -- -- Azores Madeira Level of education ≥5 years -0.97 -1.69 -0.25 0.008 Household income 501€ to 750€ 751€ to 1.000€ >1.000€
Legend: HADS-A: Hospital Anxiety and Depression Scale – Anxiety subscale; OR: Odds Ratio; CI:
Confidence interval; HAQ: Health Assessment Scale (0-3); EQ5D: European Quality of Life questionnaire five dimensions three levels (0-1); y.o: years old; €: euros; bold: Variables with statistical significance
40 Depression
All previous significant independent variables, as well as sociodemographic characteristics were included in a multivariable logistic regression to depression symptoms. In this analysis, only poor quality of life was associated with depression (EQ5D: OR=0.05, 95% CI 0.01, 0.19) (Table 9). The multivariable linear regression, showed a greater number of significant relations to depression. In this population, worse function (HAQ: β= 1.06, p=0.00), and worse quality of life (EQ5D: β=-3.97, p= 0.00) were associated with more depressive symptoms. The regions of Centro (β=0.93, p= 0.00) and Alentejo (β=0.93, p= 0.05), as well as education level (β=-0.56, p= 0.05), the household income between 751 and 1000€ (β=-1.04, p= 0.01), and living alone (household composition = 1) (β=0.65, p= 0.03) were related with depression.
Table 9: Global model for depression symptoms – a comparison between logistic and linear regression
HADS-D (yes/no) HADS-D score
Multivariate logistic regression Multivariate Linear regression OR 95% IC p-value β coef 95% IC p-value
Rheumatic disease
HAQ score 1.06 0.46 1.66 0.001
EQ5D score 0.05 0.01 0.19 0.000 -3.97 5.10
-2.84 0.000 Regular exercise (yes)
Alcohol
intake “Never” “Daily” Sex (male)
Age goup 70-74 y.o. ≥ 75 y.o. NUTS II Centro 0.93 0.37 1.49 0.001 Lisboa Alentejo 0.93 0.01 1.84 0.048 Algarve Azores Madeira Level of education (≥5 years) -0.56 -1.12 -0.00 0.050 Household income 501€ to 750€ 751€ to 1.000€ -1.04 -1.79 -0.29 0.007 >1.000€ Household composition =1 0.65 0.05 1.25 0.034
Legend: HADS-D: Hospital Anxiety and Depression Scale – Depression subscale; OR: Odds Ratio; CI:
41
questionnaire five dimensions, three levels (0-1); y.o: years old; €: euros; Household composition: number of people that live in the house of the participant, including himself/herself; bold: Variables with statistical significance.