ORIGINAL PAPER
Stereotypy and variation in the claw waving display
of the fiddler crab Uca tangeri
Joana M. Jordão&Ana F. Curto&Rui F. Oliveira
Received: 31 July 2006 / Revised: 7 March 2007 / Accepted: 12 March 2007 / Published online: 6 April 2007
# Springer-Verlag and ISPA 2007
Abstract We measured temporal and spatial components of the waving display in a Uca tangeri population to look for inter-individual differences in male waving structure that may convey information about individual identity. We found evidence that the spatial components of wave structure, especially“Maximum amplitude” are responsible for most of the between-male variation of the display. This variation could reflect differences in individuals’ condition and/or could be used by conspecifics to discriminate amongst familiar and unfamiliar individuals.
Keywords Uca tangeri . Waving structure . Inter-individual variation
Introduction
The structure of animal signals, especially auditory signals, has been examined in a wide range of taxa (e.g. McGregor and Westby 1992; Bee et al. 2001; Amorim et al. 2003; Christie et al.2004; Holland et al. 2004; Rossi-Santos and Podos2006). Differences in signal structure within a species may be related to individual quality (e.g. Christie et al.
2004), social (e.g. Amorim and Almada 2005) or motiva-tional status, ontogenic changes (e.g. Amorim and Hawkins
2005), physiological constraints or even individual identity (i.e. each individual’s signal structure is consistent and unique; e.g. McGregor and Westby 1992). Receivers may
use information about individual identity to discriminate amongst or recognise specific individuals. Such abilities have been reported in several vertebrates such as mammals (Frommolt et al. 2003), birds (Molles and Vehrencamp
2001), reptiles (Osborne 2005) and fish (McGregor and Westby 1992) and are usually thought to be restricted to “higher” taxa because of the necessity of a relatively complex cognitive system capable of perceiving such differ-ences and memorising them long enough for them to be useful in a social context (e.g. mate choice, neighbour or rival recognition, etc.). The few examples of individual discrimination in invertebrates are usually reduced to insects (e.g. Seibt 1973) and mainly refer to chemical cues. Evidence of individual discrimination based on visual cues was until recently restricted to the facial and abdominal markings in the wasp Polistes fuscatus (Tibbetts 2002). However, evidence that other invertebrates are capable of discriminating individuals is beginning to accumulate. Neighbour discrimination has been shown in the Australian fiddler crab Uca mjoebergi where sometimes males form coalitions with neighbours to defend their territory against intruders (Backwell and Jennions 2004). Although the cues used in neighbour discrimination were not identified in the latter study, Detto et al. (2006) showed that the distinct carapace colour patterns in Uca capricornis enable males to discriminate between neighbour and unfamiliar females. Individual discrimination in fiddler crabs has a clear associated fitness advantage for both sexes, at least in the most common fiddler crab mating system, a resource-based polygeny: receptive females would be able to recognise previously sampled males, reducing the costs of the sampling process; males would be able to discriminate between neighbours and intruders, preventing the waste of energy and time in agonistic interactions with already established neighbours.
DO00030; No of Pages 7
Communicated by P. McGregor
J. M. Jordão (*)
:
A. F. Curto:
R. F. Oliveira Unidade de Investigação em Eco-Etologia, ISPA, Rua Jardim do Tabaco, 34,1149-041 Lisbon, Portugal e-mail: [email protected]
Fiddler crabs have several signals in their repertoire, but the one they are renowned for is the very dynamic waving movement, which males perform with their enlarged claw. Waving is used, in most species, in courtship interactions (Crane1967,1975), but the enlarged claw can also be used as a weapon against predators and conspecifics in agonistic contexts (e.g. Crane1975; Levinton and Judge1993). Two distinct forms of waving have been described for most species: high-intensity waving and low-intensity waving. Low-intensity waving consists of the rhythmic movement of the major claw, it is not directed to any individual in particular, and it is seen as a signal to potential receivers from a distance (Pope 2005). High-intensity waving involves further visual components: the minor cheliped— feeding claw—can perform a circular movement, similar to the major claw waving (von Hagen1962; Crane1975), and the body usually moves up and down along with the major claw movement (Crane1975). This type of waving is only triggered by searching females that pass near the male’s burrow (von Hagen 1962). Both wave types are usually performed within a series—a bout—of several waves (Crane1957,1975).
The waving pattern is species-specific (Salmon and Atsaides1968; Doherty1982; von Hagen1983) and seems to be a behavioural barrier causing reproductive isolation (Salmon and Hyatt1983). In several species of the genus Uca, females are able to discriminate between conspecific and heterospecific males based on the waving display and reject courtship from the latter (Zucker and Denny1979).
Being such a conspicuous visual signal, waving has been widely studied by several authors (e.g. Altvogt1957; Crane
1957, 1958; Salmon and Stout 1962; von Hagen 1962,
1983, 1993; Salmon and Atsaides 1968; Backwell et al.
1998; Oliveira and Custódio1998; Latruffe et al.1999), but only a few have analysed waving structure in detail. For example, Hyatt (1977) found an ontogenic progression of the waving design (for both its temporal and spatial components) in Uca pugilator, suggesting that it could convey information regarding the sexual maturity of the displaying male; von Hagen (1993) used similar temporal parameters to compare the unusual female waving display of U. polita to that of conspecific males; and Murai and Backwell (2006) looked for differences between temporal and spatial components of the waving display of“visited by females” and “passed by females” males of U. perplexa.
The first aim of this study was to measure the stereotypy of several temporal and spatial components of the waving display in a Uca tangeri population. In ritualised displays, such as this one, its stereotypy or amount of variance are good indicators of how strongly it has been subjected to selection pressure. A ritualised movement increases the reliability of information, as small differences in the display are more easily perceived against a standard background
(Zahavi 1980). Differences in the coefficients of variation of the different waving components may indicate which components of the waving display are actually conveying information.
A second goal of this study was to look for differences among males in the structure of their waving display. As previously stated, individual discrimination has clear associated fitness benefits for both sexes. Although cara-pace markings have been shown to play the role of “signatures” in other fiddler crab species (Detto et al.
2006), U. tangeri, among others, is not as colourful and does not possess any obvious carapace (or other body part) markings. The possibility exists that waving, being such a conspicuous signal and used in a variety of social contexts, may be playing this role.
Materials and methods Collection of images
Thirty-two mature waving U. tangeri males were filmed during the mating season in June 1995 at Quinta do Marim, Ria Formosa Nature Park in the South Coast of Portugal (Algarve). We used a Sony Handycam TR 850 high 8 mm to film at 24 frames per second (fps). All images were collected under similar temperature and tidal conditions (from 45 min before to 1.5 h after the peak of a neap tide). The subjects were recorded from a full frontal plane and at ground level to avoid the geometric error when taking spatial measurements. Other crabs were free to approach the focal males.
The focal males were not captured after video recording, but their burrow diameter was measured with Vernier callipers (±0.1 mm). Given the high correlation between burrow opening diameter and crab carapace width and length (Lourenço et al. 2000), burrow diameter gives a good estimation of crab size.
The 8-mm films were later copied to VHS format, and a time-code was inserted with an AEC-BOX-8/18/28 LTC/ VITC generators adder to increase precision when ana-lysing temporal variables of the waving display. The video analysis took place from September 1997 to July 1998. Quantification of spatial and temporal variables
Based on previous studies of spatio-temporal components of waving (Hyatt 1977), four temporal and two spatial components of the waving display were measured (see Table1). The same components were used to analyse both the high- and low-intensity waving movements of the major claw. We have also measured the complete wave duration of both movements. Throughout all the statistical analysis,
the temporal components were expressed as a percentage of the “Complete waving movement” to minimise eventual differences on account of temperature or motivational status.
For angle measurements, we used the deviation between the distal tip of the claw and the vertical axis that passes between the eye stalks. To evaluate the subject’s elevation during the movement, we used the deviation between the distal tip of the claw and the horizontal line at ground level (Fig.1).
Temporal data was directly recorded using the video analysis Observer PC Software V3.0 (Noldus Information Technology, Wageningen, The Netherlands), with a 0.01-s precision, while the spatial data was recorded with the aid of the image processing software Image Tool (University of Texas Health Science Center San Antonio, San Antonio, TX, USA).“Maximum amplitude” was measured in pixels and then converted into“claw unit” values (distance from tip of claw to ground in pixels/claw length in pixels) for a uniformisation of the measure as the crabs were filmed at different distances.
The waves from each subject were selected depending on image quality and plane of view. Each subject was only filmed once, so all the waves were produced within the same low-tide period. In the case of temporal components, we have selected 24 subjects for analysis of low-intensity waving (10 waves from each subject except two subjects with 11 waves) and 23 subjects (10 waves from each subject except one subject with 9 waves and one subject with 11 waves) for analysis of high-intensity waving. In the case of spatial components, also depending on image quality and plane of view, we have selected 15 subjects (between two and ten waves from each subject) for the analysis of low-intensity waving and 16 subjects (between two and ten waves from each subject) for analysis of high-intensity waving. We have not distinguished between waving bouts, and the waves sample for each crab consists of waves from the same and/or from different wave bouts.
Results
Stereotypy of the waving display
We determined the within-male (CVw) and between-male (CVb) coefficients of variation for each temporal and spatial component of the waving display. The CVbwere based on a general mean and standard deviation obtained from the mean for each male. Most subcomponents of both low- and high-intensity waving have relatively high CVw and CVb (Table 2).
Between-male variation
We performed a one-way analysis of variance (ANOVA) to the collected temporal and spatial data to determine whether
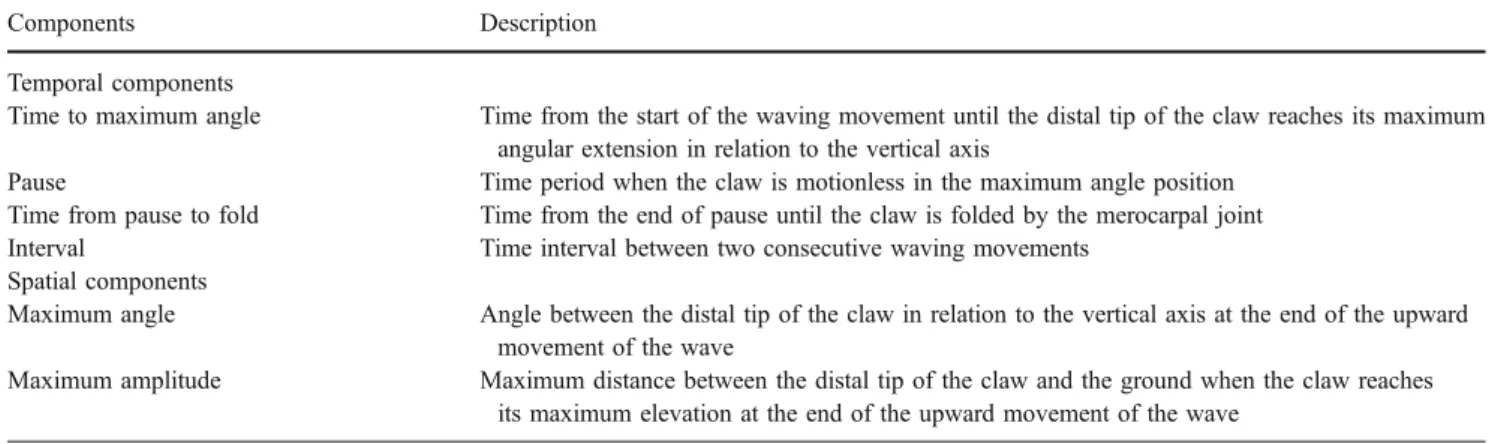
Fig. 1 Method used to measure the spatial components of wave structure. Maximum amplitude (distance from claw tip to ground level) was afterwards expressed relative to claw length (see text) Table 1 Selected spatio-temporal components of the waving display
Components Description
Temporal components
Time to maximum angle Time from the start of the waving movement until the distal tip of the claw reaches its maximum angular extension in relation to the vertical axis
Pause Time period when the claw is motionless in the maximum angle position
Time from pause to fold Time from the end of pause until the claw is folded by the merocarpal joint
Interval Time interval between two consecutive waving movements
Spatial components
Maximum angle Angle between the distal tip of the claw in relation to the vertical axis at the end of the upward movement of the wave
Maximum amplitude Maximum distance between the distal tip of the claw and the ground when the claw reaches its maximum elevation at the end of the upward movement of the wave
waving properties varied significantly more between than within males. We did not use the original raw variables because they could not be considered independent. All temporal components were transformed into a smaller number of uncorrelated variables using a principal compo-nents analysis (PCA). We did not incorporate the“Complete wave duration” variable in this analysis, as it incorporated all the variance found in the other temporal components.
The low-intensity waving temporal components were reduced to two principal components with eigenvalues greater than one, which explain approximately 67.4% of the variance on the original data (PC1, 42.3%; PC2, 25.1%; Table3); the high-intensity waving temporal variables were also reduced to two principal components with eigenvalues grater than one accounting for 69.18% of variance in the original variables (PC1, 43.78%; PC2, 25.40%; Table4).
A subsequent one-way ANOVA using the PCA factor scores as input variables shows overall significant differences between individuals for both intensities of waving (low-intensity waving, N=24, PC1, F(218,23)=8.53, p<0.00; PC2, F(218,23)=4.15, p<0.00; high-intensity waving, N=23, PC1, F(207,22)=10.86, p<0.00; PC2, F(207,22)=1.75, p<0.02).
A one-way ANOVA for the spatial components also shows overall significant differences between individuals for both“Maximum angle” and “Maximum amplitude” in low-and high-intensity waving (low-intensity waving, maximum angle, N=15, F(102,14)=10.14, p<0.00, maximum amplitude, N= 15, F(105,14)= 36.12, p < 0.00; high-intensity waving,
maximum angle, N=16, F(77,15)=5.30, p<0.00, maximum amplitude, N=16, F(77,15)=42.48, p<0.00).
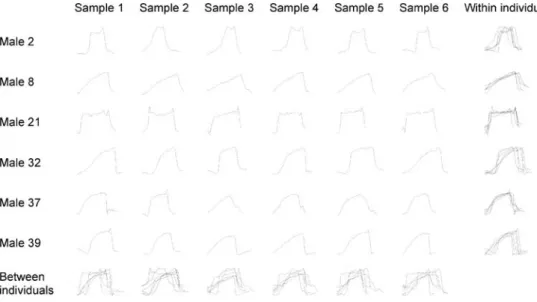
Individual distinctiveness Qualitative analysis
Graphical representations of the complete angle sequence of six low and six high intensity waves, from six different subjects, show that individuals seem to differ qualitatively in their waving design: We have superimposed the graphs for the same individual and for different individuals (Tables 5 and6) as done in McGregor and Westby (1992) for electric organ discharges’ waveforms of a weakly electric fish. This shows that the overlap of waving design of the six different individuals is much smaller that that of six different waving movements from the same individual. Quantitative analysis
To analyse these qualitatively apparent between-individual differences in a quantitative way, we have performed a discriminant function analysis (DFA) on the values of the temporal and spatial components of waving. We have excluded from this analysis all waves for which we did not measure all parameters, and all males for which we had a sample size of less than six waves. Our sample sizes for the DFA were thus 12 males for low-intensity waving (between
Table 3 Factor loadings from a principal components analysis of the four temporal subcomponents of low-intensity waving
Temporal subcomponent Factor
PC1 PC2
Time to maximum angle (%) −0.86 0.30
Interval (%) −0.33 −0.39
Pause (%) −0.25 −0.86
Time from end of pause to fold (%) 0.88 −0.11
Figures in italics indicate the heaviest factor loadings.
Table 4 Factor loadings from a principal components analysis of the four temporal subcomponents of high intensity waving
Temporal subcomponent Factor
PC1 PC2
Time to maximum angle (%) −0.83 0.19
Interval (%) 0.08 0.99
Pause (%) −0.79 −0.05
Time from end of pause to fold (%) −0.65 −0.06
Figures in italics indicate the heaviest factor loadings. Table 2 Between- and within-male coefficients of variation for the different waving components of both low- and high-intensity waving
Time to maximum angle (%)
Pause (%) Time from end of pause to fold (%) Interval (%) Maximum angle Maximum amplitude Complete wave duration Low-intensity waving CVb 15.19 20.99 33.69 58.86 29.86 22.52 17.46 CVw (average) 16.54 32.65 31.33 86.27 26.60 10.70 17.90 CVb/CVw 0.92 0.64 1.08 0.68 1.12 2.12 0.98 High-intensity waving CVb 20.29 31.94 49.82 282.01 24.44 18.86 19.99 CVw (average) 23.76 36.10 60.83 77.21 28.29 7.31 22.13 CVb/CVw 0.85 0.88 0.82 3.65 0.86 2.58 0.90
six and ten waves per male) and 9 males for high-intensity waving (between seven and ten waves per male). The temporal “Interval” component was not inputted in the DFA, given its high CVw value in both low- and high-intensity waving (see Table2). All five waving components were introduced in both models, and the DFA generated five significant discriminant functions (Tables7and 8) for both low- and high-intensity waving. In the low-intensity waving model, three of the discriminant functions had eigenvalues greater than one, which accounted for 91.8% of the variation (see Table 7). These first two discriminant functions are highly correlated with the spatial components of waving. The first discriminant function was highly correlated with “Maximum amplitude” values, the second with“Maximum angle” values and the third with the time it
took the claw to reach maximum angle. In the high-intensity waving model, two of the discriminant functions had eigenvalues greater than 1 and accounted for 93.6% of the variation (see Table 8). Again, the first discriminant function is highly correlated with the spatial component “Maximum amplitude”. On total, the DFA successfully assigned 68.87% of the low-intensity waves (60.4% after validation of the model) and 80% (64% after cross-validation of the model) of the high-intensity waves to the correct individual. Individually, only 2 out of 12 males did not have significantly more low-intensity waves correctly assigned by the DFA than the a priori probabilities of correct classification expected by chance (one-sided differ-ence between two proportions, p range from 0.0003 to 0.0490); the same is true for only one out of nine males,
Table 5 Six complete angle sequences of the major claw during low-intensity waves of six individuals displayed as angle, in degrees, between the distal tip of the claw in relation to the vertical axis (y-axis) and time, in number of frames of film (x-axis)
Table 6 Six complete angle sequences of the major claw during high intensity waves of six individuals displayed as angle, in degrees, between the distal tip of the claw in relation to the vertical axis (y-axis) and time, in number of frames of film (x-axis)
regarding high-intensity waves (one-sided difference be-tween two proportions, p range from 0.0011 to 0.0178).
Discussion
Most of the within-male stereotypy values of the measured waving components fall between 16 and 35%. This is slightly higher than the CV values of the spatio-temporal units of U. pugilator, reported by Hyatt (1977), which range from 5 to 20%. But the “Complete wave duration” values are similar, although slightly lower, to the range of values for complete wave duration of other fiddler crab species (Hazlett 1972 in Hyatt1977). An exception is the low within-male variance in “Maximum amplitude” (on average 7.31 and 10.70% for the high- and low-intensity waving, respectively) and specially its relatively high CVb/ CVwratio (2.12 for low-intensity waving and 2.58 for high-intensity waving).
As we have sampled each male waving for a relatively short period of time (a few hours during a low tide period), it may be argued that males may show a high degree of stereotypy over short-time periods, but that they may differ markedly from 1 day to the other for a number of reasons such as social context, motivational status or environmental differences. Unfortunately, sampling the same individual over a period of several days that would reliably capture the
full range of variation would prove impossible in the field. However, examination of Tables5 and6 seems to indicate that the structures of low- and high-intensity waves are similar. As a control for this observation, we have correlated “Maximum amplitude” values of low- and high-intensity waves for the same male and found a significant high correlation (Pearson correlation, N=13, r = 0.87, p = <0.001). Considering that high- and low-intensity waves are surely produced at different times and under different social contexts argues against this highly within-male variability depending on time and conditions.
The level of stereotypy of “Maximum amplitude”, the relative vertical distance from the tip of the major claw to the ground, does suggests that it is probably the measured waving component that has been more strongly subjected to selection and, therefore, the best candidate to convey relevant information. Fiddler crabs are particularly good at seeing vertical objects that disrupt their visual horizon line, where vertical-resolving power is enhanced (Land and Layne 1995; Zeil and Al-Mutairi1996). There are several examples of female preference for vertical objects through-out the literature. For example, U. tangeri females approach model males with a claw in the vertical position more often then they approach model males with a resting (horizontal) claw (Oliveira and Custódio 1998), and courting Uca musica females approach hoods that advertise male burrows (Christy et al. 2002). In this context, male crabs will
Table 7 Pooled within-groups correlations between wave components and standardized canonical discriminant functions, for low-intensity waving
Wave component Function
1 2 3 4 5
Maximum amplitude 0.943 0.178 −0.248 −0.018 −0.132
Maximum angle 0.199 −0.758 0.279 0.539 0.132
Time from end of Pause to Fold (%) 0.079 0.556 −0.405 0.689 0.213
Time to Maximum angle (%) 0.026 0.050 0.938 −0.323 0.114
Pause (%) −0.009 −0.078 −0.165 −0.609 0.772
Eigenvalue 7.017 1.562 1.106 0.501 0.367
Cumulative proportion of variance explained 66.5 81.3 91.8 96.5 100.0
Table 8 Pooled within-groups correlations between wave components and standardized canonical discriminant functions, for high-intensity waving
Wave component Canonical root
1 2 3 4 5
Maximum amplitude 0.947 0.107 −0.243 −0.183 0.014
Maximum angle 0.138 −0.517 0.632 −0.481 −0.288
Time from end of Pause to Fold (%) 0.035 0.529 0.544 0.606 −0.235
Time to Maximum angle (%) 0.023 0.514 0.514 −0.546 0.416
Pause (%) 0.060 −0.023 0.413 0.062 0.906
Eigenvalue 12.330 1.296 0.737 0.170 0.021
probably be more successful in attracting females if they can raise their claw differentially in a way that their own claw would stand out from that of other males. Murai and Backwell (2006) found that U. perplexa females select males that raise their major claw higher and for longer, suggesting that wave structure has evolved through female choice.
The ANOVA results indicate that there is significantly more between-male variations than within male variations, and the results of the discriminant function analyses also support this view. The percentage of correct assignments of wavings to individual males is significantly higher than random assignment, suggesting that individual distinctiveness in waving may be present in this species. These classification functions can also be used as a diagnostic tool, identifying which waving components contribute the most to between-male differences. It seems clear from the analysis of Tables7
and8that the spatial components of waving are accounting for more inter-individual differences than the temporal ones. These differences may be due to specific individual constraints, such as claw weight and size, strength and condition of each crab or, on the other hand, they could be signalling individuality. Either way, spatial components seem to be the more information-relevant features of waving. The frequency and other temporal aspects of the waving display are usually temperature dependent (Doherty 1982) and therefore susceptible to conditions other than the individual. The fact that in some fiddler crab species (Backwell et al.
1998) neighbouring males synchronise their waving is another example of how the temporal features of waving are subjected to the surrounding environment (in this case, social context). Temporal components thus lack the consis-tency and stereotypy needed for the identification of a distinct individual signal.
Other reasons may be suggested as a possible source of between-male variability. Hyatt (1977) found an ontogenic progression in the waving structure of male U. pugilator. We cannot, however, pin our results to ontogenic differ-ences, as our sample consisted only of adult size males. Waving structure is also different depending on social context in some species. Males may have different wave types that are used differentially in agonistic or courting situations (M. How, unpublished data). In the case of U. tangeri, the well-described low- and high-intensity waving are easily visually identified and are performed in different contexts, as described in“Introduction”. These have been
treated separately throughout our study. We cannot discard the possibility that more subtle differences, depending on conspecifics proximity or activity, may be present within each of these wave types and that, in case they exist, may be responsible for the between-male variation that we have found. This, however, is not likely. Such fine differences would only be picked up by a more detailed analysis, such
as motion analysis software (see Peters et al.2002) and not by the traditional ethological approach used in this study.
In summary, we suggest that the analysed spatial features of waving, especially“Maximum amplitude”, are responsi-ble for most of the between-male variation on waving display. This is either a reflection of different individual condition or an indication of individual distinctiveness of the signal mainly based on its spatial components. Further studies should use a more comprehensive approach to the study of this dynamic visual signal (Peters et al.2002), and the next step would be to relate variation with female preference or individual recognition.
Acknowledgements We are very grateful to Patricia Backwell for providing valuable comments and to Ricardo Romão for his work in Fig.1. We thank Ria Formosa Nature Park, Portugal, for permission to work in their protected area. During this study J.M.J was supported by a fellowship from the Portuguese Foundation for Science and Technology (FCT) (BD/19835/99). R.F.O.’s research is supported by FCT’s Pluriannual Program (R&D Unit 331/94). The procedures used in this study comply with the current laws of Portugal.
References
Altvogt R (1957) Untersuchungen zur Biologie, Ökologie und Physiologie Indischer Winkerkrabben. Z Morphol Okol Tiere 46:1–110
Amorim MCP, Almada VC (2005) The outcome of male-male encounters affects subsequent sound production during courtship in the cichlid fish Oreochromis mossambicus. Anim Behav 69:595–601
Amorim MCP, Hawkins AD (2005) Ontogeny of acoustic and feeding behaviour in the grey gurnard, Eutrigla gurnardus. Ethology 111:255–269
Amorim MCP, Fonseca PJ, Almada VC (2003) Sound production during courtship and spawning of Oreochromis mossambicus: male– female and male–male interactions. J Fish Biol 62:658–672 Backwell PRY, Jennions MD (2004) Coalition among male fiddler
crabs. Nature 430:417
Backwell P, Jennions M, Passmore N, Christy J (1998) Synchronized courtship in fiddler crabs. Nature 391:31–32
Bee MA, Kozich CE, Blackwell KJ, Gerhardt HC (2001) Individual variation in advertisement calls of territorial male green frogs, Rana clamitans: implications for individual discrimination. Ethology 107:65–84
Christie PJ, Mennill DJ, Ratcliffe LM (2004) Pitch shifts and song structure indicate male quality in the dawn chorus of black-capped chickadees. Behav Ecol Sociobiol 55:341–348
Christy JH, Backwell PRY, Goshima S, Kreuter TJ (2002) Sexual selection for structure building by courting male fiddler crabs: An experimental study of behavioral mechanisms. Behav Ecol 12:366–374 Crane J (1957) Basic patterns of display in fiddler crabs (Ocypodidae,
Genus Uca). Zoologica 42:69–82
Crane J (1958) Aspects of social behaviour in fiddler crabs, with special reference to Uca maracoani (Latreille). Zoologica 43:113–130 Crane J (1967) Combat and its ritualization in fiddler crabs (Ocypodidae)
with special reference to Uca rapax. Zoologica 52:49–76 Crane J (1975) Fiddler crabs of the world. Princeton University Press,
Detto T, Backwell P, Hemmi J, Zeil J (2006) Visually mediated species and neighbour recognition in fiddler crabs (Uca mjoebergi and Uca capricornis). Proc R Soc Lond B Biol Sci 273:1661–1666 Doherty JA (1982) Stereotypy and the effects of temperature on some
spatio-temporal subcomponents of the“courtship wave” in the fiddler crabs Uca minax (Le Conte) and Uca pugnax (Smith) (Brachyura, Ocypodidae). Anim Behav 30:352–363
Frommolt K, Goltsman ME, MacDonald DW (2003) Barking foxes, Alopex lagopus: field experiments in individual recognition in a territorial animal. Anim Behav 65:509–518
Holland RA, Waters DA, Rayner JM (2004) Echolocation signal structure in the Megachiropteran bat Rousettus aegyptiacus Geoffroy 1810. J Exp Biol 207:4361–4369
Hyatt GW (1977) Quantitative analysis of size-dependent variation in the fiddler crab wave display (Uca pugilator, Brachyura, Ocypodidae). Mar Behav Physiol 5:19–36
Land M, Layne JE (1995) The visual control of behaviour in fiddler crabs I. Resolution, thresholds and the role of the horizon. J Comp Physiol 177A:81–90
Latruffe C, McGregor PK, Oliveira RF (1999) Visual signalling and sexual selection in male fiddler crabs Uca tangeri. Mar Ecol Prog Ser 189:233–240
Levinton JS, Judge ML (1993) The relationship of closing force to body size for the major claw of Uca pugnax (Decapoda: Ocypodidae). Funct Ecol 7:339–345
Lourenço R, Paula J, Henriques M (2000) Estimating the size of Uca tangeri (Crustacea: Ocypodidae) without massive crab capture. Sci Mar 64:437–439
McGregor PK, Westby GWM (1992) Discrimination of individually characteristic electric organ discharges by a weakly electric fish. Anim Behav 43:977–986
Molles LE, Vehrencamp SL (2001) Neighbour recognition by resident males in the banded wren, Thryothorus pleurostictus, a tropical songbird with high song type sharing. Anim Behav 61:119–127 Murai M, Backwell PRY (2006) A conspicuous courtship signal in the
fiddler crab Uca perplexa: female choice based on signal size. Behav Ecol Sociobiol 60:736–741
Oliveira RF, Custódio MR (1998) Claw size, waving display and female choice in the European fiddler crab, Uca tangeri. Ethol Ecol Evol 10:241–251
Osborne L (2005) Rival recognition in the territorial tawny dragon (Ctenophorus decresii). Acta Ethol 8:45–50
Peters RA, Clifford CWG, Evans CS (2002) Measuring the structure of dynamic visual signals. Anim Behav 64:131–146
Pope DS (2005) Waving in a crowd: fiddler crabs signal in networks. In: McGregor PK (ed) Animal communication networks. Cam-bridge University Press, CamCam-bridge, pp 252–276
Rossi-Santos MR, Podos J (2006) Latitudinal variation in whistle structure of the estuarine dolphin Sotalia guianensis. Behaviour 143:347–364
Salmon M, Stout JF (1962) Sexual discrimination and sound production in Uca pugilator Bosc. Zoologica 47:15–20 Salmon M, Atsaides SP (1968) Visual and acoustical signalling
during courtship by fiddler crabs (Genus Uca). Am Zool 8:623–639
Salmon M, Hyatt GW (1983) Communication. In: Vernberg J, Vernberg W (eds) The biology of Crustacea, vol 7. Academic Press, New York
Seibt U (1973) Sense of smell and pair-bond in Hymenocera picta Dana. Micronesica 9:231–236
Tibbetts EA (2002) Visual signals of individual identity in the wasp Polistes fuscatus. Proc R Lond Soc B Biol Sci 269:1423–1428 von Hagen H-O (1962) Freilandstudien zur sexual und
fortplans-zungsbiologie von Uca tangeri in Andalusien. Z Morphol Okol Tiere 51:611–725
von Hagen H-O (1983) Visual and acoustic display in Uca mordax and U. burgersi, sibling species of neotropical fiddler crabs. I. Waving display. Behaviour 83:229–250
von Hagen H-O (1993) Waving display in females of Uca polita and other Australian fiddler crabs. Ethology 93:3–20
Zahavi A (1980) Ritualization and the evolution of movement signals. Behaviour 72:77–81
Zeil J, Al-Mutairi MM (1996) The variation of resolution and of ommatidial dimensions in the compound eyes of the fiddler crab Uca lactea annulipes (Ocypodidae, Brachyura, Decapoda). J Exp Biol 199:1569–1577
Zucker N, Denny R (1979) Interspecific communication in fiddler crabs: Preliminary report of a female rejection display directed toward courting heterospecific males. Z Tierpsychol 50:9–17