Spectral variability in high frequency in sea level and atmospheric pressure
on Buenos Aires Coast, Argentina
Iael Perez*, Dragani Walter
Servicio de Hidrografía Naval/CONICET
(Av. Montes de Oca 2124 (C1270ABV) Ciudad Autónoma de Buenos Aires, Argentina)
*Corresponding author: [email protected]
http://dx.doi.org/10.1590/S1679-87592017130506501
There are some observational evidences which
support that atmospheric gravity waves constitute
an efficient forcing for meteorological tsunamis
(meteotsunamis) along the coast of Buenos Aires,
Argentina. Meteotsunamis and atmospheric
gra-vity waves, which propagate simultaneously on
the sea surface and the atmosphere, respectively,
are typical examples of non-stationary
geophysi-cal signals. The variability of meteotsunamis and
atmospheric gravity waves recorded at Mar del
Plata was investigated in this paper. Results
obtai-ned in this work reinforce the idea of a cause
(at-mospheric gravity waves) effect (meteotsunami)
relationship, because wavelet spectra obtained
from both signals resulted quite similar.
Howe-ver, several very short episodes of mod-erate/low
activity of atmospheric gravity waves were
de-tected without detecting meteotsunami activity.
On the other hand, it was found that atmospheric
gravity wave spectral energy can appear in the
wavelets as a single or multiple burst as
relati-vely long and irregular events or as regular wave
packets. Results obtained in this paper provide
original spectral data about atmospheric gravity
waves along the coast of Buenos Aires. This
in-formation is useful to be included in realistic
nu-merical models in order to investigate the genesis
of this complex atmosphere-ocean interaction.
A
bstrAct
Descriptors:
Meteorological tsunamis; Atmospheric
gravity waves; Spectral variability; Wavelet analysis;
Buenos Aires coast.
Existem evidências observacionais que apoiam a ideia
de que as ondas de gravidade atmosféricas são um
for-çante eiciente para os tsunamis meteorológicos (me
-teotsunamis) na região da costa da província de Buenos
Aires, Argentina. Os meteotsunamis e as ondas de
gravi-dade atmosférica que se propagam simultaneamente na
superfície do mar e na atmosfera, respectivamente, são
exemplos típicos de sinais geofísicos não estacionários.
Neste trabalho investiga-se a variabilidade de
meteot-sunamis e de ondas de gravidade atmosférica medidas
em Mar del Plata. Os resultados obtidos mostram que
os ondeletas para os meteotsunamis e as ondas de
gra-vidade são relativamente semelhantes. Isso reforça a
ideia da relação causa (ondas de gravidade atmosférica)
efeito (meteotsunamis) entre ambos. No entanto, vários
episódios muito curtos de moderada a baixa atividade de
ondas de gravidade atmosféricas foram detectados sem
detectar atividade meteotsunami. Por outro lado,
encon-trou-se que a energia espectral das ondas de gravidade
atmosférica pode aparecer nos ondeletas como uma
sim-ples ou múltipla irrupção, como eventos irregulares
rela-tivamente longos, ou como pacotes de ondas regulares.
Os resultados obtidos neste trabalho proporcionam
in-formação espectral sobre as ondas de gravidade
atmos-férica na região costeira da província de Buenos Aires.
Esta informação poderia ser útil para incluí-la em
mo-delos numéricos realistas, com o objetivo de investigar a
gênese desta complexa interação oceano-atmosfera.
r
esumo
Descritores:
Tsunamis meteorológicos; Ondas de
gravidade atmosféricas; Variabilidade espectral;
Ondeletas; Costa de Buenos Aires.
INTRODUCTION
Meteorological tsunamis (meteotsunamis) are produced by atmospheric processes (atmospheric gravity waves, pressure jumps, squalls or frontal passage), and they are regularly observed at the same sites with pronounced local resonant properties. They are produced by the resonant superposition of internal factors (pronounced resonant properties of a speciic bay or coastal areas) and external factors (strong atmospheric disturbance resonantly interacting with open-ocean waves). The necessary coincidence of several resonant factors signiicantly diminishes the possibility for such events to occur, which is the main reason why these phenomena are rare and restricted to speciic locations (MONSERRAT et al., 2006). Meteotsunamis, with periods varying from a few minutes to almost 3 h and heights typically lower than 1 m, have been frequently observed in diferent tide stations between Mar de Ajo and Quequén on the southeastern coast of South America (Figure 1). INMAN et al. (1961) were the irst who obtained the power spectra for meteotsunamis for a 10-day-interval of sea level records for tide gauge stations located at Mar del Plata and Quequén. Subsequently, DRAGANI et al. (2002) showed that the main spectral peaks of these waves covered almost the whole frequency band between 1 and 5 cycles per hour
(cph) during energetic events. Signiicant coherence values estimated between Mar de Ajó and Mar del Plata (172 km apart, Figure 1) clearly showed that meteorological tsunamis at the Buenos Aires Province inner continental shelf can be seen as a regional phenomenon. In addition, maximum amplitudes detected for each event at Mar de Ajó, Pinamar, Mar del Plata and Quequén are very similar (DRAGANI et al., 2009).
Regarding the origin of meteotsunamis BALAY (1955) was the irst that report these long ocean waves at Buenos Aires Province coastal waters were associated with the passage of meteorological cold fronts coming from central Patagonia. Subsequently, DRAGANI (1997) described the typical synoptic situation during the occurrence of meteorological tsunamis at coastal waters of the Buenos Aires Province. Low-level atmospheric cyclonic circulation and the passage of atmospheric fronts were always present prior to and during these events. Upper air soundings obtained at Bahia Blanca meteorological station (Figure 1) showed a lower pronounced tropospheric inversion that depicts an example of the state of the atmosphere when a frontal surface lies overhead. This tropospheric inversion constitutes an optimal interface for the propagation of high-amplitude atmospheric gravity waves (NUÑEZ et al, 1998). Based on the occurrence of
simultaneous atmospheric gravity waves and long ocean wave events, similarities of the spectral structures of both waving phenomena and the high efectiveness in the atmospheric-ocean energetic transference (DRAGANI, 2007), it was concluded that atmospheric gravity waves are the most probable forcing mechanism able to generate long ocean waves (meteorological tsunamis) on the Buenos Aires Province inner continental shelf.
Meteotsunamis and atmospheric gravity waves, which propagate simultaneously on the sea surface and the tropospheric inversion respectively, are typical examples of non-stationary geophysical signals. Both of them were described by DRAGANI et al. (2002) implementing classic spectral analysis techniques (JENKINS; WATTS, 1969; BÅTH, 1974). However, power spectrums have shown not to be the most appropriate method to retrieve the sequence of the sea level and pressure oscillations during these events. In this sense, wavelet analysis is one of the more appropriate spectral analysis techniques to describe the variability of non-stationary sea level and atmospheric pressure data series. Wavelet transforms are used to analyze time series that contain non-stationary power at many diferent frequencies (TORRENCE; CAMPO, 1998). Wavelet analysis maintains time and frequency localization in a signal analysis by decomposing or transforming a one-dimensional time series into a difuse two-dimensional time-frequency image simultaneously.
The aim of this work is to investigate the temporal variability of meteotsunamis and atmospheric gravity waves recorded at Mar del Plata using wavelet analysis technique. Meteotsunamis and atmospheric gravity waves are highly non-stationary and both signals are very noticeable in high resolution sea level and atmospheric pressure data series. There are enough evidences to support the theory that atmospheric gravity waves constitute an eicient forcing for meteotsunamis (DRAGANI, 2007). In this sense, wavelet analysis for the irst available data series of simultaneous high resolution atmospheric pressure and sea level data series gathered at Buenos Aires coast is presented and discussed in this paper.
MATERIAL AND METHODS
Digital sea level records collected every 5 min at Mar del Plata tidal station located at the isher’s pier (38° 0’ 2’’ S, 57° 32’ 18’’ W) were available for this work. The tidal station is located in an open coastal area where the mean depth is approximately 2.5 m. Sea levels (tide, storm surge
and meteotsunami) were measured by a loat tide gauge with a Sutron SD0001 shaft encoder, with a precision lower than ±0.003 m. The system is mounted inside a vertical tube with a little water entrance located at the lower part of it to ilter high frequency oscillations caused by wind waves (periods of several seconds). Measurements present a few gaps but, generally, the record is quite complete.
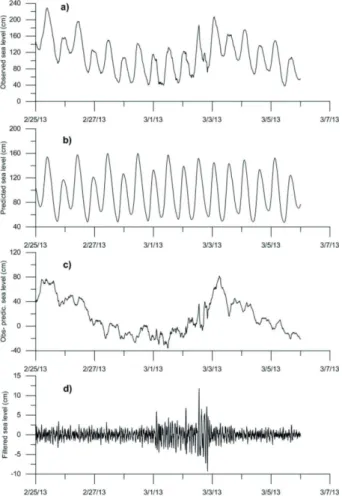
A selected sea level data series (from February 25 to March 6, 2013) is presented in Figure 2 to illustrate the diferent signals involved in these records. Observed sea level data (Figure 2.a) contain mixed mainly semi-diurnal tides (Figure 2.b), low-frequency perturbations associated with storm surges (Figure 2.c) and high-frequency oscillations (ranging from a few minutes to almost 3 h) related to meteorological tsunamis (Figure 2.d). Following to DRAGANI et al. (2014), data series (residuals) containing storm surges and meteorological tsunamis were obtained subtracting the tide from the observed sea levels. Next, residual sea levels were convoluted by using a 251-weight Hamming high pass ilter (HAMMING, 1977), with cutof frequency equal to 0.5 cph, in order to obtain the high-frequency signal (Figure 2.d). A detailed statistical analysis for the whole sea level data series, which includes the beginning date, maximum height, maximum sea level and duration of detected meteorological tsunami and storm surge event was presented by DRAGANI et al. (2014).
Figure 2. (a) Sea level data observed at Mar del Plata, (b) mixed mainly semi-diurnal tides, (c) low-frequency perturbations associated with storm surges and (d) high-frequency oscillations, ranging from a few minutes to almost 3 h, related to meteorological tsunamis.
data series were corrected from the inverse barometric efect, this is an increase (decrease) in barometric pressure of 1 hPa corresponds to a fall (raise) in sea level of, approximately, 0.01 m (WILSON, 1972). It was proved that this correction does not produce signiicant modiications on iltered sea level data series. Then, the wavelets computed from non-corrected and corrected sea level data series resulted practically identical.
RESULTS
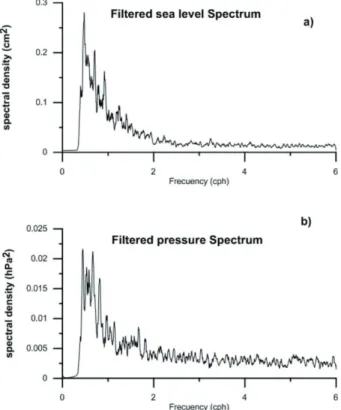
Power spectra from iltered sea level (Figure 2.d) and atmospheric pressure (Figure 3b) are presented in Figure 4. The meteotsunami spectrum (Figure 4.a) shows the highest energetic peak placed at 0.47 cph (2.1 h), and secondary spectral peaks at 0.70 and 0.92 cph (1.4 and 1.08 h). Several weaker spectral peaks are located from 1 cph to higher frequencies. The atmospheric gravity wave
Figure 3. (a) Atmospheric pressure observed at Mar del Plata and (b) high-frequency oscillations, ranging from a few minutes to almost 3 h, related to atmospheric gravity waves.
Figure 4. Filtered (a) sea level and (b) atmospheric pressure spectra obtained from data series presented en Fig. 2 and 3, respectively.
both states are not usually considered or described. For this speciic subject, wavelet analysis is considered as one of the more appropriate spectral analysis techniques to describe the variability of non-stationary data series.
Three relatively long data series (~1 month) of simultaneous sea level and atmospheric pressure data series were selected to analyze the activity of meteotsunamis
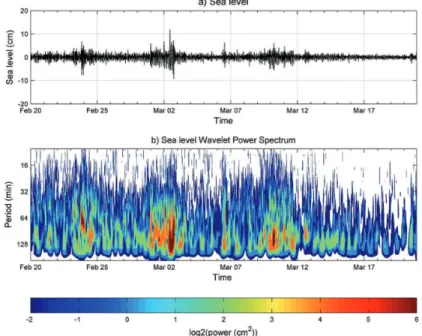
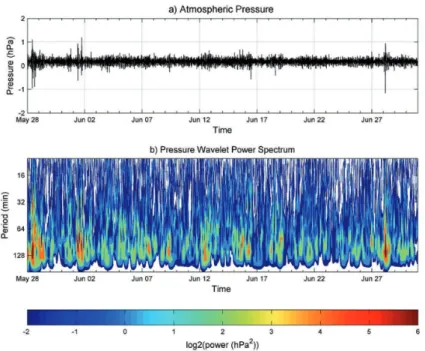
a short episode located around February 24, with higher spectral peaks located at periods of 50-80 min, can be observed. After that, a longer period of irregular and high activity (between March 1 and March 4) is clearly manifested. Spectral energy gradually increases, in March 1-2 spectral energy is broadly distributed between 50 and 160 min and, subsequently, a noticeable reduction of the energy can be appreciated. Finally, a relatively longer event of moderate and irregular activity (from March 6 to 13) is observed in Figure 5.b. Spectral energy is irregularly distributed between 30 and 150 min. The atmospheric pressure wavelet power spectrum (Figure 6) also shows three active lapses which occur simultaneously to the sea level events, with spectral characteristics very similar to the described before, for the irst selected period.
The sea level wavelet power spectrum (Figure 7) for the second selected period (from March 23 to April 30, 2013) shows two meteotsunamis events. The irst one takes place between March 25 and 27, spectral energy is broadly distributed between almost 30 and 135 min, approximately. A period of relative calm is presented in the middle part of this event, from March 25th 18:00 to
March 26th 12:00. This temporal variability in the spectral
power is very common in this kind of phenomenon. Subsequently, a short energetic lapse can be observed on April 6-7, where sea level heights (distance between
Figure 5. (a) First selected sea level data series, from February 20 to March 21, 2013 and (b) wavelet spectrum
trough to crest) of almost 0.30 m can be observed (Figure 5.a). In contraposition, the atmospheric pressure wavelet power spectrum for this period (Figure 8) shows not only activity for the above described lapses but also several very short episodes of moderate or low activity of atmospheric gravity waves which do not impact on the sea level.
The sea level wavelet power spectrum (Figure 9) for the third selected period (from May 28 to June 30, 2013) presents irregular activity of meteotsunamis from May 28 to June 19 at 12:00. Spectral energy can be seen unevenly distributed between 40 and 150 min and energetic lapses are alternated by short periods of calm. After June 20 the meteotsunami activity signiicantly decreases. The atmospheric pressure wavelet power spectrum (Figure 10) presents spectral characteristics very similar to the before described for the sea level. It can be seen that atmospheric gravity waves activity is clearly also intermittent.
Figure 6. (a) First selected atmospheric pressure data series, from February 20 to March 21, 2013 and (b) wavelet spectrum
Figure 7. (a) Second selected sea level data series, from March 23 to April30, 2013 and (b) wavelet spectrum.
multiple bursts, as relatively long and irregular events or as regular wave packets but always with associated spectral energy distributed from 20 min to almost 3 h. Periods of calm of variable length, characterized by relative low energy levels, are usually present between energetic events. The spectral structure and the temporal
Figure 8. (a) Second selected atmospheric pressure data series, from March 23 to April 30, 2013 and (b) wavelet spectrum.
Figure 9. (a) Third selected sea level data series, from May 28 to June 30, 2013 and (b) wavelet spectrum.
of the forcing (for example, direction and speed of the cold front or amplitude and celerity of the atmospheric gravity waves) could be the explanation of the spectral diferences. An appropriate inference of these atmospheric parameters would be crucial to implement realistic pressure patterns of atmospheric gravity waves to simulate meteorological
tsunamis by using of numerical models (DRAGANI, 2007). In this sense, results obtained in this paper give new information about the spectral structure of the atmospheric gravity waves at Buenos Aires coastal area.
Figure 10. (a) Third selected atmospheric pressure data series, from May 28 to June 30, 2013 and (b) wavelet spectrum.
of the world. For instance, VILIBIĆ and MIHANOVIĆ (2003) studied resonant oscillations in the Split harbor (Adriatic Sea) implementing wavelet spectra. Theyfound that large amount of energy is placed both on air and sea pressure data series. Nevertheless, it was found that the peak connected with sea-level oscillations is somehow wider in time (almost three times). The spectral evolution showed that the sea-level energy rise together with the air pressure energy. THOMSON et al. (2009) analyzed in details events of 13 July 2007 and 26 February 2008 in the North America west coast. Analysis of coincident 1-min sea level data and high frequency atmospheric pressure data conirms that the events originated with atmospheric pressure jumps and trains of atmospheric gravity waves with amplitudes of 1.5–3 hPa. PELLIKKA et al. (2014) analyzed four case studies of exceptional wave events of meteorological origin, observed on the Finnish coast in the summers of 2010 and 2011. They used high-resolution sea-level measurements and conirmed that the sea level oscillations coincide with sudden jumps in surface air pressure at coastal observation stations, related to the passage of squall lines or gust fronts. These fronts propagate above the sea at a resonant speed, allowing eicient energy transfer between the atmospheric disturbance and the sea wave that it generates. ŠEPIĆ et al. (2015) studied atmosphere induced long ocean waves in the Mediterranean and Black Seas generated by high-altitude atmospheric forcing by using spectral wavelet analysis.
They analyzed simultaneous pairs of 3-h cut-of, high-pass iltered time series of air pressure and sea level recorded at coastal locations on the Balearic Islands (Spain), in the Adriatic Sea (Croatia), and in Sicily (Italy). ŠEPIĆ et al. (2015) showed that the passage of pronounced atmospheric disturbances is roughly concurrent with the onset of strong sea level oscillations. In addition they reported that although the linkages between enhanced sea level oscillations and intensiied atmospheric disturbances are highly non-linear, the time series are clearly indicative of a cause and efect relationship. Recently, ŠEPIĆ et al. (2016) examined a two-day period of remarkable meteotsunami activity in the Adriatic Sea. To examine temporal variations of the observed water-level and air pressure oscillations in the frequency domain they used a multiple-ilter method (DZIENOWSKI et al., 1969), which is similar to wavelet analysis. They concluded that meteotsunamis occurring at various parts of the coast were generated by diferent atmospheric air pressure disturbances and that the sea surface response was strongly dependent on details of atmospheric forcing.
(atmospheric gravity waves) and efect (meteotsunami) relationship. Even though atmospheric gravity wave and meteotsunami wavelet spectra are quite similar (as in time as in frequency), there were several very short episodes of moderate/low activity of atmospheric gravity waves detected which did not produce activity on the sea level. It was suggested that a delicate energy transference mechanism from the atmosphere to the ocean could play a signiicant role to explain some of the identiied diferences between sea level and atmospheric pressure wavelets spectra. This particular topic should be investigated implementing comprehensive numerical simulations with a realistic atmospheric forcing. In this sense, this paper constitute a contribution to the elucidation of this subject because it provides new information about the spectral structure of the atmospheric forcing. The variability in the duration of the atmospheric gravity events was clearly depicted by using of wavelet spectra. It revealed that spectral energy can appear as a single or multiple burst, as relatively long and irregular events or as regular wave packets. It is important to highlight that the measurement of atmospheric pressure every minute is very unusual at the Buenos Aires coast. High resolution barometric data series analyzed in this work are in efect the only atmospheric pressure data series available in this coastal area. Consequently, at the present, the spatial variability of the atmospheric gravity waves cannot be studied by means of direct observations of atmospheric pressure at the Buenos Aires coastal region.
ACKNOWLEDGEMENTS
This paper is a contribution to the CONICET PIP 112-201101-00176 project.
REFERENCES
BALAY, M. La determinación del nivel medio del Mar Argentino,
inluencias de las oscilaciones del mar no causadas por
la marea. Buenos Aires: Ministerio de Marina, Dirección General de Navegación, 1955. 46 p.
BÅTH, M. (Ed). Spectral analysis in geophysics: Developments in Solid Earth Geophysics. vol. 7. Amsterdam: Elsevier Science Publishing, 1974. 579 p.
DRAGANI, W. C. Una explicación del proceso generador de ondas de largo período en la Costa Bonaerense Argentina. 1997. 222f. Thesis (Doctoral) - Facultad de Ciencias Exactas y Naturales, Universidad de Buenos Aires, 1997. http://digital. bl.fcen.uba.ar/Download/Tesis/Tesis_3010_Dragani.pdf
DRAGANI, W. C.; MAZIO, C. A.; NUÑEZ, M. N. Sea level oscillations in coastal waters of the Buenos Aires province, Argentina. Cont. Shelf Res., v. 22, n. 5, p. 779-790, 2002. DRAGANI, W. C. Numerical experiments on the generation
of long ocean waves in coastal waters of the Buenos Aires province, Argentina. Cont. Shelf Res., v. 27, n. 5, p. 699-712, 2007.
DRAGANI, W. C.; D’ONOFRIO, E. E.; GRISMEYER, W.;
FIORE, M. M. E.; CAMPOS, M. I. Atmospherically-induced water oscillations detected in the Port of Quequén, Buenos Aires, Argentina. Phys. Chem. Earth, Parts A/B/C, v. 34, n. 17-18, p. 998-1008, 2009.
DRAGANI, W. C.; D’ONOFRIO, E. E.; OREIRO, F.;
ALONSO, G.; FIORE, M.; GRISMEYER, W. Simultaneous meteorological tsunamis and storm surges at Buenos Aires coast, southeastern South America. Nat. Hazards, v. 74, n. 1, p. 269-280, 2014.
DZIEWONSKI, A., BLOCH, S.; LANDISMAN, M. A technique for the analysis of transient seismic signals. Bull. Seismol. Soc. Am., v. 59, n. 1, p. 427-444, 1969.
HAMMING, R. W. Digital ilters. Dover: Mineola, 1998. INMAN, D.; MUNK, W.; BALAY, M. Spectra of low frequency
ocean waves along the Argentine shelf. Deep Sea Res. (1953), v. 8, n. 3-4, p. 155-164, 1961.
JENKINS, G. M.; WATTS, D. G. Spectral analysis and its applications. San Francisco: Holden-Day, 1969. 164 p.
MONSERRAT, S.; VILIBIĆ, I.; RABINOVICH, A. B.
Meteotsunamis: atmospherically induced destructive ocean waves in the tsunami frequency band. Nat. Hazards Earth Syst. Sci., v. 6, p. 1035-1051, 2006.
NUÑEZ, M. N.; MAZIO, C. A.; DRAGANI, W. C. Estudio espectral de un lapso de intensa actividad de ondas de gravedad atmosféricas registradas en la costa bonaerense argentina. Meteorológica, v. 23, n. 1, p. 47-54, 1998. PELLIKKA, H.; RAUHALA, J.; KAHMA, K. K.; STIPA,
T.; BOMAN, H.; KANGAS, A. Recent observations of meteotsunamis on the Finnish coast. Nat. Hazards, v. 74, n. 1, p. 197-215, 2014.
ŠEPIĆ, J.; MEĐUGORAC, I.; JANEKOVIĆ, I.; DUNIĆ, N.;
VILIBIĆ, I. Multi-Meteotsunami Event in the Adriatic Sea
Generated by Atmospheric Disturbances of 25–26 June 2014.
Pure Appl. Geoph., v. 173, n. 12, p. 4117-4138, 2016.
ŠEPIĆ, J.; VILIBIĆ, I.; RABINOVICH, A. B.; MONSERRAT,
S. Widespread tsunami-like waves of 23-27 June in the Mediterranean and Black Seas generated by high-altitude atmospheric forcing. Sci. Rep., v. 5, 11682, 2015.
THOMSON, R. E.; RABINOVICH, A. B.; FINE, I. V.; SINNOTT, D. C.; MCCARTHY, A.; SUTHERLAND, N. A. S.; NEIL, L. K. Meteorological Tsunamis on the Coasts of British Columbia and Washington. Phys. Chem. Earth, Parts A/B/C, v. 34, n. 17-18, p. 971-988, 2009.
TORRENCE, C.; COMPO, G. P. A practical guide to wavelet analysis. Bull. Am. Meteorol. Soc., v. 79, n. 1, p. 61-78, 1998.
VILIBIĆ, I.; MIHANOVIĆ, H. A study of resonant oscillations in
the Split harbour (Adriatic Sea). Estuar. Coast. Shelf Sci., v. 56, n. 3-4, p. 861-867, 2003.