1
Universidade de Lisboa
Faculdade de Ciências
Departamento de Biologia Vegetal
The role of the ATP synthase in photosynthetic flux control
Nádia Martins
Master Thesis in Celular Biology and Biotechnology
2009
2 This work was done at the Max-Planck-Institute of Molecular Plant Physiology, Potsdam under the supervision of Dr. Mark Aurel Schöttler from October 2008 until July 2009.
1. External Supervisor: Dr. Mark Aurel Schöttler –Max Planck Institute of Plant Physiology, Golm, Potsdam, Germany
2. Internal Supervisor: Dr. Jorge Marques da Silva- Departamento de Biologia Vegetal. Faculdade de Ciências da Universidade de Lisboa
3
“Há um tempo em que é preciso abandonar as roupas usadas, que já têm a forma do nosso corpo, e esquecer os nossos caminhos, que nos levam sempre aos mesmos lugares. É o tempo da travessia: e, se não ousarmos fazê-la, teremos ficado, para sempre, à margem de nós mesmos”
4
Abstract
The role of the ATP synthase in photosynthetic flux control
Higher plants adjust the photosynthetic ATP and NADPH production to the metabolic consumption by the Calvin cycle, as otherwise, an imbalance could result in the generation of reactive oxygen species, ultimately leading to cell death. Three components of the electron transport chain (cytochrome-bf complex, plastocyanin and ATP synthase) are closely adjusted to the metabolic demands (Schöttler et al, 2004; Schöttler et al, 2007). While it is well established that the cytochrome-bf complex exerts photosynthetic flux control, the close adjustment of ATP synthase contents was surprising. In order to determine the impact of altered ATP synthase contents on assimilation capacity, transformants with decreased amounts of ATPase were generated. First, we manipulated the accumulation of the plastome-encoded subunit. Eight different mutations were introduced into the atpB 5’-UTR, as previous in vitro translation assays revealed changes in translation rates to between 10 and 200% of the wild-type level. Surprisingly, none of the transplastomic plants showed clear differences in ATP synthase activity and growth. This could be due to the existence of specific translation initiation factors in planta, which were not considered in the in vitro translation assays. Alternatively, the subunit might not be limiting for ATP synthase biogenesis.
In a second approach, an antisense repression of the nuclear encoded subunit resulted in plants with strongly reduced assimilation and growth rates. This phenotype strictly correlates with the remaining ATP synthase activity, but is not simply attributable to a reduced ATP availability. Rather, ATP synthase repression results in an increased PMF above the thylakoid membrane, triggering ―photosynthetic control‖ already at low light intensities: As plastoquinone reoxidation at the cytochrome-bf complex is inhibited by strong lumen acidification, both ATP and NADPH production by linear electron flux are decreased.
5 Key words: photosynthesis, electron transport, ATP synthase, photosynthetic flux control, proton motive force.
5
Síntese
O papel da ATP sintase no controle do fluxo fotossintético
As plantas superiores ajustam a produção fotossintética de ATP e NADPH ao seu consumo metabólico pelo ciclo de Calvin, já que um desequilíbrio pode resultar na geração de espécies reactivas de oxigénio, levando em última instância à morte celular. Três dos componentes da cadeia transportadora de electrões (complexo citocromo-bf, plastocianina e ATP sintase) ajustam o seu conteúdo às necessidades metabólicas (Schöttler et al, 2004; Schöttler et al, 2007). Embora esteja bem provado que o complexo citocromo-bf exerce controle no fluxo fotossintético, o ajuste do conteúdo da ATP sintase foi surpreendente. De forma a determinar o impacto de alterações no conteúdo da ATP sintase na assimilação, transformantes com quantidades diminuídas de ATP sintase foram gerados. Numa primeira abordagem a acumulação da subunidade da ATP sintase, codificada no cloroplasto, foi manipulada. Oito mutações diferentes foram introduzidas na regiao 5'-UTR do gene atpB, já que ensaios anteriores, feitos in vitro, revelaram alterações nas taxas de tradução entre 10 e 200% em relação ao tipo selvagem. Surpreendentemente nenhuma das plantas transplastómicas mostrou diferenças claras em termos de crescimento e actividade da ATP sintase. Isto poderá dever-se à existência de factores específicos de tradução in planta, que não foram considerados nos ensaios in vitro. Alternativamente, a subunidade pode não ser limitante para a biogénese da ATP sintase em tabaco.
Numa segunda abordagem, uma repressão antisense da subunidade , codificada no núcleo, resultou em plantas com taxas de crescimento e assimilação extremamemente reduzidas. Este fenótipo correlaciona-se com a restante actividade da ATP sintase mas não é unicamente atribuída a uma reduzida disponibilidade de ATP. Aqui a repressão de ATP sintase resulta numa elevada força protomotriz na membrana tilacoidal, desencadeando um controle fotossintético já em situações de fraca luminosidade: Já que a reoxidação da plastoquinona ao nível do complexo citocromo-bf é inibida por uma forte acidificação do lúmen, tanto a produção de ATP como a de NADPH pelo fluxo linear de electrões, decaem.
5 Palavras-chave: fotossíntese, transporte eletrónico, ATP sintase, controle do fluxo fotossintético, força proto motriz.
6
Resumo
O papel da ATP sintase no controle do fluxo fotossintético
As plantas superiores ajustam a produção cloroplastidial de ATP e NADPH ao seu consumo metabólico pelas reacções subsequentes (e.g. ciclo de Calvin), já que, de outra forma, o desequilíbrio gerado poderia resultar na formação de espécies reactivas de oxigénio e, em última instância, em danos oxidativos no aparelho fotossintético e morte celular. Assim sendo, com o aumento da idade foliar e diminuição da fixação de carbono a capacidade da cadeia transportadora de electrões decai proporcionalmente (Schöttler et al, 2004). Este ajustamento é conseguido através de alterações no conteúdo membranar do complexo citocromo-bf, plastocianina e ATP sintase, que diminuem em paralelo com a capacidade assimilatória (Schöttler et al, 2004; Schöttler et al, 2007). O complexo citocromo-bf e a plastocianina já mostraram ser pontos de controlo do fluxo electrónico fotossintético (Price et al, 1998; Schöttler et al, 2004). Assim, a estreita correlação entre o seu conteúdo e a capacidade assimilatória não foi surpreendente. No entanto, o ajustamento adicional da ATP sintase foi algo cuja relevância fisiológica não foi totalmente compreendida (Anderson et al, 1988; Schöttler et al, 2007).
Para resolver esta questão e fazer uma análise mais detalhada do papel da ATP sintase na limitação da fotossíntese, foram geradas plantas com conteúdo reduzido deste complexo proteico. A alteração do conteúdo foi feita através da manipulação da acumulação de duas subunidades do sector catalítico da enzima. Primeiro manipulou-se a acumulação da subunidade , codificada no cloroplasto. A acumulação desta subunidade é controlada ao nível da tradução e especialmente o seu início é altamente regulado. Esta subunidade mostrou ser limitante na montagem da ATP sintase em Chlamydomonas reinhardtii (Drapier et al, 2007). Por esta razão, decidiu-se alterar o início da tradução modificando o sítio de ligação do ribossoma na região 5' não traduzida do mRNA e, também o codão de iniciação da tradução. Oito mutações pontuais diferentes foram introduzidas nesta região, já que ensaios prévios feitos in vitro mostraram alterações nas taxas de tradução que variavam entre 10 % e 200 % em relação ao tipo selvagem. Numa segunda abordagem, utilizou-se um mutante com uma repressão antisense do gene nuclear atpC, que codifica para a subunidade . Esta subunidade tem também um papel central na biogénese da ATP sintase em Chlamydomonas (Drapier et al, 2007).
O objectivo desta tese foi determinar o impacto da alteração do conteúdo da ATP sintase na sua actividade e também na taxa de assimilação e transporte electrónico. Para além disso, a hipótese de que a
7
ATP sintase limita o transporte electrónico fotossíntético e regula a activação dos mecanismos fotoprotectores foi também investigada.
Para atingir este fim utilizaram-se métodos espectroscópicos que permitem medir a actividade da ATP sintase in vivo, através da medição da força protomotriz ao nível da membrana dos tilacóides. Para além disto, determinou-se a capacidade de assimilação e a eficiência quântica de assimilação de dióxido de carbono através de medições de trocas gasosas. A actividade da ATP sintase nestes transformantes foi determinada através de espectroscopia de absorção diferencial. Também se determinou qual a força protomotriz máxima capaz de ser gerada e a sua partição nos componentes químico e eléctrico ( pH e ). Obtiveram-se ainda curvas de resposta à luz da taxa de transporte electrónico fotossintético, do coeficiente de amortecimento não fotoquímico (qN), e do estado redox do lado aceitador do fotossistema II (qL). Outros parâmetros fotoquímicos e.g. Fv/Fm, foram também determinados. Também se mediu,
através de espectroscopia de absorção diferencial, a acumulação dos componentes da cadeia transportadora de electrões (fotossistema II, plastocianina, complexo citocromo-bf e fotossistema I) para verificar se a alteração do conteúdo de ATP sintase afecta a sua acumulação. Finalmente, as curvas de redução do complexo citocromo-bf e do P700, em diferentes intensidades luminosas foram medidas, para verificar se um aumento da força protomotriz e uma mais rápida acidificação do lúmem tilacoidal, em plantas com conteúdo reduzido de ATP sintase, resulta na inibição do transporte eletrónico através de mecanismos de controlo fotossintético (e.g. impedimento da reoxidação do plastoquinol no complexo citocromo-bf). Adicionalmente, mediu-se a acumulação de amido nestes mutantes, para detectar diferenças na quantidade de ATP disponível.
Este conjunto de medições deveria permitir testar a hipótese de que o conteúdo de ATP sintase é um importante ponto de controlo do transporte electrónico fotossintético e que regula o aparecimento de mecanismos fotoprotectores.
Surpreendentemente, nenhuma das linhas com mutaçoes introduzidas no gene atpB, mostrou diferenças significativas em termos de fenótipo e actividade da enzima. Esta ausência de fenótipo deve-se, provavelmente, ao facto da actividade deste complexo não depender exclusivamente do seu conteúdo na membrana, sendo altamente regulada. Estes mutantes revelaram, contudo, um ligeiro aumento da força protomotriz em relação à linha selvagem, em particular uma maior acumulação do seu componente químico, já que este é o responsável pela activação dos mecanismos fotoprotectores. Nestes mutantes a maior acumulação de força protomotriz deve-se à ligeira repressão do fluxo electrónico linear pela ATP sintase e fez com que os mecanismos fotoprotectores fossem iniciados mais rapidamente.
Nestes mutantes a composição da cadeia transportadora de electrões não sofreu alterações. Ambos os fotossistemas mantiveram o seu conteúdo e o fotossistema II não perdeu função. O conteúdo em citocromo-bf e PC também não sofreu alterações significativas.
8
Apesar da ausência dum fenótipo visível e de efeitos fisiológicos significativos, algumas linhas apresentavam uma menor acumulação de amido. Isto revela que havia nestas linhas menor disponibilidade de ATP, o que se deve, provavelmente, a um menor conteúdo de ATP sintase.
Embora quando considerados individualmente os parâmetros fotoquímicos das diversas linhas mutantes não se diferenciem significativamente do tipo selvagem, quando observamos o quadro global é possível detectar, em algumas linhas, comportamentos fisiológicos consistentemente distintos.
De um modo geral, podemos considerar que a redução do conteúdo de ATP sintase ficou aquém da esperada. Isto pode significar que a situação in vitro é distinta da situação in vivo, isto é, que a existencia de factores de iniciação da tradução in planta não foi adequadamente considerada nos ensaios in vitro. Alternativamente, a subunidade pode não ser limitante para a biogénese do complexo ATP sintase em Nicotiana tabacum, ao contrário de Chlamydomonas.
A linha com uma mutação na subunidade originou plantas com taxas de crescimento e assimilação reduzidas. Este fenótipo tem a ver com a restante actividade da enzima, embora não seja unicamente atribuível à reduzida disponibilidade de ATP (Schöttler et al, 2009, sob revisão). Nestes mutantes, a repressão da actividade da ATP sintase faz com que o lúmen tilacoidal fique fortemente acidificado, fazendo com que os mecanismos fotoprotectores, tal como o amortecimento não fotoquímico, sejam espoletados logo em condições de fraca luminosidade. Enquanto que a acumulação dos outros componentes da cadeia fotossintética se mantém basicamente inalterada, o fluxo linear de electrões é fortemente reprimido devido a um controlo fotossintético, isto é, à inibição da reoxidação da plastoquinona ao nível do citocromo-bf. E como a reoxidação da plastoquinona ao nível do complexo-bf é inibida pela forte acidificação do lúmen, tanto a produção de ATP como a de NADPH, pela cadeia transportadora de electrões, diminuiem. Assim, concluí-se que a limitação de ATP resulta numa reduzida conductividade da membrana tilacoidal, aumentando assim a força protomotriz, reprimindo o crescimento da planta, devido a uma inibição do fluxo electrónico linear e ao aumento da dissipação da energia na forma de calor nas antenas.
9
Index
1. Introduction ... 11
1.1 ATP synthase ... 12
1.1.1 Structure of the ATPase complex ... 13
1.1.2 Functioning mechanism of ATPase ... 15
1.1.3 Assembly of ATP synthase ... 16
1.1.4 Regulation of ATP synthase ... 17
1.1.5 Role of ATP synthase ... 20
1.2 Objective ... 21
2. Material and methods... 22
2.1 Plant material and growth conditions ... 22
2.2 Constructs ... 22
2.3 Thylakoid membrane isolation ... 23
2.4 Quantification of photosynthetic complexes ... 23
2.4.1 Quantification of PSII and Cytochrome-b6f complex ... 23
2.4.2 Quantification of P700 ... 25
2.4.3 Quantification of PC/P700 ... 25
2.5 P700 and PC reduction kinetics ... 26
2.6 77K fluorescence measurement ... 26
2.7 Fluorescence measurement ... 26
2.8 PMF measurements and ATP synthase activity ... 27
2.9 Gas exchange measurements ... 28
2.10 Metabolite quantification... 29
2.10.1 Ethanol extraction of soluble sugars ... 29
2.10.2 Starch extraction ... 29 2.10.3 Metabolite quantification ... 30 3. Results ... 32 3.1 Growth phenotype ... 32 3.2 Chlorophyll content ... 33 3.3 ATPase activity ... 34 3.4 Assimilation capacity ... 35
3.5 Assimilation capacity versus membrane conductivity ... 36
3.6 Organization of the electron transport chain ... 37
10
3.8 77K chlorophyll-a fluorescence emission spectra ... 39
3.9 PMF partitioning ... 40
3.10 Light response curves ... 41
3.11 Reduction kinetics of Cytochrome-f and P700 ... 43
3.12 Metabolite quantification... 44 4. Discussion ... 46 5. Outlook ... 53 6. Abbreviations ... 54 7. Literature ... 56 8. Acknowledgments ... 60
11
1. Introduction
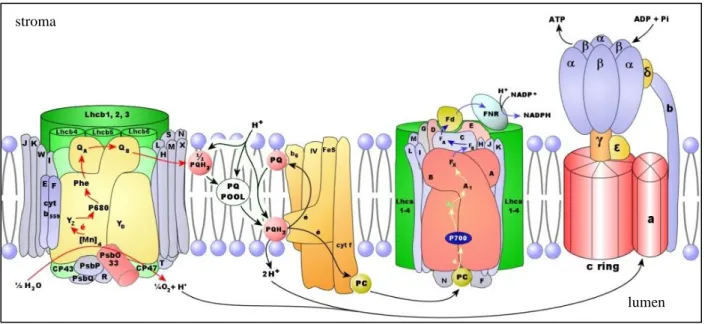
Oxygenic photosynthesis is a highly regulated energy-transducing process. In photosynthetic eukaryotes it takes place in the chloroplast, in which light energy is captured and converted into biochemical energy. This multi-step process involves a series of electron transfer reactions resulting from water oxidation, at the PSII (Photosystem II) lumen side, to NADP+ on the stromal side of PSI (Photosystem I) (Figure 1).
This energy conversion involves the absorption of photons by antenna pigments in the light harvesting complexes (LHC’s), which then transfer the excitation energy to the reaction centers of PSII and PSI, driving the primary photochemical reactions and creating charge separation (Baker et al, 2007). The light-driven charge separation, at the photosystems, is responsible for the electron flow between PSII and PSI through plastoquinol (PQ), cytochrome-b6f complex (Cyt-b6f) and plastocyanin (PC) (Szabó et al, 2005; Baker et al, 2007). Coupled to this linear electron flux (LEF) is the release of protons during water oxidation at the lumen side of PSII, and the influx of protons into the thylakoid lumen due to the Q-cycle at the cyt-b6f. These events allow the establishment of an electrochemical potential difference, or proton motive force (PMF), across the thylakoid membrane, composed of both electric field (∆Ψ) and concentration (∆pH) gradients, which is used by ATP synthase (ATPase), to transport protons back into the stroma, driving ATP synthesis from ADP and Pi (Baker et al, 2007). The products from this photosynthetic electron transport chain (ETC), ATP and NADPH, are subsequently consumed by metabolic reactions, like the Calvin cycle and photorespiration (Baker et al, 2007).
This energy conversion has to meet the demands for ATP and NADPH of the downstream metabolic processes, including not only the reduction of CO2 to the level of sugar phosphates in
the Calvin cycle, but also photorespiration, nitrogen assimilation, etc, each with a different relative requirement for ATP and NADPH (Avenson et al, 2005; Noctor and Foyer, 2000). These metabolic reactions must be regulated to prevent the build-up of reactive oxygen species (ROS), which in sufficiently high concentrations can lead to photoinhibition (photodamage), or even kill the plant (Kim et al, 2008). Taking this into account, it is clear that the capacity of the photosynthetic light reactions to provide ATP and NADPH needs to be closely adjusted to their metabolic consumption (Kim et al, 2008; Schöttler et al, 2004). The photosynthetic apparatus is sufficiently dynamic and able to respond to environmental changes, allowing the plant to adapt.
12 Although it is well established that the cytochrome-bf complex and PC catalyse the rate-limiting steps of photosynthetic electron flux (Anderson, 1992; Kirchhoff et al, 2000; Schöttler et al, 2004), until now the role of ATPase in controlling assimilation rates remains elusive. In spite of this, it is known that the ATPase contents closely correlate with assimilation capacities, e.g. after changes in light quantity/quality and during leaf aging (Anderson et al, 1988; Schöttler et al, 2007).
Figure 1-Composition of the thylakoid membrane and linear electron transport. From Joly and Carpentier
2004.
1.1 ATP synthase
The chloroplast ATPase is a protein complex, located within the chloroplast thylakoid membranes, which synthesizes ATP from ADP and inorganic phosphate (Pi) through a PMF formed by the photosynthetic electron transport (Hisabori et al, 2002). This enzyme belongs to a large family of F0F1 type ATPases and shares a common structure with the ATPases from
mitochondria and bacteria (Evron et al, 2000).
lumen stroma
13
1.1.1 Structure of the ATPase complex
The general structure and composition of the complex is highly conserved among different organisms as observed both in primary sequences of their subunits and their functional characteristics. In the chloroplast it consists of two sectors: CF1 and CF0 (Ni et al, 2005;
Strotmann et al, 1998). The CF1 moiety is water soluble and extrinsic to the membrane, facing
the stromal side, and contains the nucleotide-binding and catalytic sites for ATP synthesis. The CF0 is a transmembranal hydrophobic sector that includes a channel for the proton translocation
through the thylakoid membrane, which drives ATP synthesis (Hisabori et al, 2002; Ni et al, 2005). The CF1 sector consists of five different subunits with a stoichiometry 1 and the
CF0 sector is composed of a1b1b’1c14 (Del Riego et al, 2006; Richter et al, 2005).
The structure and subunit arrangement in CF1 and CF0 have been determined by various
techniques (Groth and Strotmann, 1999). The overall shape, dimension and mass distribution of CF1 was determined by electron microscopy and image analysis (Boekema and Böttcher, 1992).
It was concluded that the CF1 sector is a hexagonal symmetrical ring, consisting of alternating
and subunits with the central cavity of the hexamer being partially filled by the subunit (Groth and Strotmann, 1999) (Figure 2). Furthermore, electron microscopy studies in subunit-deficient CF1 mutants showed that this subunit is necessary to maintain the arrangement of the
central core (Akey et al, 1983).Also, the location and orientation of nucleotide binding sites and regulatory sites in CF1 have been identified by photolabelling and fluorescence resonance energy
transfer and showed that these sites are located on each of the six interfaces (Groth and Pohl, 2001).
Until now, no atomic resolution of CF1 or individual subunits has been obtained; hence most
detailed structural information about this complex comes from the high resolution structure of the bovine mitochondrial ATPase (Abrahams et al, 1994). However, a similar structure may be expected for CF1 due to the homology of subunits between different organisms (Groth and
Strotmann, 1999).
The transmembrane CF0 sector, which mediates proton translocation, consists of four different
subunits in a stoichiometry of a1b1b’1c14 (Hisabori et al, 2002). Low resolution structures giving
the shape, the dimensions and the relative arrangement of the subunits in the CF0 sector have
14 involved in transmembrane proton transport. Subunit b which can be crosslinked to subunit (Beckers et al, 1992) and subunit b’ are likely to form a link between CF0 and CF1 (Groth and
Strotmann, 1999). Secondary structure prediction assumes transmembrane -helical structures for subunits a, b, b’ and c. Subunit b and b’ probably contain a single transmembrane helix leaving an extensive polar region exposed to the chloroplast stroma. Subunit a is a very hydrophobic protein, predicted to contain at least five transmembrane helices and almost no extramembrane domains. Subunit c consists of two antiparallel transmembrane helices connected by an extramembrane polar loop. Topological studies obtained by atomic force microscopy, suggest that the c subunit forms a ring-shaped complex in the membrane, whereas subunits b, b’ and a are located outside the subunit c oligomer (Neff et al, 1997) (Figure 2).
The prevailing model for the structural organization of the CF0F1 complex is shown in Figure 2.
Subunits δ, b and b’ form together a stalk which binds CF1 toCF0. This stalk is considered to
hold the α, β and a subunits still while the γ, ε and c subunits rotate. The ε subunit, and part of the γ subunit, together form a second, central stalk connected to the ring of c subunits. There are six nucleotide binding sites, one at each of the αβ subunit interfaces about halfway along the vertical axis of the hexamer. Three of the sites are located primarily on the β subunits and are catalytic, the other three are noncatalytic and probably regulatory (Groth and Pohl, 2001).
Figure 2- Schematic representation of ATP synthase and its subunits. In green tones are the subunits of the CF1
sector and in red tones are the subunits of the CF0 sector. In light green and red are the nucleus encoded subunits and in dark green and red are the chloroplast encoded subunits. Modified from Groth and Strotmann, 1999.
aa
a c
b b‘
15
1.1.2 Functioning mechanism of ATPase
The prevailing catalytic mechanism is known as the binding change mechanism and was suggested by Paul Boyer (Boyer, 1993). In this mechanism three catalytic sites are thought to interact cooperatively, alternating between tight binding, loose binding and unbound states during one catalytic cycle. In ATP synthesis, the energy of the PMF is used to elicit structural changes that cause the tight site to release ATP and become an open site. Coupled to this event, the loose site that contains bound ADP and Pi becomes a tight site and the open site that was unoccupied binds ADP and Pi to become a loose site (Figure 3). In a larger scale we have the rotational catalysis mechanism which proposes that the c subunit oligomers of the ATPase rotate together with the and subunits as protons flow through CF0. This rotation distributes the
asymmetrical interactions among the subunits and the subunit, allowing the catalytic sites to switch their properties (McCarty et al, 2000). On rotation of the γ subunit, the conformations of the three β subunits change sequentially such that each β subunit successively adopts the different conformations of varying affinity during one rotational cycle. As a result, three molecules of ATP are synthesized during a full conformational cycle of CF1. In synthesis mode,
the F0 motor converts the electrochemical gradient of protons into torque, to force the F1 motor
to act as an ATP generator. In the hydrolysis mode, F1 converts the chemical energy of ATP
hydrolysis into a torque, causing the membrane-embedded F0 motor to act as an ion pump
(Dimroth et al, 2006).
Figure 3-The binding change mechanism of the ATPase. Three sites interact cooperatively to alternate between
tight (T), loose (L), and open (O) states. The energy (indicated by an asterisk) required for the synthesis of ATP is used for both substrate binding and product release. From McCarty et al, 2000.
16
1.1.3 Assembly of ATP synthase
In contrast with the major subunits of PSI, PSII and cytochrome bc/b6f complexes which are integral membrane proteins, the catalytic sector of the proton ATPase, F1, is made of extrinsic
subunits that assemble in a hydrophilic environment (Abrahams et al, 1994). The other sector, F0, which behaves as a selective proton channel, is embedded in the membrane and assembles
within the lipid bilayer (Deckers-Hebestreit and Altendorf, 1996). One of the special characteristics of the ATPase biogenesis is the requirement for an uneven stoichiometry between subunits in both F1 and F0. In F1, 3 copies of the and subunits assemble with only one copy
of the , and subunits, whereas 14 copies of subunit c assemble with 1 copy of subunits a, b and b’ in F0 (Drapier et al, 2007). It is not known if CF0 and CF1 assemble independently or in a
coordinated way. In chloroplasts, both CF0 and CF1 biogenesis requires the assembly of both
nucleus and chloroplast-encoded subunits (Drapier et al, 2007; Rimbault, 2000). The CF0
subunits a, b’ and c are chloroplast-encoded, but b is nucleus-encoded. CF1 subunits , and
are expressed from the chloroplast genes atpA, atpB and atpE, respectively, while subunits and are expressed from the nuclear genes atpC and atpD (Strotmann et al, 1998) (Figure 2). The nucleus encoded subunits are expressed as soluble precursor proteins that are imported post-translationally into the chloroplast with their transit sequences being cleaved before they assemble into the enzyme complex (Strotmann et al, 1998). The chloroplast encoded subunits and have been shown to be translated by thylakoid associated polysomes in land plants and Chlamydomonas reinhardtii (Strotmann et al, 1998).
Defects in the expression of any of the subunits leads to a pleiotropic loss of most polypeptides, both from CF1 or CF0 (Lemaire and Wollman, 1989). Studies also suggested a tight coupling
between the rates of synthesis of several subunits. In the absence of one subunit, the synthesis of all other subunits is reduced and the complex remains unassembled; the unassembled subunits are prone to degradation (Drapier et al, 1992; Lemaire and Wollman, 1989). Recently it was reported that subunit activates the synthesis of its assembly partner, subunit in Chlamydomonas. For sustained translation of subunit , the nuclear encoded g subunit is required. This Control by Epistasy of Synthesis (CES) process comprises intertwining transactivation and negative feedback loops that ensure the production of oligomers in the
17 proper stoichiometry, required for their interaction with subunit . The final 3 3 stoichiometry
is required for the functional assembly of CF1 (Drapier et al, 2007).
So far the complete assembly of ATPase is not yet fully understood: It is not known if the first step is the formation of the 3 3 complex with subsequent binding of and subunits and later
assembly with the already formed CF0 in the membrane; or if otherwise there is binding of and
subunits to the CF0 and later binding of the 3 3 complex to the stalk (Drapier et al, 2007;
Strotmann et al, 1998). One thing is certain: The biogenesis of the chloroplast ATPase requires tight control mechanisms, which regulate both the stoichiometry of the subunits and the cross talk between two distinct genetic compartments (Lemaire and Wollman, 1989; Drapier et al, 2007), ensuring the coordinated biogenesis of the complex.
1.1.4 Regulation of ATP synthase
Since ATP synthesis is a key reaction for the maintenance of a number of metabolic pathways, the ATPase must be prone to several regulatory mechanisms, in order to modulate its activity accordingly with the environmental changes (Konno et al, 2006). In the light, the enzyme complex is activated in order to achieve a high capacity of ATP synthesis, whereas in the dark, it is converted to an inactive state, thereby preventing the dissipative cleavage of stromal ATP (Wu et al, 2007). To optimize photosynthetic productivity, particularly at limiting light availability, it is necessary to balance and control light harvesting and the consumption of reducing power and ATP in metabolic reactions. Therefore there must be a tight regulation between efficient energy absorption and energy conversion, to avoid over reduction and damage of the cell (Oelze et al, 2008). In plant cells, there are at least 4 elements involved in the regulation of the chloroplast ATPase: nucleotide binding and release to the catalytic and regulatory sites; thiol modulation; proton transmembrane electrochemical potential (∆µH+) formation across the thylakoid membrane and phosphorylation followed by 14-3-3 protein binding.
18
1.1.4.1 Nucleotide binding
One of the most common regulatory mechanisms of ATPase activity is the binding of ADP-Mg to the catalytic sites of the enzyme (Bar-Zvi and Shavit, 1982; Evron et al, 2000; Malyan and Vitseva, 1990). When tightly bound, this nucleotide is responsible for stabilization (Wang et al, 1993) and regulation of the activity of the enzyme (Bar-Zvi and Shavit, 1982). In the absence of an electrochemical proton gradient, ADP-Mg binds to the catalytic site of ATPase acting as an inhibitor and making it almost completely inactive. Upon illumination, and therefore PMF formation, bound ADP-Mg is released and ATP is synthesized (Evron et al, 2000; Wu et al, 2007).
1.1.4.2 Thioredoxins and thiol modulation
The control of enzyme activity by the ferredoxin–thioredoxin system is the most studied example of redox regulation in plant cells and was first identified in 1980 in chloroplast enzymes
(Buchanan and Balmer, 2005; Oelze et al, 2008). The subunit of the ATPase is responsible for the so called thiol modulation or redox modulation in plants and green algae. This subunit contains a domain of approximately 40 amino acids, in which two cysteines are included (Wu et al, 2007). These two Cys residues are able to form a reversible intrapeptide disulfide bond, which enables the regulation of the enzyme via redox thiol modulation (Dal Bosco et al, 2004, Wu et al, 2007). When exposed to light, this disulphide bond is reduced through thioredoxin-f thus activating ATPase and synthesizing ATP (Buchanan and Balmer, 2005; Wu et al, 2007). Under dark conditions, sulfhydryl groups are oxidized to form a disulphide bond, and hence ATP hydrolysis activity is suppressed. One requisite for the efficient reduction of the disulfide bond is a transmembrane proton gradient. The energization of the membrane induces conformational changes that allow the hidden disulfide bridge of the subunit to become accessible to the reductant, thereby activating it (Strotmann et al, 1998).
Even though the redox regulation of chloroplast ATPase activity has been extensively studied, the in planta physiological function remains elusive since redox modulation is not a prerequisite for either activation or deactivation of the chloroplast ATPase. Both activation and deactivation
19 of the enzyme are rapid processes that normally precede the thioredoxin-dependent reduction/oxidation of subunit following changes in light conditions (Wu et al, 2007).
1.1.4.3 Thylakoid PMF
As a result of the linear and cyclic electron flux there is proton translocation through the thylakoid membrane which leads to the formation of a PMF (Oelze et al, 2008; Takizawa et al, 2007). This proton gradient is not only responsible for release of inhibitory, tightly bound Mg-ADP but also for the reduction of the disulfide bridge in the subunit (Evron et al, 2000).
In the presence of light, the generation of ∆µH+ induces conformational changes within the ATPase complex causing activation of the enzyme. As ∆µH+ dissipates in the dark, these conformational changes and ADP release are reversed, inactivating the enzyme and avoiding energy losses (Kleefeld et al, 1990; Strotmann et al, 1998; Wu et al, 2007).
1.1.4.4 Phosphorylation and 14-3-3 protein binding
An additional way of regulation could be executed via 14-3-3 proteins, which are a family of conserved regulatory proteins expressed in all eukaryotic cells.
14-3-3s were thought to be present only in the cytoplasm and on the plasma membrane, but now it has been shown that they are also present in the stroma of the chloroplast (Sehnke et al, 2000). In plants, consumers of energy and reducing power produced by the chloroplasts and mitochondria e.g., the plasma membrane H1 ATPase and nitrate reductase (NR), as well as protein import processes into plastids and mitochondria are all regulated by 14-3-3 proteins. In 2001 Bunney and coworkers showed that the activity of F0F1 synthases from both plant
mitochondria and chloroplasts is controlled by interaction with 14-3-3 proteins. They suggested that 14-3-3 proteins bind to phosphorylated subunits, thereby preventing the rotation and catalytic action of the ATPase complex (Bunney et al, 2001). The most probable targets are the subunits since they undergo phosphorylation in vivo (Del Riego et al, 2006) and are phosphorylated by casein kinase II located in the chloroplast stroma (Reiland et al, 2009), but the process by which 14-3-3 proteins regulate the ATPase still remains unknown.
20
1.1.1.5 Role of ATP synthase
In plants the synthesis of ATP is driven by a flux of protons through the ATPase, across the membrane. This efflux of protons from the lumen is determined by the rate of their translocation through the ATPase (Kramer et al, 2003). The enzyme gates the flow of protons out of the thylakoid lumen and hence regulates the PMF, together with LEF/proton influx into the lumen. The thylakoid PMF has a central role in plants cells as it can both drive ATP synthesis, as well as trigger the initiation of photoprotective mechanisms such as non photochemical quenching (NPQ) (Szabó et al, 2005) and photosynthetic control.
In excessive light conditions, the rate of carbon fixation is surpassed by the amount of available light and the lumen becomes extremely acidic, leading to protonation of an antenna protein, PsbS (Li et al, 2004) and also activation of violaxanthin deepoxidase, which converts violaxanthin to antheraxanthin and finally zeaxanthin, also known as xanthophyll cycle (Oelze et al, 2008). The formation of zeaxanthin together with the protonation of PsbS activates photoprotective mechanisms, allowing the dissipation of excessive energy in the form of heat (Müller et al, 2001; Szabó et al, 2005).
The regulation of PMF can occur by modulating either the light driven proton influx (into the lumen) or the proton efflux (from the lumen) through the ATPase e.g. when the ATPase is limited by ADP or Pi availability due to slow ATP consumption by the Calvin Cycle (Kramer et al, 2004).
In the chloroplast the ATPase has a critical role in photosynthetic control, which is the inhibition of plastoquinol reoxidation at the Cyt-bf due to lumen acidification. Since lumen acidification counteracts the proton pumping reactions at the plastoquinone shuffle, there is a control of the rate of electron donation to PSI (Laasch and Weis, 1989) (Figure 4).
The disturbance of ATPase can be harmful to the cell and hence must be tightly regulated in order to prevent cellular death (Johnson, 2008).
21
Figure 4-Schematic representation of the electron (orange arrows) and proton transfers (blue arrows), and associated processes that can occur as a result of light absorption by the thylakoid photosystems. From Baker et al 2007.
1.2 Objective
Higher plants adjust the photosynthetic ATP and NADPH production to the metabolic consumption by the Calvin cycle, as otherwise, an imbalance could result in the generation of reactive oxygen species, ultimately leading to cell death. The content of certain electron transport chain components, as cytochrome-bf complex, plastocyanin and ATPase, are closely adjusted to the metabolic demands. Although it is well established that the cytochrome-bf complex controls photosynthetic flux, an additional contribution of ATPase contents to flux control could also be possible (Schöttler et al, 2007).
The present study aimed to determine the impact of altered ATPase contents on ATPase activity and on assimilation capacity. Furthermore, the hypothesis that ATPase limits the photosynthetic electron transport, and regulates the onset of photoprotective mechanisms should also be investigated. Therefore transplastomic plants with decreased amounts of ATPase, through manipulation of the accumulation of the plastome-encoded subunit and nuclear encoded subunit were generated. Both types of transformants were chosen due to their central role in ATPase biogenesis as shown in Chlamydomonas (Drapier et al, 2007).
22
2. Material and methods
2.1 Plant material and growth conditions
Transgenic tobacco plants were generated within the PhD thesis of Markus Rott (AG Schöttler, MPIMPP) and were available from the beginning of this master thesis. Both wild-type tobacco (Nicotiana tabacum) plants from the cultivar Petit Havana (PH) and transformed plants were grown in a controlled environment chamber. The actinic light intensity was 800µE m-2 s-1, with plants being illuminated daily for a period of 16h. During the day the relative humidity was 70% and the temperature 22°C. During the night period the temperature was reduced to 18°C and the relative humidity was 70%. An additional transgenic line, atpC1, (Lein et al, 2008), from the cultivar Sansun (SNN), was grown under the same conditions.
2.2 Constructs
Eight mutations were introduced into the atpB 5’-untranslated region (UTR). Lines MJR1 and MJR2 had a point mutation introduced into the atpB translation initiation codon. Lines MJR3, MJR4, MJR5 and MJR6 had a point mutation in the 5´-Untranslated (UTR) region of the mRNA of atpB. Line MJR7 had a deletion between base pair 25 and 53, and line MJR10 contained only the selectable marker gene aadA, which in all transplastomic plants was introduced as additional transcript, comprising both aadA and atpB, due to incomplete transcript accumulation in chloroplasts in higher plants (Figure 5).
amp
rbcL
5‘part of atpB
aadA
5‘UTR ATT ATT ATG atpB
ATT ACT ATG atpB 5‘UTR
5‘UTR ATT ATT TTG atpB
5‘UTR ATT ATTGTG atpB
5‘UTR ATT TTT ATG atpB
5‘UTR ATT AAT ATG atpB
5‘UTR ATT ATCATG atpB
5‘UTR deletedATT ATT ATG atpB
WT MJR1 MJR2 MJR3 MJR4 MJR5 MJR6 MJR7 MJR10 aadA control
Figure 5-Schematic figure of the constructs with the inserted point mutations in red (MJR1 to MJR6) and the deletion (MJR7). amp- Ampicillin resistance gene; rbcL- The sequence of the large subunit of the
ribulose-bisphosphate carboxylase gene; aadA- Aminoglycose resistance protein; WT- Wild type; ATG- Start codon. Modified from Hirose and Sugiura, 2004.
23
2.3 Thylakoid membrane isolation
In order to measure the photosynthetic complexes (PSII, PSI, Cyt-bf) in vitro, thylakoids were isolated from intact leaves number 3, 4 and 5 (from the top). All isolations and centrifugations were made at 4°C according to Schöttler et al, (2004). In Table 1, the composition of the extraction media is described.
The chlorophyll content was determined according to Porra et al, (1989) in 80% (v/v) acetone.
Table 1-Composition of thylakoid extraction media
Medium Substances Concentration [g/l] Concentration [mmol/l]
Extraction medium HEPES 9,60 50,0
MgCl2·6 H2O 1,02 5,0
KCl 2,24 30,0
Sorbitol 63,80 350,0
KOH- Solution - pH=6,1
Shock medium HEPES 11,92 50,0
MgCl2·6 H2O 1,02 5,0
KCl 2,24 30,0
KOH- Solution - pH=7,6
Double medium HEPES 11,92 50,0
MgCl2·6 H2O 1,02 5,0
KCl 2,24 30,0
Sorbitol 127,44 700,0
KOH- Solution - pH=7,6
Storage medium HEPES 11,90 50,0
MgCl2·6 H2O 1,00 5,0
KCl 6,00 40,0
MnCl2 0,10 0,5
Sorbitol 60,10 330,0
KOH- Solution - pH=7,8
2.4 Quantification of photosynthetic complexes
2.4.1 Quantification of PSII and Cytochrome-b6f complex
The contents of PSII and the bf were determined from difference absorption signals of Cyt-b559 (PSII) and Cyt-f and b6 (Cyt-bf). Isolated thylakoids equivalent to 50 µg chlorophyll ml-1
24 2), to improve the optical properties of the probe (Kirchhoff et al, 2002). Addition of 1 mM Ferricyanide (+III) leads to oxidation of all cytochromes. The subsequent addition of ascorbate results in the reduction of Cyt-f and the high-potential form of Cyt-b559 (Ascorbate-Ferricyanide
difference spectrum) and the addition of dithionit in the reduction of cyt-b6 and the low-potential
form of cyt-b559 (Dithionit-Ascorbate difference spectrum) (Table 3). At each redox potential,
absorption spectra were measured between 575 and 540 nm wavelength with a V-550 spectrophotometer (Jasco GmbH, Groß-Umstadt, Germany) equipped with a head-on photomultiplier. The spectral bandwidth was 1 nm and the scanning speed was 100 nm min-1. Difference absorption spectra were deconvoluted using reference spectra and difference extinction coefficients as in Kirchhoff et al, (2002). The concentration of the cytochrome bf complex was determined from chemically induced absorbance changes (Kirchhoff et al, 2002) and the content in PSII was calculated from the sum of the difference absorption signals of the high potential and low potential forms of Cyt-b559 (Lamkemeyer et al, 2006).
Table 2-Cytochrome medium composition
Medium Substance Concentration(g/l) Concentration(mmol/l)
Cytochrom-Medium Na-HEPES KCl Na2EDTA·2H2O 7,15 2,30 0,04 30 30 0,01 Cytochrom-Medium + ß-DM 50ml Cyt-Medium + 15 mg ß-DM (0,03% (w/v))
Table 3-Redox potential of cytochromes and effect on components of ETC at pH 7,6
Chemical substance Em [mV]: Effect
Ferricyanide K4[Fe(CN)6]·H2O + 400 Oxidation of Cytochromes
Na-Ascorbate + 90 Reduction of Cyt-f and Cyt b559 HP
Dithionit Na2S2O4 - 800 Reduction of Cyt b6, Cyt b559 LP
25
2.4.2 Quantification of P700
The P700 contents were determined from light-induced difference absorption changes of P700.
Isolated thylakoids equivalent to 50 µg chlorophyll ml-1 were solubilised in 0.2% (w/v) ß-DM medium (Table 4) and then an electron acceptor (100µM methylviologen) and electron donor (10 mM ascorbate) where added. P700 was oxidised by the application of a saturating light pulse (2000 µE m-2 s-1 red light, 200 ms duration). The measurements were done using the Dual-PAM instrument (Heinz Walz GmbH, Effeltrich, Germany). The amplitude of the DAS (Difference Absorption Spectrum) was proportional to P700 content, which can be calculated using the difference extinction coefficient = 6,0 cm2/µmol-1 according to Lambert-Beer at 830-870-nm wavelength.
Table 4-PSI medium composition
Medium Substance Concentration(g/l) Concentration(mmol/l)
PSI-Medium Na-HEPES MgCl2·6H2O KCl 7,15 1,00 2,30 30 5 30 PSI-Medium + ß-DM 50ml PSI -Medium + 100 mg ß-DM (0,2% (w/v)) 2.4.3 Quantification of PC/P700
The PC content was determined by in vivo difference absorption spectroscopy in the far-red range of the spectrum, and then recalculated based on the absolute P700 quantification in isolated thylakoids (2.4.2) as described in Schöttler et al, (2004). Light-induced absorption changes at 830-870 nm wavelength (predominant contribution of P700) and at 870-950 nm wavelength (predominant contribution of PC) were done on pre-illuminated leaves with fully activated Calvin cycle, to avoid an acceptor-side limitation of PSI.
26
2.5 P700 and PC reduction kinetics
To determine the maximum difference absorption signals of PC and PSI, pre-illuminated leaves were put in darkness for some seconds, to fully reduce both components, followed by 10 s illumination with far-red light (715 nm wavelength), to selectively excite PSI. After 10 s, a saturating pulse of red light was applied (5000 µE m-2 s-1, 200 ms duration), to completely oxidize PC and PSI and reduce the PSII side of the electron transport chain. At the end of the actinic light pulse, all light sources were switched off, and PC and PSI reduction kinetics were determined (Schöttler et al, 2007).
2.6 77K fluorescence measurement
The 77K chlorophyll-a fluorescence emission spectrum was determined on isolated thylakoids equivalent to 10 µg chlorophyll ml-1, using PSI medium without -DM, in a F6500 fluorometer (Jasco GmbH, Groß-Umstadt, Germany). The sample was excited at 430 nm wavelength (10 nm bandwidth). The emission spectra between 655 and 800 nm was recorded with a bandwidth of 1 nm. The scanning speed was of 200 nm min-1. Depending on the quality of the measured signals, these were repeated up to ten times and averaged to reduce noise.
2.7 Fluorescence measurement
Chlorophyll-a fluorescence of intact leaves was determined at room temperature using a Dual-PAM-100 instrument (Heinz Walz GmbH, Effeltrich, Germany). After measurement of the dark-adapted F0 and FV/FM, the actinic light was switched on, and light response curves of linear
electron flux (LEF) and of non-photochemical quenching (qN), as well as of the redox state of the PSII-acceptor side (qL) were recorded. The light intensity varied between 0 and 2000 µE m
-2
s-1, taking 60 seconds per light intensity in a total of 20 steps. Fluorescence parameters were calculated according to Baker et al, (2007).
27
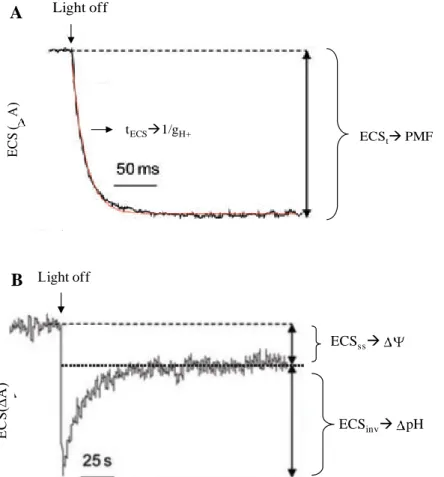
2.8 PMF measurements and ATP synthase activity
The electrochromic absorption shift (ECS) of carotenoids is proportional to the electrochemical component (∆H) of the PMF across the thylakoid membrane and allows the in vivo measurement
of changes in the PMF across the thylakoid membrane (Kramer et al, 2003; Baker et al, 2007). The difference absorption signal was measured using a KLAS-100 LED-array
spectrophotometer (Heinz Walz GmbH, Effeltrich, Germany), allowing the simultaneous measurement of light-induced difference absorption signals at six pairs of wavelengths in the visible range of the spectrum between 500 and 570 nm.The ECS was deconvoluted from signals arising from zeaxanthin formation, scattering effects, the ―C550‖ pheophytin signal, and from redox changes of the cytochromes f, b6, and b559, as described in Klughammer et al, 1991. The
deconvoluted signals were then normalized to the chlorophyll content of the measured leaf section.
The maximum amplitude of the ECS (ECST) was used as a measure for the light-induced PMF
above the thylakoid membrane. Leaves were illuminated for 5 min prior to each measurement, to allow photosynthesis to reach steady state. ECST was determined after illuminating the leaves
with saturating light (2100 µmol m-2 s-1), which then was interrupted by a short interval of darkness (15 seconds), and the dark-interval relaxation kinetics of the ECS were measured. 15 seconds dark intervals were sufficient for complete relaxation of the PMF. PMF partitioning into pH and was determined by analysing the slow relaxation phase of the ECS between 1 seconds and 15 seconds of darkness as described by Takizawa et al, (2007). A typical ECS curve is shown in Figure 6.
To determine the ATPase activity, the fast phase of the dark-interval relaxation kinetics (between 0 and 500 milliseconds after the end of actinic illumination) was fitted with a single exponential decay function (Figure 6A). The reciprocal value of the halftime of the ECS decay, which corresponds to the thylakoid conductivity (gH+),was used as a measure of ATPase activity, since the fast ECS decay is exclusively attributable to proton efflux through the ATPase complex (Baker et al, 2007; Takizawa et al, 2007).
28
Figure 6-Typical dark-interval relaxation kinetics of the electrochromic shift (ECS). A rapid light–dark
transition from steady-state conditions leads to several phases of ECS decay that can be analyzed to give information about the total PMF and its partitioning into pH and . A) The total PMF above the thylakoid membrane is determined from the maximum amplitude of the ECS signal after a light to dark transition (ECSt). The inverse of the lifetime for ECS decay, ECS, reflects the conductivity of the thylakoid membrane to protons e.g. ATPase activity. B) Over a longer time-scale, the quasi-stable state decays, reflecting the movements of counter-ions, which relax the portion of the ECS signal caused by the pH component of PMF, termed ECSinv. ECS is measured as the absorption changes occurring around 520 nm (∆A). Modified from Baker et al, 2007.
2.9 Gas exchange measurements
The leaf assimilation capacity was determined in a closed-cuvette system with a Clark-type electrode (LD2, Hansatech Instruments, Norfolk, England). Leaves were dark-adapted for 15 min, to determine respiration rates, and subsequently illuminated until photosynthetic oxygen evolution reached its steady state.The leaf discs, with area of 10 cm2,were measured in a CO2
-saturated gas mixture (5% CO2), to totally repress photorespiration. Saturating actinic light was
provided by a FL-460 (Heinz Walz GmbH). The chlorophyll content of the leaf discs was
E C S ( A ) Light off ECSt PMF tECS1/gH+ Light off E C S ( A ) ECSss ECSinv pH Light off E C S (∆ A ) Light off A B
29 determined according to Porra et al, (1989), and assimilation capacity was calculated on leaf area and chlorophyll basis.
The assimilation rates were corrected for the dark respiration, assuming that respiratory activities in the light and in darkness are comparable (Fernie et al, 2004).
2.10 Metabolite quantification
2.10.1 Ethanol extraction of soluble sugars
For the extraction of the soluble sugars the leaf material was harvested always at the same time (12 am). After pulverizing the leaf material with a Retsch mill (Retsch MM301), 50 mg of frozen leaf material were put in 2 ml tubes. Afterwards 500 L of 80% EtOH were added and the sample was incubated for 10 minutes at 78 ºC, at 440 rpm in a heating-shaker (Eppendorf thermomixer comfort), followed by 5 minutes of centrifugation (14000 rpm). The supernatant was transferred to a new 2ml tube and put on ice. The remaining sediment was resuspended with 500 L of 50% EtOH and again incubated in 78 ºC for 10 minutes, followed by centrifugation and transfer of the supernatant to a 2 ml tube. The resuspension with 50% EtOH was repeated one more time, and the supernatants were united. These samples were kept at -20 ºC and used for soluble sugars quantification the following day.
2.10.2 Starch extraction
Since starch is insoluble in water, it must be broken into glucose monomers by heating and enzymatic digestion for quantification. In order to do this, the sediment resultant from the ethanol extraction was dried overnight at 20ºC.
The next day, it was dissolved with 1 ml of H2O. The sample was then put in a 2 ml tube (with
screwing lid) and incubated for 3 hours at 120 ºC. Next the sample was put on ice and cooled down, finally adding 200 µL of Enzyme mix (Table 5). The sample was incubated overnight at 37 ºC. The following day the sample was centrifuged for 30 minutes (20.000 g). The supernatant was put in a new 2 mL tube and put on ice. The remaining pellet was resuspended with 500 µL H2O, and then incubated for 3 hours at 120ºC and then 300 mL of Enzyme mix were added.
30 Then the sample incubated overnight at 37 ºC. The next day, the starch was hydrolyzed and quantification was done through determination of glucose units. The starch quantification was done according to Smith and Zeeman, (2006).
Table 5-Enzyme mix composition
Medium Substance
Enzyme-mix 5 ml Sodium Acetate (100 mM; pH = 5,5)
200 µl Amyloglucosidase of Aspergilus niger, 140 U/ml, Roche, Mannheim)
4 µl α-Amylase (of Pig pancreas, 10.000 U/ml, Roche, Mannheim)
80 µl G-6-P-DH: centrifuge (13400 rcf, 2 min, 4ºC) and dissolve the pellet in the glucose mix
2.10.3 Metabolite quantification
The samples were put in a 96 wells microplate and measured in a Photometer (SpectraMAX, Molecular Devices, Sunnyvale, USA). The method is based in the enzymatic oxidation of activated glucose via G-6-P-DH (Glucose-6-Phospate Dehydrogenase) which is coupled to the reduction of NADP+ (Jones, 1977). NADPH has an absorption maximum at 340 nm. Therefore the metabolite content can be quantified by photometric endpoint determination through the law of Lambert-Beer. Each of the wells contained 160 µL of Glucose mix (Table 6) and in parallel 4, 6, 8 and 10µL of sample were added in each well. First the baseline was measured for 3 minutes until it reached steady-state. After this, this step was repeated by addition of Hexokinase, Phosphoglucose-Isomerase (PGI) and Invertase (Inv) (Table 7), keeping in mind that the addition of a new enzyme could be done only when the absorption was constant (steady-state). After glucose quantification, Fructose-6-Phosphate was converted into Glucose-6-Phosphate, by addition of PGI, and fully oxidized. After complete consumption of glucose and fructose, sucrose was cleaved by invertase. A general overview of the reactions involved in the metabolite quantification is presented in Figure 7.
31
Table 6-Glucose mix composition
Medium Substance
Glucose-mix 15,5 ml HEPES-MgCl2 (0,1 M, 3mM MgCl2)
480 µl ATP (60mg/ml) (Roche Diagnostics, Mannheim, Germany)
480 µl NADP (36mg/ml) (Roche Diagnostics, Mannheim, Germany)
80 µl G6PDH: centrifuge(13400 rcf, 2 min, 4ºC) and dissolve the pellet in the Glucose mix
Table 7- Enzymes preparation
Enzymes Hexokinase- Centrifuge 120 µl and dissolve pellet in
200 µl HEPES (0,1M)
Phosphoglucose-Isomerase- Centrifuge 60 µl and dissolve pellet in 200 µl HEPES (0,1M)
Invertase- Dissolve a bit in 200 µl HEPES (0,1M). Solution must turn yellow
Figure 7- Overview of the enzymatic reactions occurring in the metabolite quantification.
Sucrose
Glucose
Fructose Fructose-6-Phosphate
Glucose-6-Phosphate 6-Phosphogluconate
ATP ADP
ATP ADP Phosphoglucose-isomera se
Hexokina se Inverta se
NADP+
G-6-P-DH
32
3. Results
3.1 Growth phenotype
Figure 8- Growth phenotype in WT tobacco (PH) and ATPase transformant lines. A-WT; B-MJR1; C-MJR2;
D-MJR3; E-MJR4; F-MJR5; G-MJR6; H-MJR7; I-MJR10; J-atpC1. The atpB lines, except for line MJR2, showed no differences in the growth phenotype. The atpC line showed impaired growth, reduced leaf size, and massive retardation of flowering.
In this work transformants with point mutations introduced into the 5’-UTR of the plastid encoded atpB gene (2.2) were characterized. Previous in vitro translation assays revealed changes in translation rates between 10 and 200% of the wild-type level (Hirose and Sugiura, 2004). The lines showed no unequivocal growth phenotype (Figure 8), except for the line MJR2 whose growth was extremely retarded (Figure 8C). Therefore seeds from this line could not be obtained in time to measure it in this master thesis. For this reason this line will not be mentioned any further in this work. Additionally to MJR2, also an atpC antisense line (atpC1), with reduced atpC mRNA accumulation was analysed as a positive control, for which a strong repression of
33 the ATPase had already been established (Schöttler et al, 2009, under revision). It showed a retarded growth and severely delayed flowering (Figure 8J).
3.2 Chlorophyll content
Figure 9- Chlorophyll content (A) and chlorophyll a/b ratio (B) in WT tobacco (PH) and ATPase transformant lines. The chlorophyll content was determined on a leaf area basis. Some atpB lines had slightly
increased chlorophyll content, although with no significant differences. The antisense line showed the highest chlorophyll content. It is important to say that the atpC line belonged to a different cultivar, SNN, than the atpB lines, PH. The SNN variety has a higher chlorophyll concentration than PH. The value of the chlorophyll a/b ratio showed no differences between the WT and atpB mutants. The antisense line had the lowest chlorophyll a/b ratio.
The chlorophyll content was determined on a leaf area basis, according to Porra et al, (1989). The obtained data showed that the chlorophyll content was slightly higher in lines MJR1 (440 mg m-2), MJR5 (413 mg m-2) and MJR10 (416 mg m-2) than the WT (369 mg m-2) (
Figure 9A). All other atpB lines did not show changes in the chlorophyll content compared to the WT. The antisense line showed a higher chlorophyll content (519 mg m-2) in comparison with all other lines, including WT, (Figure 9A). This is due to the fact that this line belonged to a different tobacco cultivar-SNN. This variety is known for having higher chlorophyll content than the Petit Havana variety (Schöttler et al, 2009, under revision).
The chlorophyll a/b ratio showed no differences between the WT and atpB mutants (Figure 9B), with a constant value of about 4,2. Only the antisense line showed a significantly lower chlorophyll a/b ratio (Figure 9B).
0 0.5 1 1.5 2 2.5 3 3.5 4 4.5 5 1 2 3 4 5 6 7 8 9 Chl orophy ll a /b 0 100 200 300 400 500 600 700 1 2 3 4 5 6 7 8 9 Chl or oph yl l c ont e nt [m g m -2] WT MJR1 MJR3 MJR4 MJR5 MJR6 MJR7 MJR10 atpC1 WT MJR1 MJR3 MJR4 MJR5 MJR6 MJR7 MJR10 atpC1 A B
34
3.3 ATPase activity
Figure 10- Relaxation halftime of PMF (A) and maximum proton motive force (B) in WT tobacco (PH) and ATPase transformant lines. Except for the antisense line none of the ATPase mutants showed an alteration in the
ATPase activity in comparison with WT (A). The PMF reached a maximum in the antisense mutant and lines MJR4 and MJR6 had the highest PMF of the atpB mutants (B).
To check the impact of atpB mutations and atpC antisense repression on ATPase, its activity was determined through the fast dark-relaxation kinetics of the maximum electrochromic absorption shift (ECST), which is a measure of the PMF above the thylakoid membrane (Kramer
et al, 2003; Takizawa et al, 2007). During the short dark interval the relaxation of the PMF is determined by the rate of proton efflux through the ATPase, e.g. thylakoid membrane conductivity, and therefore represents a measure of the ATPase activity (Takizawa et al, 2007) (2.8). The average relaxation halftime of the PMF did not vary between the WT and the atpB transformants (Figure 10A). In the WT the fastest relaxation time was observed, 14 ms, and line MJR1 showed the slowest relaxation time of all atpB transformant with 17 ms, although it was not a significant difference (Figure 10A). In the antisense line the halftime was increased to 50 ms (Figure 10A), which is attributable to its 80% reduction in ATPase content (Schöttler et al, 2009, under revision).
The maximum PMF accumulation was determined and the results showed a significant difference in comparison with WT. Lines MJR4 and MJR6 showed the higher PMF formation above the thylakoid membrane. Strangely, although line MJR1 showed a slightly lower conductivity in comparison with the other atpB transformants, it did not have the highest value of PMF (Figure 10B). In the antisense line the thylakoid conductivity was strongly repressed
0 10 20 30 40 50 60 70 80 90 1 2 3 4 5 6 7 8 9 E CS T /c hl [∆ I/ I.( m g chl ) -1] WT MJR1 MJR3 MJR4 MJR5 MJR6 MJR7 MJR10 atpC1 0 10 20 30 40 50 60 70 1 2 3 4 5 6 7 8 9 H a lf li fe t im e of P M F [m s] WT MJR1 MJR3 MJR4 MJR5 MJR6 MJR7 MJR10 atpC1 B A
35 (Figure 10A) and as a consequence the PMF above the thylakoid membrane was highly increased (Figure 10B).
3.4 Assimilation capacity
Figure 11-Assimilation capacity on a chlorophyll basis (A) and on leaf area (B) in WT tobacco (PH) and ATPase transformant lines. The assimilation capacity was measured on both chlorophyll and leaf area basis. Both
measurements revealed a decrease in assimilation in some atpB lines, but the assimilation was most repressed in the
atpC antisense line.
To check the impact of atpB mutations and atpC antisense repression on assimilation capacity, the assimilation rate was determined on chlorophyll basis and on leaf area basis. On a chlorophyll basis the obtained data showed significant differences between the WT and some of the atpB lines. Lines MJR1 (583 µmol EP/mg*h), MJR4 (587 µmol EP/mg*h), MJR5 (578 µmol EP/mg*h) and MJR6 (620 µmol EP/mg*h) showed the lowest assimilation capacities of the atpB transformants (Figure 11A), having a decrease of about 25% in comparison with the WT (750 µmol EP/mg *h). The atpC1 line showed the lowest assimilation rate (240 µmol EP/mg *h) with a decrease of about 70% in comparison with the WT (Figure 11A). The results of assimilation capacity per leaf area were not exactly comparable with the results per chlorophyll. Only line MJR4 showed a significant assimilation reduction (about 23%), while in all other lines the reduction was less apparent. The atpC1 line was the line that showed the most reduced
0 5 10 15 20 25 30 35 40 45 50 1 2 3 4 5 6 7 8 9 A ss im il a ti on [µ m ol O 2 m -2 s -1] WT MJR1 MJR3 MJR4 MJR5 MJR6 MJR7 MJR10 atpC1 0 100 200 300 400 500 600 700 800 900 1000 1 2 3 4 5 6 7 8 9 A ss im il a ti on [µ m ol E P / m g *h] WT MJR1 MJR3 MJR4 MJR5 MJR6 MJR7 MJR10 atpC1 A B
36 assimilation per leaf area, 15 µmol O2 m-2 s-1. The SNN WT has comparable assimilation
capacities as PH (Schöttler et al, 2009, under revision).
3.5 Assimilation capacity versus membrane conductivity
A plot of the reciprocal values of the conductivity of the thylakoid membrane against assimilation capacities per chlorophyll was made (Figure 12). Unfortunately as all data points for the atpB mutants scattered closely together, due to minor differences in assimilation and gH+, no
conclusions on a correlation between ATPase activity and assimilation capacity could be drawn. However, taking the atpC antisense line into account, the overall data showed that a lower conductivity closely correlates with reduced assimilation capacity (Schöttler et al 2009, under revision), which might suggest that ATPase activity, can limit leaf assimilation.
Assimilation [µmoles electron pairs (mg chl.h)-1 ]
0 200 400 600 800 1000 gH+ 0 20 40 60 80 100 WT MJR1 MJR3 MJR4 MJR5 MJR6 MJR7 MJR10 atpC1
Figure 12- Assimilation capacity versus conductivity of the membrane in WT tobacco (PH) and ATPase transformant lines. The atpB lines did not show a linear correlation between the conductivity and the assimilation
capacity. In the antisense line the assimilation declined in parallel with ATP synthase activity repression, indicating a limiting role of ATPase.