Production of fish protein hydrolysates by a marine
proteolytic strain
Irina Sofia Marques Godinho
Dissertação para obtenção do Grau de Mestre em
Engenharia Alimentar
Orientador: Doutora Sónia Cristina Nunes Salvador Correia Pedro Coorientador: Professora Doutora Maria Luísa Louro Martins
Júri:
Presidente: Doutora Margarida Gomes Moldão Martins, Professora Auxiliar com agregação do Instituto Superior de Agronomia da Universidade de Lisboa.
Vogais: Doutor Miguel Pedro de Freitas Barbosa Mourato, Professor Auxiliar do Instituto Superior de Agronomia;
Doutora Sónia Cristina Nunes Salvador Correia Pedro, Investigadora Auxiliar do Instituto Português do Mar e da Atmosfera.
First and foremost I want to thank my supervisor, Dr. Sónia Pedro, for her guidance and supervision, especially during the time I spent in the microbiology lab.
To Professor Luísa Louro, for being always willing to help me, even when she was the busiest person alive, and for all the things she taught me during the past few years.
To the Engineers Irineu Baptista and Carla Pires, without whom I wouldn’t have the opportunity to work in this project, for all the new things they taught me over these past months and the invaluable assistance in writing and analyzing the results.
To Instituto Português do Mar e da Atmosfera – Divisão de Aquacultura e Valorização, for the good work conditions.
To Patrícia, for guiding me through the microbiology lab, in my early days in this project, and for all the help provided with starter cultures and culture media.
To my lab mates, Inês, Francisca, Helena, Bárbara and Gabriel for the great lab work atmosphere and the chance to learn from each other. Thank you Bárbara, for your indispensable help given during my lab work. To Gabriel, for all the conversations about music, movies and TV series, as well as for the assistance in operating the freeze-drier. To Helena, for share with me existential questions about “our” strain. To Inês and Francisca, my friends and lunch time companions, for all the laughs and “girls talk” during our breaks.
To all my friends and colleagues, for being always by my side and for all the words of encouragement.
To my parents and my sister, for putting up with me since the beginning of times. Thank you for always pushing me forward, even in the hardest times.
The preparation of fish protein hydrolysates by a fermentative process is an alternative to classical preparation using added proteolytic enzymes, taking advantage of the wide spectrum of proteolytic enzymes produced by microorganisms and increasing the complexity of the peptide mixture obtained. Thus, the objective of this work was to prepare fermentative protein hydrolysates (FPH) from a commercial cod protein hydrolysate (CPH) using an indigenous marine proteolytic strain. The bacterial growth was performed in liquid culture media, containing three concentrations of CPH (1, 2 and 4%), yeast extract (0.5%) and sucrose (0.5%), with continuous shaking, at 30 ºC for 24, 50 and 72 hours. The parameters evaluated were the culture growth, enzymatic activity, protein content and recovery, peptide profile, degree of hydrolysis and antioxidant activity, measured by DPPH and ABTS radical scavenging activity, reducing power and metal chelating activity. Bacterial growth and enzymatic activity reached their maximums after 24 hours of fermentation, and all FPH showed the disappearance of peptides in the range of 200 – 400 Da. In the set of samples, 4 % FPH recorded the highest values of protein content and recovery, but 1 % and 2 % FPH were the samples that presented improved antioxidant activity.
Key-words: Fermentative protein hydrolysate, proteolytic strain, fish by-products, antiradical activity, chelating activity, reducing power.
A preparação de hidrolisados de proteicos de pescado através de um processo fermentativo é uma alternativa à preparação clássica utilizando enzimas proteolíticas adicionadas, aproveitando o amplo espectro de enzimas proteolíticas produzidas por microorganismos e o aumento da complexidade da mistura de péptidos obtidos. O objetivo deste estudo foi preparar hidrolisados proteicos fermentativos (FPH) a partir de um hidrolisado proteico de bacalhau comercial (CPH), utilizando uma estirpe proteolítica marinha. O crescimento bacteriano foi realizado em meios de cultura contendo três concentrações de CPH (1, 2 e 4 %), extrato de levedura (0,5%) e sacarose (0,5%), com agitação contínua a 30 º C durante 24, 50 e 72 horas. Os parâmetros avaliados foram o crescimento bacteriano, atividade enzimática, recuperação e teor de proteína, perfil de péptidos, grau de hidrólise e atividade antioxidante, medida pela capacidade de captar os radicais DPPH e ABTS, poder redutor e atividade quelante. O crescimento bacteriano e atividade enzimática atingiram os valores máximos após 24 horas de fermentação, e todos FPH revelaram o desaparecimento de peptídeos na gama de 200-400 Da. No conjunto de amostras, 4 % FPH registou os maiores valores de recuperação e teor de proteína, enquanto 1 % e 2% FPH apresentaram melhor atividade antioxidante.
Palavras-chave: Hidrolisados proteicos fermentativos, estirpe proteolítica, subprodutos da pesca, atividade anti-radicalar, atividade quelante, poder redutor.
Os processos de fermentação que ocorrem em vários tipos de produtos alimentares proteicos podem levar à formação de misturas muito complexas de péptidos. Tal fato resulta de uma ampla gama de proteases extracelulares produzidas pelos microrganismos. A produção de hidrolisados proteicos de pescado tem sido considerada uma boa alternativa para a valorização dos subprodutos da pesca. Estes hidrolisados proteicos são geralmente preparados por adição de proteases comerciais, embora o processo de fermentação não tenha sido utilizado na sua produção. Assim, o objetivo deste trabalho foi preparar hidrolisados proteicos fermentativos (FPH) a partir de um hidrolisado proteico de bacalhau comercial (CPH), utilizando uma estirpe bacteriana proteolítica de origem marinha, presuntivamente Bacillus sp..
O crescimento bacteriano foi realizado em meios de cultura líquidos, contendo três concentrações de CPH (1 %, 2 % e 4 %), extrato de levedura (0,5 %) e sacarose (0,5 %), com agitação contínua, a 30º C durante 24, 50 e 72 horas. Avaliou-se o crescimento bacteriano por medição da absorvância e contagens de unidades formadoras de colónias (CFU). Após cada período de fermentação, os meios de cultura foram centrifugados (10 000 rpm, 15 minutos) e os sobrenadantes foram filtrados e identificados como 1 % FPH, 2 % FPH e 4% FPH. Foram, ainda, retiradas alíquotas de FPH para a determinação da actividade enzimática e perfil de péptidos. Os FPH líquidos foram concentrados e liofilizados e determinadas as respectivas atividades antioxidante e quelante.
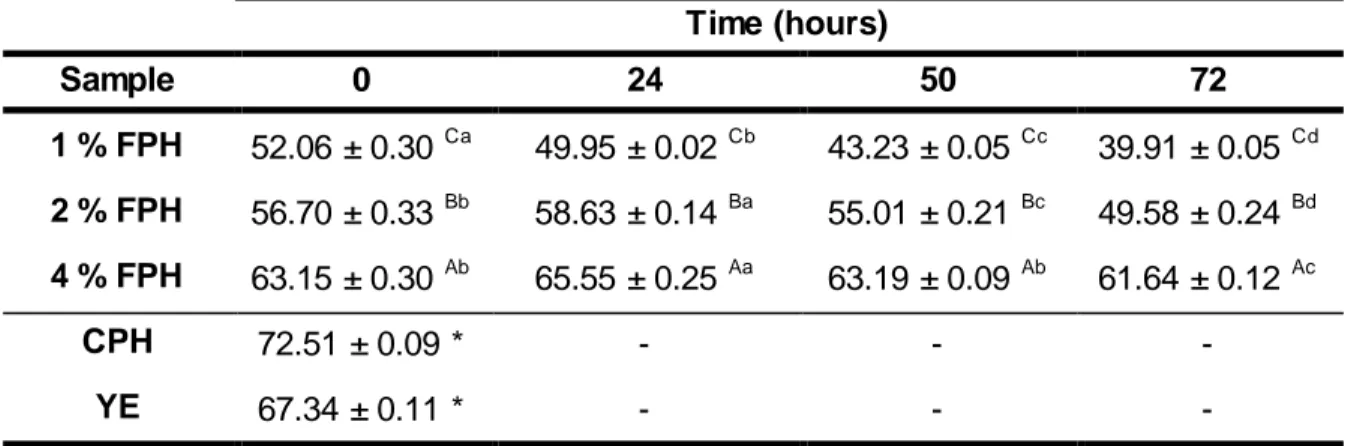
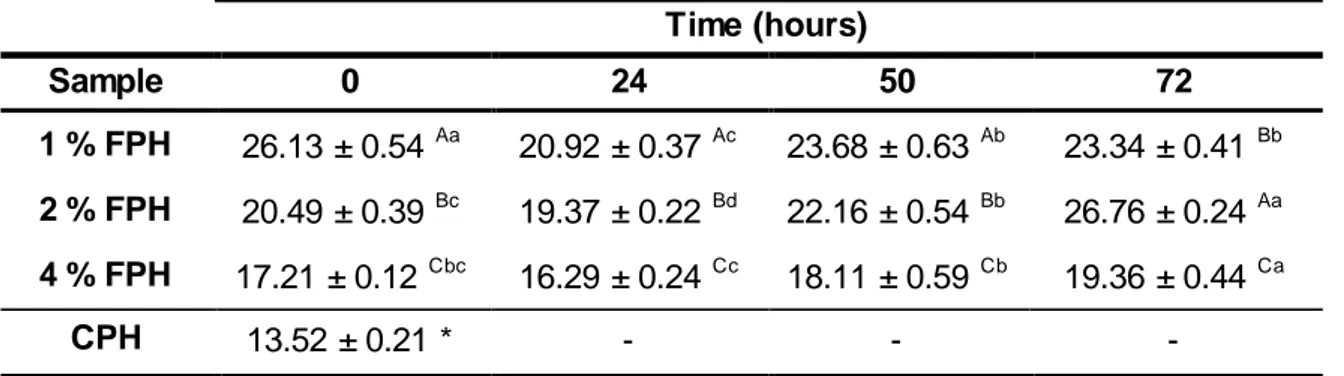
As contagens de colónias e máximos de atividade enzimática foram obtidos após 24 horas. Após 72 horas de fermentação os teores de proteína, em percentagem de peso seco, foram cerca de 40 %, 50 % e 62 %, para 1 %, 2 % e 4 % FPH, respetivamente. Os rendimentos obtidos com base no teor em proteína foram de 29 %, 28 % e 58 % para 1 %, 2 % e 4 % FPH, respectivamente. O aumento mais elevado (6 %) do grau de hidrólise foi observado em 2 % FPH após 72 horas de fermentação. Registaram diferenças importantes perfil de péptidos relativamente inicial, ocorrendo o desaparecimento de peptídos na gama de 200- 400 Da e formação de dipéptidos e aminoácidos livres. A actividade de eliminação do radical livre DPPH dos FPH aumentou com o período de fermentação, que se traduziu pela diminuição do valor de EC50. A atividade anti-radicalar dos diferentes FPH em relação
ao ABTS não mostrou uma tendência clara em função do período de fermentação ou da concentração de FPH. Quanto ao poder redutor, o valor mais elevado foi atingido após 72 horas de fermentação, sendo mais elevado no 1 % FPH. No entanto, o poder redutor diminuiu com o aumento da concentração de HPF. No que diz respeito à atividade quelante, os FPH obtidos após qualquer período de fermentação mostraram menor atividade quelante, tanto do Cu 2+, como do Fe2+, do que os péptidos iniciais. Apesar destes decréscimos na
LIST OF CONTENTS
Chapter I - Introduction ... 1
1. Objectives... 1
2. Literature Review ... 1
2.1. Fish industry and by-products valorization ... 1
2.2. Fish protein hydrolysates ... 3
2.2.1. Production of fish protein hydrolysates... 3
2.2.2. Chemical composition of fish protein hydrolysates ... 9
2.2.3. Properties of fish protein hydrolysates ... 9
2.2.4. Applications of fish protein hydrolysates ... 13
Chapter II - Materials and Methods ... 16
1. Materials ... 16
2. Methods ... 16
2.1. Hydrolysates production ... 16
2.1.1. Preparation of culture media and microbiological assay ... 16
2.1.2. Optical Density (OD) measurements and separation of the bacteria from the medium 17 2.1.3. Supernatant storage, concentration and freeze-drying ... 17
2.2. Hydrolysates characterization ... 17
2.2.1. Determination of enzymatic activity ... 17
2.2.2. Gel filtration and peptide profile ... 18
2.2.3. Protein content determination ... 19
2.2.4. Yields of protein recovery ... 19
2.2.5. Degree of hydrolysis (DH)... 19
2.3. Antioxidant properties of FPH ... 20
2.3.2. Reducing Power ... 22
2.3.3. Metal ion chelating activity ... 22
2.4. Statistical analysis ... 23
Chapter III - Results and Discussion ... 24
1. Microbial Growth and Protease Production ... 24
2. Evolution of Protein Content During Bacterial Growth and Degree of Hydrolysis ... 26
3. Molecular Weight Distribution ... 28
4. Antioxidant Activity of the FPH ... 31
4.1. DPPH radical scavenging activity ... 31
4.2. ABTS radical scavenging activity ... 35
4.3. Reducing Power ... 39
4.4. Copper chelating activity ... 43
4.5. Iron chelating activity ... 46
Chapter IV – Conclusion ... 51
1. Concluding Remarks... 51
2. Future work ... 53
References ... 54
Appendixes ... 65
Appendix I. Standard curves ... 65
Appendix II. Molecular weights’ index ... 67
LIST OF TABLES
Table 1. Brand names, sources/producing methods and health promoting applications of some commercially available nuraceuticals/health foods/functional foods produced from fish
protein hydrolysates. ... 14
Table 2. Evolution of protein content (% DW) of FPH samples, as well as commercial CPH and YE used in their formulations. Means with the same letters indicates values not significantly different (p > 0.05), with A, B, C comparing the same fermentation time and a, b, c, d comparing the same FPH sample. ... 26
Table 3. DH (%) values of FPH samples. Means with the same letters indicates values not significantly different (p > 0.05), with A, B, C comparing the same fermentation period and a, b, c, d comparing the same FPH sample. ... 28
Table 4. Summary of initial and final values of antioxidant activity obtained in all FPH. ... 52
Table 5. List of MW of the peptides in 1 % FPH samples... 67
Table 6. List of MW of the peptides in 2 % FPH samples... 68
LIST OF FIGURES
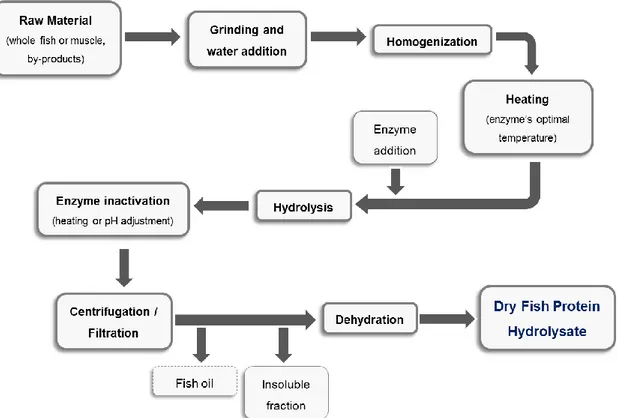
Figure 1. Diagram of fish proteins hydrolysates production by enzymatic hydrolysis. Adapted from Batista, 2011. ... 5
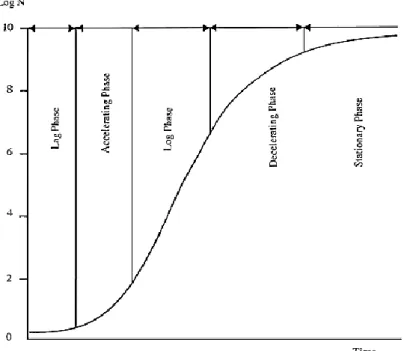
Figure 2. The microbial growth curve, with Log N (logarithmic number of microorganisms) as a function of time. Adapted from Adam & Moss, 2008. ... 7
Figure 3. Growth of Bacillus sp. strain in three culture media. ... 24
Figure 4. Effect of CPH concentration in the protease production. The same letter indicates values not significantly different (p > 0.05), with A, B, C comparing the same fermentation time and a, b, c comparing the same type of culture medium. ... 25
Figure 5. . Evolution of protein recovery in all FPH samples. The same letter indicates values not significantly different (p > 0.05), with A, B, C comparing the same fermentation time and a, b, c, d comparing the same type of culture medium ... 27
Figure 6. Gel filtration chromatogram showing the molecular weight distribution of hydrolysates at 72 hours of hydrolysis. Numbers represent the peaks’ MW classes: 1 corresponds to ribonuclease A (13 700 Da), 2 corresponds to aprotinin (6 500Da), 3 corresponds to angiotensin I (1 296 Da), 4 corresponds to triglycine (189 Da) and 5 corresponds to glycine (75 Da). and represent the peaks corresponding to MW higher than 400 Da and MW between 200 and 75 Da, respectively. ... 29
Figure 7. Fractions of the FPH samples according to their molecular weight range for different times of fermentation, 0 hours (blue), 24 hours (green), 50 hours (red) and 72 hours (purple). SD values are not represented, since gel filtration was only performed once for each FPH... 30
Figure 8. DPPH radical scavenging activity of 1 %, 2 % and 4 % FPH at the initial time (0 hours), CPH and YE... 31
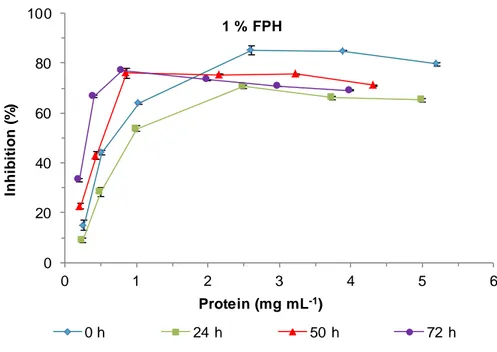
Figure 9. DPPH inhibition of 1 % FPH samples at different times of fermentation. ... 32
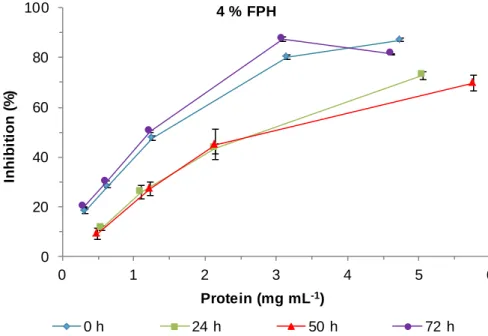
Figure 11. DPPH inhibition of 4 % FPH samples at different times of fermentation. ... 33
Figure 12. Time course of EC50 values of FPH samples. SD values were obtained by four combinations of absorbance values recorded during the DPPH test. The sam e letter indicates values not significantly different (p > 0.05), with A, B, C comparing the same fermentation time and a, b, c comparing the same FPH sample. ... 34
Figure 13. ABTS radical scavenging activity of 1 %, 2 % and 4 % FPH at the initial time (0 hours), CPH and YE... 35
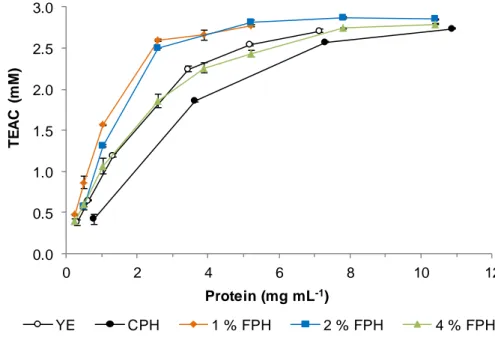
Figure 14. TEAC of 1 % FPH at different times of fermentation. ... 36
Figure 15. TEAC of 2 % FPH at different times of fermentation. ... 37
Figure 16. TEAC of 4 % FPH at different times of fermentation. ... 37
Figure 17. Evolution of ABTS radical scavenging activity for all samples at 5 mg FPH mL-1. The same letter indicates values not significantly different (p > 0.05), with A, B, C comparing the same fermentation time and a, b, c, d comparing the same FPH sample... 38
Figure 18. Ascorbic acid equivalent reducing power of 1 %, 2 % and 4 % FPH, CPH and YE at the initial time (0 hours) as a function of protein concentration. ... 39
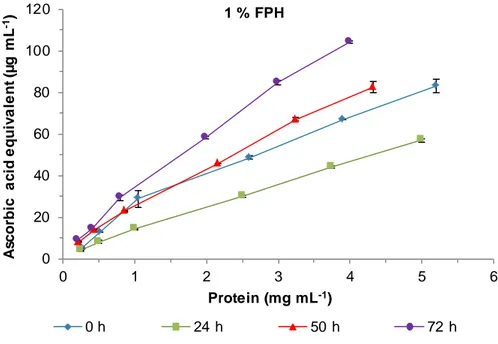
Figure 19. Ascorbic acid equivalent reducing power of 1 % FPH at different times of fermentation. ... 40
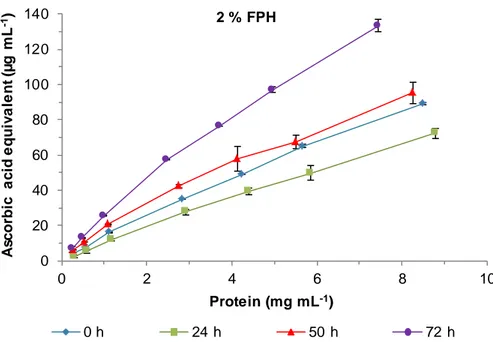
Figure 20. Ascorbic acid equivalent reducing power of 2 % FPH at different times of fermentation. ... 41
Figure 21. Ascorbic acid equivalent reducing power of 4 % FPH at different times of fermentation. ... 41
Figure 22. Evolution of reducing power for all samples at 10 mg FPH mL-1. The same letter indicates values not significantly different (p > 0.05), with A, B, C comparing the same fermentation time and a, b, c, d comparing the same FPH sample. ... 42
Figure 23. Cu chelating activity of 1 %, 2 % and 4 % FPH at the initial time (0 hours), CPH
and YE as a function of protein concentration... 43
Figure 24. Cu2+ chelating activity of 1 % FPH samples at different fermentation periods ... 44
Figure 25. Cu2+ chelating activity of 2 % FPH samples at different fermentation periods. .... 44
Figure 26. Cu2+ chelating activity of 4 % FPH samples at different fermentation periods. .... 45
Figure 27. Evolution of Cu2+ chelating activity for all samples in 1 mg FPH mL-1. The same letter indicates values not significantly different (p > 0.05), with A, B, C comparing the same fermentation time and a, b, c, d comparing the same FPH sample. ... 45
Figure 28. Fe2+ chelating activity of 1 %, 2 % and 4 % FPH, CPH and YE at the initial time (0 hours) as a function of protein concentration. ... 47
Figure 29. Fe2+ chelating activity of 1 % FPH samples at different times of fermentation... 47
Figure 30. Fe2+ chelating activity of 2 % FPH samples at different times of fermentation... 48
Figure 31. Fe2+ chelating activity of 2 % FPH samples at different times of fermentation... 49
Figure 32. Evolution of Fe2+ chelating activity for all samples, when concentration is 10 mg FPH mL-1. The same letter indicates values not significantly different (p > 0.05), with A, B, C comparing the same fermentation time and a, b, c, d comparing the same FPH sample... 49
Figure 33. Calibration curve for SuperdexTM peptide 10/300 GL, and its respective equation (y = -0.2527x + 1.1909, R2=0.989, where y represents the kav coefficient and x represents the logarithmic value of MW). ... 65
Figure 34. Trolox calibration curve and its respective equation (y = 0.0361x – 4.0742, R2=0.999, where y represents the percentage of inhibition, or disappearance of ABTS, and x represents the concentration of Trolox). ... 66
Figure 35. Ascorbic acid standard curve and its respective equation (y = 10.559x + 0.0037, R2= 0.9992, where y represents the absorbance and x the concentration of ascorbic acid). 66
Figure 36. Gel filtration chromatograms showing the molecular weight distribution of hydrolysates at 0, 24 and 50 hours of fermentation. ... 70 Figure 37. Gel filtration chromatograms showing the evolution of molecular weight distribution of 1 %, 2 % and 4 % FPH. ... 71
Figure 38. Gel filtration chromatogram showing the molecular weight distribution of YE. .... 71
LIST OF ABBREVIATIONS
ABTS – 2,2'-azino-bis(3-ethylbenzothiazoline-6-sulphonic acid) CFU – Colony-forming Units
CPH – Cod Protein Hydrolysate DH – Degree of Hydrolysis
DPPH – 2,2 – Diphenyl – 1 – picrylhydrazyl DW – Dry Weight
EC50 – Half Minimal Effective Concentration
Ferrozine – 3 – (2 – Pyridyl) – 5,6 – bis (4 – phenyl – sulphonic acid) – 1,2,4 - triazine FITC – Fluorescein isothiocyanate
FPH – Fermentative Protein Hydrolysate FPLC – Fast Protein Liquid Chromoatography MW – Molecular Weight
OD – Optical Density
OPA – o – Phthaldialdehyde PCA – Plate Count Agar PV – Pyrocatechol Violet
ROS – Reactive Oxygen Species TCA – Trichloroacetic Acid
TEAC – Trolox Equivalent Antioxidant Capacity TFA – Trifluoroacetic Acid
Tris – Tris - (hydroxymethyl) - aminomethane TSA – Triptic Soy Agar
CHAPTER I-INTRODUCTION
1. OBJECTIVES
The purpose of the present study was to produce fermentative protein hydrolysates from a commercial cod protein hydrolysate, using a marine proteolytic strain, presumptively a Bacillus sp.. The work consisted in perform the bacterial growth under controlled conditions of shaking and temperature, in liquid culture medium with different concentrations of cod protein hydrolysate (1 %, 2 % and 4 %), yeast extract (0.5 %) and sucrose (0.5 %), at three different fermentation periods: 24, 50 and 72 hours.
It was also an objective the evaluation of the new hydrolysates about their protein content, protein yield, degree of hydrolysis, molecular weight distribution and antioxidant capacity (using five different methodologies), in order to verify in which extent the fermentation period and concentration of cod protein hydrolysate influenced the aforementioned properties and characteristics.
2. LITERATURE REVIEW
2.1. Fish industry and by-products valorization
Fish is a very important commodity and an essential source of protein in many countries worldwide. Halweil & Nierenberg (2008) estimated that worldwide one billion people depend on producing, processing and trading fish for their subsistence. Over the last decades, fish provision has transformed in the context of globalization, as fishermen are producing more fish for consumers living at large distances and consumers increasingly consume fish and fish products (Oosterveer, 2008). With the increasing of world population and a world catch of fish on the verge of exceeding the estimated sustainable limits of the suggested 100 million tons/year, there is an increasing need to utilize sea resources with
more efficiency and foresight, as well as it has led to an increase in aquaculture production (Kristinsson & Rasco, 2000; Cardoso & Nunes, 2013).
According to FAO (2012), capture fisheries and aquaculture supplied the world with about 148 million tons of fish in 2010, of which about 86 % was utilized as food, and preliminary data for 2011 indicate increased production of 154 million tons, of which 85 % was destined as food. In 2009, fish accounted for 16.6 % of the world population’s intake of animal protein and 6.5 % of all protein consumed. Globally, fish provides about 3.0 billion people with almost 20 % of their intake of animal protein, and 4.3 billion people with about 15 % of such protein.
The fishing industry rejects approximately 75 % of total weight, although this amount of waste still has many components that could be reutilized. These large quantities of waste can create serious pollution and disposal problems, whereas some of the discarded parts are usually composted or thrown again in the ocean. The discards’ portions that are returned to the sea are generally died or dried when returned to the ocean, which can lead to alterations on marine trophic chains (Bozzano & Sardà, 2002). Besides, fish industry is made up of many small business scattered in space, as well as supermarkets and hypermarkets which generate large amounts of waste, creating logistical problems and difficulties in setting wasted recovery units (Penven et al., 2013).
According to their origin, fishing discards can be classified as wastes of fish processing, like guts, skin, scales and bones, and residual flesh and undervalued species (Benjakul & Morrissey, 1997; Hsu, 2010). Fish and fishery products represent a valuable source of protein and essential micronutrients for balanced nutrition and good health, and their wasted by-products are a good source of bioactive compounds. However, these wasted by-products and their potential application has been great subject of attention lately. The recovery of these by-products and using them as functional ingredients in food matrix is an exciting and promising alternative. Examples of these applications are the preparation of surimi, protein concentrates, fish-meal, fish oil and protein hydrolysates (Gildberg, 2001; Sucasas, 2011).
In order to utilize these fish processing by-product wastes, bioactive compounds can be extracted and purified with various technologies, by helping the improvement of human health and solving the pollution and disposal problems as well (Šližytė et al., 2009; Chalamaiah et al., 2012). Proper utilization of protein rich fish processing wastes and underutilized fish species could be achieved by converting these materials into fish protein hydrolysates.
2.2. Fish protein hydrolysates
Proteins in human diet are an acknowledged source of physiologically active components, which have a positive impact on the body’s function after gastrointestinal digestion. The production of bioactive peptides can be achieved by solvent extraction, enzymatic hydrolysis and microbial fermentation of food proteins (Kim & Wijesekara, 2013).
Protein hydrolysates are defined as proteins that are chemically or enzymatically broken down into free amino acids and/or peptides, which can present a large range of molecular weight depending on the greater or lesser degree of hydrolysis (Kristinsson & Rasco, 2000). Nowadays, fish protein hydrolysates with good nutritional composition, amino acid profile, and antioxidant activities have gained great attention of food scientists. Protein hydrolysates are used as readily available sources of protein for humans and animals due to their good functional properties (Neklyudov et al., 2000).
Due to the increasing interest of consumers in finding antioxidants from natural sources, which may have less potential hazard than synthetic ones, research on fish protein hydrolysates exerting antioxidant activity has gained a great interest. Antioxidants are generally employed to prevent lipid oxidation in foods, which avoids the formation of toxic compounds and undesirable odors and flavors (Lin & Liang, 2002). Biological and physic-chemical properties of hydrolysates depend on the protein substrate used, enzyme specificity, hydrolysis conditions and degree of hydrolysis (Rafik et al., 2010).
2.2.1. Production of fish protein hydrolysates Chemical hydrolysis of fish proteins
Chemical hydrolysis of fish proteins is achieved by cleaving peptide bonds in a relatively inexpensive and simple way. However, there are limitations to use protein hydrolysates obtained by this method in food ingredients, since it is a difficult process to control and leads to products with variable chemical composition and functional properties. The hydrolysis performed with strong chemicals and solvents at extreme temperatures and pH conditions may generate products with reduced nutritional qualities, restricted usage as flavor enhancers and poor functionality (Kristinsson & Rasco, 2000).
Acid hydrolysis
Acid hydrolysis of fish protein achieves higher yields and involves reaction of fish proteins with hydrochloric or sulfuric acid, at high temperature (and often high pressure), leading to a complete hydrolysis of proteins. Then, the hydrolysate is neutralized with sodium hydroxide to pH 6.0 to 7.0, which can lead to a formation of a large amount of salt (Thakar et al., 1991, Batista, 2011). The salt formation in the neutralization stage can make the product unpalatable and interfere with functionality in food systems; furthermore it leads to high ash content in the obtained hydrolysates. Another disadvantage of acid hydrolysis is the destruction of amino acids, particularly tryptophan, which is an essential amino acid. The acid hydrolysis is utilized to convert underutilized and secondary raw material from fisheries into fertilizer due to the low production cost and resulting extensive hydrolysis (Kristinsson & Rasco, 2000, Batista, 2011).
Alkaline hydrolysis
The use of alkaline reactants, usually sodium hydroxide, to hydrolyze proteins often results in poor functionality, and can adversely affect the nutritive value of the product. Alkaline hydrolysis has primarily used fish protein concentrate as initial substrate, being rapidly cleaved into large water-soluble polypeptides, followed by further degradation at a slower rate. However, alkali treatment can aid in modifying the properties of insoluble fish protein concentrate. Tannenbaum et al. (1970a, 1970b) developed a small-scale batch process that utilizes pH 12.5 and 95 ºC for 20 minutes, resulting in a product with large peptides but with an improvement in functionality. Several detrimental reactions occur during the alkaline hydrolysis. When the hydrogen is abstracted from the alpha carbon of an amino acid, racemization of L-aminoacids occurs, producing D-aminoacids which are not absorbed by humans. Also, disulfide bonds are split with loss of amino acids like cysteine, serine and threonine. Some of these elimination and addition reactions may lead to the formation of toxic substances (e.g., lysinoalanine), that are highly reactive products having an inhibiting effect on proteolytic enzymes, reducing the rate of hydrolysis (Kristinsson & Rasco, 2000).
Enzymatic hydrolysis of fish proteins
Enzymatic hydrolysis of proteins can be performed using endogenous enzymes (proteases existing in fish) or exogenous enzymes, added to promote the hydrolytic process.
The enzyme specificity should be taken into consideration, once it strongly influences the molecular size and hydrophobicity of the hydrolysate (Kristinsson & Rasco, 2000, Batista, 2011). The hydrolysates production involves fish grinding and water addition. When endogenous enzymes are used, the process is prolonged and the protein hydrolysis requires longer control, not ensuring to obtain products with a uniform quality standards. As to enzymatic hydrolysis with exogenous enzymes, these can be selected according to the intended characteristics for the product (Batista, 2011). The hydrolysis oc curs under moderate conditions, avoiding extreme conditions of pH and temperature, which can compromise the nutritive quality of the hydrolysate (Kristinsson & Rasco, 2000). In figure 1 is presented a preparation scheme of fish protein hydrolysate.
The fish protein hydrolysate consists on grinding the material, followed by the addition and homogenization. This homogenization is very important to allow an easy access of the enzymes to the proteins. Then, the mixture is heated to the optimal temperature for the occurrence of enzymatic reaction, followed by pH adjustment. The hydrolysis depends on the substrate concentration and the enzyme/substrate affinity, pH, temperature and time of reaction. Then, the enzymatic reaction is stopped by thermal (75 - 100 ºC during 5 – 30
Figure 1. Diagram of fish proteins hydrolysates production by enzymatic hydrolysis. Adapted from Batista, 2011.
minutes) or chemical (by increase or decrease of pH) inactivation. Centrifugation of the mixture allows the recovery of the hydrolysates, resulting in two fractions: one aqueous phase, which contains the hydrolyzed material, and an insoluble phase. The dehydration of the aqueous supernatant is usually made resort a spray dryer (Batista, 2011; Kristinsson & Rasco, 2000).
Fermentative hydrolysis
The application of microbials, in addition to enzymatic hydrolysis, is an emerging process that provides a natural technology applicable to the production of bioactive peptides. The fermentative process for the production of protein hydrolysates requires natural or added microorganisms (starter cultures), that during their growth hydrolyze sugars and proteins available in their surrounding medium. The hydrolysis, carried out by extracellular microbial proteases, results in a wide range of peptides with different amino acid sequences with interesting bioactive properties. There is a wide variety of proteases that can be produc ed by fermentative hydrolysis, although their yields, i.e. the degree of hydrolysis (DH), depend upon the microorganism species which produces them, the nutritional composition and the growth conditions (Venugopal, 1994).
Microbial growth
Microbial growth is an autocatalytic process: no growth will occur without the presence of at least one viable cell and the rate of growth will increase with the amount of viable biomass present, and it follows an exponential rate (Adam &Moss, 2008). The rate of growth usually follows the trend showed in figure 2.
By analyzing the growth curve, three major phases can be distinguished. In the first, the lag-phase, the inoculum is adjusting to the new environment, synthetizing enzymes required for cleaving the nutrients in the medium, so there is no apparent growth. The exponential or logarithmic phase, which follows, is characterized by an increase in cell numbers. Accordingly, the slope of the growth curve in this phase will equal the microorganisms specific growth rate, which itself will depend on intrinsic and extrinsic factors. Lastly, the changes in the medium resulting from the exponential growth, bring this phase to an end as the nutrients have ran out, or inhibitory metabolites accumulate, leading the
culture to enter the stationary phase The intrinsic parameters that influence microbial growth are pH, moisture content, oxidation-reduction potential and nutrient content, while the extrinsic factors t are temperature, relative humidity, presence and concentration of gases (Adam & Moss, 2008).
Microbial proteases
For practical applications, proteases are produced from high-yielding microbial strains and under controlled conditions of fermentation. Depending upon the specific site of cleavage, these proteases can be divided into exoproteases, if they cleave the protein substrate at the N-terminal (aminopeptidases) or at the C-terminal (carboxyl peptidases) end; or endoproteases (or proteinases), if they cleave the peptides bonds within protein molecules, at specific residues to produce relatively large peptides, whic h give them a major industrial importance (Venugopal, 1994).
Apart from their sites of action on the protein, the enzymes are classified as acidic, neutral or alkaline, depending on the pH requirements for their optimal activities. Acid proteases are commonly produced by molds and yeasts, while bacteria secrete neutral or alkaline proteases. Based on their mechanism of action and sensitivities to various types of inhibitors, proteases can be classified in four major classes, which are designated by the
Figure 2. The microbial growth curve, with Log N (logarithmic number of microorganisms) as a function of time. Adapted from Adam & Moss, 2008.
principal functional group in their active site: serine, thiol, metallo and aspartic proteases, which have serine, thiol, metal ion or aspartic acid, respectively, in their active sites (Venugopal, 1994, Kristinssom, & Rasco, 2000).
Serine proteinases are produce by bacteria, yeasts and molds and have nucleophilic serine residue in their active sites. Apart from this, these proteinases are also distinguished by having essential aspartate and histidine residues, and they include trypsin-like proteinases and alkaline proteinases. Trypsin-like proteinases have an optimum pH of 8 and may also possess esterase and amidase activities. These enzymes are commercially important, since they are used in detergent industry. Thiol proteinases reduce compounds like cysteine but are inhibited by oxidizing agents. Aspartic proteinases have several industrial applications and show specificity towards aromatic or bulky amino acid residues at both sides of the peptide bond. Their optimal pH is at 3 – 4 and are insensitive to inhibitors like difluorophosphate, parachloro mercurybenzoate and ethylenediamine tetraacetic acid. As for metalloproteinases, they involve a metal ion in their catalytic mechanisms, which can be either neutral or alkaline. Several bacteria and fungus produce this type of proteinases (Venugopal, 1994, Kristinssom, & Rasco, 2000, Gupta et al., 2002).
The secretion of proteinases by the microorganisms occurs at minimal levels during their exponential growth, but increases with a decrease in nutrients and reaches a maximum towards the late exponential/early stationary phase (Venugopal, 1994).
Microbial proteases have great advantages in food application, which includes their low cost of production, less time required for enzyme isolation, possibilities for mass production and amenability of the organisms to genetic manipulations to improve the enzyme yields. The applications of these enzymes include production of oriental foods, bread-making, cheese ripening, meat tenderization and chill-proofing beer, as well as detergent industry and diagnostic purposes (Venugopal, 1994).
Uses of microbial proteases in the production of fish protein hydrolysates
Many authors have reported that microbial enzymes have an improved potential compared to plant enzymes, due to their ability to solubilize proteins. Nevertheless, it is essential that microorganisms used are safe, if the newly formed hydrolysates are intended for food applications (Venugopal, 1994).Kilara (1985) reported that neutral and alkaline proteases from bacteria were about 140 % more efficient than papain, and Hale (1969) showed that hydrolysis of raw fish with Bacillus subtilis protease at pH 8.5 gave high yield of soluble product, having an excellent balance of amino acids. In a more recent study, performed by Martínez-Alvarez et al. (2008), it was reported the production of highly active
CGRP-like molecules by enzymatic fish hydrolysis and subsequent treatment with Saccaromices cerevisiae. These results suggest that successful solubilization of fish proteins could be achieved by employing microbial proteases.
2.2.2. Chemical composition of fish protein hydrolysates
Chemical composition of fish protein hydrolysates is important to human health in a nutrition perspective, and it depends on the fish species and the enzymatic or chemical hydrolysis which originated them. Many researchers reported the protein content of these products ranged between 60 % to 90 % of its total composition (Dong et al., 2005; Thiansilakul et al., 2007; Souissi et al., 2007; Ovissipour et al., 2009; Khantaphant et al., 2011). This high protein content of fish protein hydrolysates demonstrates its potential use as protein supplements for human nutrition.
The removal of lipids from the hydrolysates is very important, due to the development of unpleasant odors, rancidity and non-enzymatic browning caused by Maillard reactions (Batista, 2011). Overall, this stage of fish protein hydrolysates production leads to a fat content below 5 %, as it has been reported by Sathivel et al. (2005) and Souissi et al. (2007), among others.
Protein hydrolysates from various fish proteins contain moisture below 10 %, which is related to the type of sample and to the higher temperatures used during the process of evaporation and spray drying (Dong et al., 2005; Kristinsson & Rasco, 2000; Foh et al., 2011).
The relatively high ash content of fish protein hydrolysates is due to usage of added acid or base for adjustment of pH of reaction medium (Dong et al., 2005; Choi et al., 2009).
2.2.3. Properties of fish protein hydrolysates
Functional and physicochemical properties
The functional properties of fish proteins hydrolysates are important, especially if they’re intended to use as ingredients in food industry, and are related to their molecular size, composition and amino acids sequence, electrostatic charges, water affinity, physicochemical properties of the parent protein used as substrate, protease specificity,
hydrolysis conditions and reaction time. However, the composition and processing parameters also interferes in the functional properties of hydrolysates (Pires & Batista, 2013). Enzymatic hydrolysis of fish proteins generates a mixture of free amino acids, di-, tri- and oligopeptides, increasing the number of polar groups, which promotes the interaction with water, i.e. increased solubility, which also plays an important role in other functional properties, like foaming and emulsifying capacity (Chobert et al., 1988; Mutilangi et al., 1996, Kristinsson & Rasco, 2000).
The emulsifying capacity and stability of fish protein hydrolysates are related with the molecule hydrophilic and hydrophobic properties, giving them the capacity to constitute oil-water emulsions (Batista, 2011; Kristinsson & Rasco, 2000). Kristinsson & Rasco (2002) referred that the emulsifying properties generally decreased with the increase of the degree of hydrolysis, due to the formation of small peptides with less surface activity and less hydrophobicity. Previous studies (Klompong et al., 2007) also found a connection between solubility and emulsifying capacity, as hydrolysates with high solubility can rapidly diffuse and adsorb at the interface.
Other functional property important for the application of protein hydrolysates in the food industry (especially meat and confectionery) is fat binding capacity, which depends on protein density, degree of hydrolysis, specificity of the hydrolyzing enzyme and hydrophobicity (Kinsella, 1976; Haque, 1993; Kristinsson & Rasco, 2000; Gbogouri et al., 2004, Batista, 2011).
Foams are very similar to emulsions, i.e. they depend on the surface properties, and fish protein hydrolysates usually have good foaming capacity and make stable foams, due to their amphiphilic nature (Batista, 2011; Pires & Batista, 2013).
Proteins hydrolysis also modifies their ability to absorb and bind water molecules, giving a good ability to fish protein hydrolysates to bind and hold water. This is due to the increase of terminal carboxyl and amino groups, which produces a substantial effect on the amount of absorbed water and strength of the sorption bond, making them hygroscopic (Pires & Batista, 2013; Kristinsson & Rasco, 2000)
The bitterness of protein hydrolysates have been systematically reported by many authors, which constitutes a great disadvantage when their utilization in human food is intended. This unpleasant sensory characteristic has been attributed to the presence of hydrophobic amino acids, which are exposed by hydrolysis, and that may contact with taste buds (Batista, 2011). Nevertheless some studies have been made in an attempt to reduce the bitterness of fish protein hydrolysates, like those by Noguchi et al. (1975), which isolated acidic oligopeptides from fish protein hydrolysates that possessed a flavor-enhancing quality
like that of umami taste, and Jao & Ko (2002), who obtained tuna hydrolysates through ultrafiltration and reverse osmosis, also with aroma and umami taste.
Biological Properties
Bioactive peptides also exist in fish protein hydrolysates, although they are inactive when included in the parent protein. Nevertheless, their physiological activities can be exhibited when they are freed by hydrolysis during digestion or food processing (Batista, 2013).
A large number of peptides and amino acids prepared from food proteins have shown anticancer properties, although studies carried out with fish protein hydrolysate are very few. In a study performed by Picot et al. (2006), the antiproliferative activity of various commercial fish protein hydrolysates, of blue whiting, cod, plaice and salmon exhibited significant growth inhibitors against two human breast cancer cell lines. Bukowski (2003) also showed that peptides prepared from shark cartilage had antigiogenic activity when they were tested in vitro and in vivo.
Antimicrobial peptides are small-molecular-weight peptides isolated and purified from living organisms, involved in natural defense mechanisms against pathogens. These peptides can be obtained from fish proteins by hydrolysis, like in the work performed by Liu et al. (2008), in which a cysteine-rich peptide isolated by digestion of oyster, with Alcalase and bromelain, presented antimicrobial activity against gram positive and negative bacteria, as well as fungus.
Hyperlipidemia (high levels of lipids and/or lipoproteins in blood) is one of the many causes of cardiovascular diseases, and many studies have been made in order to discover new peptides with hypocholesteremic activity. Wergedahl et al. (2004) prepared fish protein hydrolysates from salmon frames, which showed a cholesterol-lowering effect involving a decrease of plasma cholesterol in Zucker rats.
In fish protein hydrolysates obtained from cod, sardine and shrimp by-products has been reported the presence of peptides with low molecular weight that stimulate protein biosynthesis, control of intestinal motility and segregate digestive enzymes (Ravallec -Plé et al., 2000).
Some fish protein hydrolysates are also provided with the ability to inhibit the action of the Angiotensin I Converting Enzyme (ACE), an enzyme present in many biological systems which exerts regulatory control over arterial blood pressure. The inhibition of ACE is one of the methods to reduce blood pressure, and some peptides have been reported to cause a similar effect on blood pressure such as synthetic drugs (Gálvez, et al., 2013). It is thought
that ACE inhibition is related with the amino acid sequence, specially the tripeptide sequence at the C-terminal end. It is suggested that the presence of hydrophobic amino acids residues in this region favors the ACE inhibitory activity of the peptides, while hydrophilic peptides show weaker affinity for the ACE active sites (Ryan, 2011; Gálvez, et al., 2013). In a study performed by Balti et al. (2010) with protein hydrolysates of cuttlefish, it was reported that the highest ACE inhibitory activity was displayed by the hydrolysate with the highest degree of hydrolysis.
Antioxidant Properties
One of the greatest concerns of food industry is the lipid oxidation, in which the resultant oxidized compounds are responsible for modifications in flavor (rancidification), color, texture, and even losses of nutritional value. Also, during cellular respiration of aerobic organisms (human included), reactive oxygen species (ROS), such as superoxide anion (O2
-), singlet oxygen (O2*) and hydroxyl radicals (˙HO), along with free radicals and peroxides
generated. Nevertheless, the prevention of their harmful effects, as well as of transition metals, is carried out by endogenous antioxidants, like enzymes, tocopherol, ascorbic acid and peptides. However, with advancing age, fatigue, excessive caloric intake, high fat diets and environmental pollutants, the balance between ROS, free radicals and antioxidants in human body can change. Beyond that, the attraction between unpaired electrons in valency of ROS and free radical and electrons from other substances, may lead to oxidative stress in the cells or tissues. For these reasons, is necessary to increase the amount of antioxidants in the human body, which led to a larger development of dietary antioxidant supplements and search for natural antioxidants (Zahara et al., 2007; Batista, 2013).
Proteins can act as natural and multifunctional antioxidants by inhibiting several different oxidation pathways, including inactivation of ROS, scavenging free radicals, chelation of pro-active transition metal ions, like Fe2+ and Cu2+, and nonradical reduction of hydroperoxydes to nonreactive hydroxydes (Jensen et al., 2013). Peptides usually exhibit stronger antioxidant activity than free aminoacids due to their higher stability, which doesn’t initiate or propagate further oxidative reactions (Elias et al., 2008). Regarding free amino acids, their radical scavenging potential depends on its functional side chain, but they are limited by the tertiary structures of peptides or proteins, where they can be inaccessible to pro-oxidants. However, tertiary disruption can be achieved by food processing, fermentation or gastrointestinal digestion, freeing amino acids and allowing them to exhibit their antioxidant capacity (Jensen et al., 2013).
Many authors referred that different amino acid residues may have their specific roles in peptides antioxidant activity, which can be by chelation of transition metals and/or scavenging free radicals. In a review presented by Chalamaiah et al. (2012), it is enhanced the importance of hydrophobic amino acids and one or more residues of histidine, proline, methionine, cysteine, tyrosine, tryptophan, valine, leucine and phenylalanine in the antioxidant activity of peptides. The presence of hydrophobic sequences in the peptides allows them to interact with lipid molecules and could scavenge by donating protons to lipid derived radicals. The aromatic amino acids, tyrosine and phenylalanine, as well as histidine, methionine and cysteine are indicated as direct radical scavengers. Tyrosine’s antioxidant activity is due to the capability of phenolic groups to serve as hydrogen donors; the imidazole group in histidine has the proton-donation ability; methionine is prone to oxidation of the methionine sulfoxide; cysteine donates the sulfur hydrogen. The imidazole group in histidine has also been reported has metal chelator. Acidic and basic amino acids may also play an important role in Fe2+ and Cu2+chelation (Carrasco-Castilla et al., 2012).
In recent years, several studies have described the antioxidant activity of protein hydrolysates from fish sources, like yellowfin sole (Jun et al., 2004), cobia skin (Yang et al., 2008), tuna liver (Je et al., 2009), sardinelle by-products (Bougatef et al. 2010) and backbone from Baltic cod (Zelechowska et al., 2010).
2.2.4. Applications of fish protein hydrolysates Food industry and nutritional value
Fish protein hydrolysates are good nutritional supplements as bioactive compounds and can be easily absorbed and utilized for various metabolic activities (Chalamaiah et al., 2012). These peptides have potential in the food industry, especially protein supplements, bakery products, appetizers, cookies and soups. This application of fish protein hydrolysates resides in its capacity as flavor enhancers, due to their umami taste (Batista, 2011).
According to Chalamaiah et al., (2012), in many countries, traditional and commercial preparations of fish protein hydrolysates are currently used as health nutraceutical foods. In table 1 is shown a short list of brand names, sources/producing methods and health promoting applications of commercially available nutraceuticals/health foods/functional foods in different countries, prepared from fish protein hydrolysates.
The usually balanced amino acid profile, good digestibility, quick intestinal absorption and bioactive peptides content, give fish protein hydrolysates a good nutritional value,
leading to their application in fish food. This inclusion of fish protein hydrolysates in fish food can improve the nitrogen retention and increase the feed conversion ratio for fish than food which contained only fish meal. In a study of Refstie et al. (2004) it was reported that the fish protein hydrolysate up to 15 % stimulated the consumption of food, increased the protein retention and digestibility as well as improved the growth of juvenile salmons (Batista, 2011).
Table 1. Brand names, sources/producing methods and health promoting applications of some commercially available nuraceuticals/health foods/functional foods produced from fish protein hydrolysates. Product brand name Sources / Producing methods Nutraceutical
applications Country Reference
Seacure®
Prepared by hydrolyzing deep
ocean white fish
Dietary supplement helps to support the cells in the gastrointestinal tract and regulate bowel functions.
USA and Canada Marchbank et al. (2008) Amizate® Produced from Atlantic salmon fish proteins by autolysis
Sports nutrition (supports the body’s muscle anabolism and
metabolic recovery). North America Nesse et al. (2011) Stabilium® 200 Prepared from Molva dypterygia by autolysis
Supports the body’s response to stress and provides nutritional support for memory
and cognitive function
UK Guerard et al. (2010) PROTIZEN® Produced by enzymatic hydrolysis of white fish proteins
It is ‘‘mood food’’ and dietary supplement to fight against
stress and its symptoms (weight disorders, work pressure, sleep troubles, concentration difficulties and
mood troubles).
UK Guerard et al. (2010)
Microbial Culture Media
Several studies have been made in order to use fish protein hydrolysates in the place of commercial peptones. Triki-Ellouz et al. (2003) reported high protease activity and bacterial growth when fish protein hydrolysate is hydrolyzed by Pseudomonas aeruginosa MN7, and Ovissipour et al. (2009) revealed that fish protein hydrolysates obtained from yellowfin tuna fisheries by-product, produced with Alcalase which has higher content of small peptides, was more auspicious for the growth of many bacteria, among them Psedomonas aeruginosa and Bacillus subtilis. In a recent study performed by Safari et al. (2012), also with yellowfin tuna heads, it was also reported that several strains of Lactobacillus genus had a higher specific growth rate with fish hydrolysates produced with Alcalase, which also had the highest degree of hydrolysis. The utilization of fish protein hydrolysate of round sardinella as culture media for Rhizopus oryzae fungus to produce lipase was studied by Ghorbel et al. (2005). In this experiment, a higher production of lipase was achieved with the hydrolysate than a standard culture medium, where the nitrogen source was soya peptone.
CHAPTER II-MATERIALS AND METHODS
1. MATERIALS
The materials used in this study were commercial cod protein hydrolysate (CPH), provided by Danish Fish Protein, Denmark, yeast extract (YE) purchased from OxoidTM (Oxoid Limited, Basingstoke, UK) and sucrose provided by AnalaR® (VWR International - Material de Laboratório, Lda., Carnaxide, Portugal). Fluorescein isothiocyanate (FITC), o-Phthaldialdehyde (OPA), 2,2 – Diphenyl – 1 – picrylhydrazyl (DPPH), 2,2'-azino-bis(3-ethylbenzothiazoline-6-sulphonic acid) (ABTS), pyrocatechol violet and 3-(2-pyridyl)-5,6-bis(4-phenyl-sulfonic acid)-1,2,4-triazine (ferrozine) were purchased from Sigma-Aldrich® (St Louis, MO, USA). The acetonitrile and trifluoroacetic acid (TFA) used in the cleaning in place system (CIP) of the FPLC ÄKTA system were purchased from Merck (Merck KGaA, Darmstadt, Germany) All other chemicals were of analytical grade.
2. METHODS
2.1. Hydrolysates production
2.1.1. Preparation of culture media and microbiological assay
Fish protein hydrolysates were prepared by a fermentative process using a proteolytic strain, presumptively a Bacillus sp., previously isolated from a clam Venerupis philippinarum. Three different culture media were used, containing 0.5 % sucrose (w/v), 0.5 % yeast extract (w/v) and 1 %, 2 % and 4 % CPH (w/v). All culture media were coldly dissolved and sterilized at 121 ºC for 15 minutes.
Starter culture of Bacillus sp. was plated in Tryptic Soy Agar medium (TSA) and incubated at 30 ºC for 24 hours. After that, 250 µL of the inoculum with 104 CFU mL-1 were transferred to an 500 mL-Erlenmeyer flasks containing 250 mL of each sterilized medium and incubated at 30 ºC with constant agitation (150 rpm). Incubation periods lasted for 24, 50 and 72 hours, with 0.1 mL of the inoculum being plated in Plate Count Agar (PCA) and placed in an incubator at 30 ºC for two days, in order to evaluate the microbial population in the culture medium.
Each assay was made in duplicate.
2.1.2. Optical Density (OD) measurements and separation of the bacteria from the medium
After each incubation period, the OD of the fermentative protein hydrolysate (FPH) was measured in a UNICAM UV – visible UV2 spectrophotometer (Thermo Scientific, Karlsruhe, Germany)at 600 nm in order to evaluate the microbial population. Then, the medium was centrifuged at 10 000 rpm for 5 minutes, at room temperature in a Kubota 6800 centrifuge (Kubota Corp., Tokyo, Japan), to separate the biomass. The supernatant was filtrated in a Millipore filtration system (EMD Millipore Corporation, USA), equipped with a filter with 0.45 µm pore diameter to remove remaining bacteria, and identified as 1 % FPH, 2 % FPH and 4 % FPH.
2.1.3. Supernatant storage, concentration and freeze-drying
An aliquot of the total volume of the supernatant (approximately 5 mL) was withdrawn, in order to determine the enzymatic activity and the peptide profile of the FPH. The remaining volume of the culture medium was concentrated using a rotatory evaporator (Rotavapor RE 121, Büchi Laboratory Equipment, Flawil, Switzerland) equipped with a vacuum pump (V - 700, Büchi Laboratory Equipment, Flawil, Switzerland). The binomial temperature/pressure used was 40 ºC at 75 mPa. After evaporating most of the water of the FPH, samples were frozen and lyophilized (Thermo Scientific Heto Power Dry LL 3000, Labosistema, Portugal) for 24 - 28 hours. The resulting powder was stored at – 20 ºC until used further use.
2.2. Hydrolysates characterization
2.2.1. Determination of enzymatic activity
The enzymatic activity was determined following the method described by Twining (1984), with slight modifications, using derivatized casein with 1 % (w/v) of FITC as substrate.
The derivatized casein substrate was prepared dissolving 1 g of casein in 100 m L of 50 mM carbonate buffer pH 9.5, containing 150 mM sodium chloride. Then, 40 mg of FITC were
added to the mixture, obtaining an orange solution which was kept under stirring for 3 hours at room temperature. Free FITC was removed by dialyzing four times. The first two were made against a suspension of activated charcoal in water; the next dialysis was done against 50 mM Tris buffer pH 8.5, and finally, against a 50 mM Tris buffer pH 7.2. All dialyses were performed at 4 ⁰C under stirring overnight. The protein concentration was adjusted to 0.5 % (w/v) by adding 50 mM Tris pH 7.2 to a final volume of 200 ml. This substrate was stored in aliquots, frozen at -20 ºC until further use.
After each sampling time (24, 50 and 72 hours), 30 µL of Tris buffer 100mM pH 7.8, 10 µL of casein substrate and 10 µL of FPH were mixed in an Eppendorf tube, homogenized and incubated at 37 ºC for 30 minutes. After the incubation period, 120 µL of trichloroacetic acid (TCA) 5 % (w/v) were added to the samples. The samples were c entrifuged at 10 000 rpm, for 5 minutes (Sigma 2K15, B. Braun, Melsungen, Germany), and 100 µL of the supernatant were transferred to a tube with 2.9 mL of tris buffer 500 mM pH 8.5.
In parallel, two controls were also made, where the FPH was replaced by the same volume (10 µL) of Tris buffer 100 mM pH 7.8. In the positive control the 120 µL TCA 5 % (w/v) were replaced by 120 µL Tris buffer 500 mM pH 8.5. In the negative control the same volume of TCA 5 % was added. All samples and controls were homogenized and fluorescence measurements were made in a spectrofluorometer (LS 50B, PerkinElmer Inc, Waltham, Massachusetts USA), using an excitation wavelength of 495 nm and an emission wavelength of 525 nm.
The results regarding the enzymatic activity were expressed in relative fluorescence, calculated by the following equation:
elative fluorescence (%) s 100
where Fs is fluorescence after the enzymatic reaction, F- is the fluorescence of the negative control and F+ is the fluorescence of the positive control. Each measurement was made in quadruplicate.
2.2.2. Gel filtration and peptide profile
In order to characterize the peptide profile of culture medium and the FPH obtained, a gel filtration chromatography was made in a FPLC ÄKTA system (Amersham Biosciences, Uppsala, Sweden) equipped with a UV detector at 280 nm. The column used was a SuperdexTM Peptide 10/300 GL (Amersham Biosciences, Uppsala, Sweden).
The molecular weight (MW) calibration curve was prepared using ribonuclease A (13,700 Da), aprotinin (6,500 Da), angiotensin l (1,296 Da), triglycine (189 Da), glycine (75 Da) and blue dextran.
2.2.3. Protein content determination
The protein content was determined using a FP-528 LECO nitrogen analyzer (LECO; St Joseph, MI, USA) calibrated with ethylenediaminetetraacetic acid (EDTA) according to the Dumas method described by Saint-Denis & Goupy (2004). The experiment was performed in triplicate.
2.2.4. Yields of protein recovery
The yield of the different FPH samples was calculated according to the following equation:
Yield (%) = w P - P P
ws- Ps x 100
where wFPH is the weight in grams of FPH, PFPH is the protein content (%) of FPH, ws is the
weight of substrate in grams and Ps is the protein content (%) of substrate.
2.2.5. Degree of hydrolysis (DH)
DH was measured using OPA following the method referred by Nielsen et al. (2001). An aliquot of the sample (400 µL) was added to 3 mL of OPA solution and homogenized for 5 seconds. The mixture’s absorbance was measured 2 minutes later at 340 nm in a UNICAM UV – visible UV2 spectrophotometer. The same volume of distilled water instead of FPH sample was used as control. In parallel, it was also prepared a serine standard.
DH was also determined for the YE and CPH separately. These determinations were only possible to make for samples of 0 hours of fermentation, since this was the only sampling time in which the proportion of these two components was known.
DH h
h tot 100
h erine-N 2 -
Serine – NH2
Abssample- Abscontrol
Absserine- Abscontrol
0.9 16 0.1 10 w P
where Abssample is the absorbance of FPH, Absserine is the absorbance of serine standard,
Abscontrol is the absorbance of control, w is the weight in grams of FPH sample in 100 mL and
P is the protein content (%) of FPH. Constants values of the numberof equivalent peptide
bonds per gram of protein (htot), and were assumed to be 8.6 meq g -1
, 1 and 0.4, respectively, since these are the recommended values for fish by Nielsen et al. (2001).
Each experiment was made in quadruplicate.
2.3. Antioxidant properties of FPH
2.3.1. Antiradical activity
DPPH radical scavenging activity
DPPH radical scavenging activity was measured according to the procedure described by Morales & Jiménez-Pérez (2001) and Picot et al. (2010), with slight modifications. One milliliter of the sample with different concentrations was added to 1 mL of daily prepared solution of 0.1 mM DPPH in 95 % ethanol. The mixture was homogenized and shaken for 1 hour, at 24 ºC. After the incubation period, samples were centrifuged at 10 000 x g for 10 minutes in a Sigma 2K15 centrifuge, and the absorbance of the resultant supernatant was measured at 517 nm in a UNICAM UV – visible UV2 spectrophotometer. The control sample contained a solution of 0.5 % sucrose (w/v), in order to eliminate the effect of sucrose in radical scavenging activity of the sample.
DPPH inhibition was also determined for the YE and CPH separately. These determinations were only possible to make for samples of 0 hours of fermentation.
Radical scavenging activity of the samples was expressed as the percentage of disappearance of DPPH:
Inhibition (%) = Abs Control - Abs ample
where AbsControl is the difference between the absorbance of distilled water and the
absorbance of the control sample with 0.5 % sucrose, and Abssample is the absorbance of the
FPH sample.
The DPPH scavenging activity assay was made in quadruplicate and later expressed as EC50, corresponding to the concentration of protein of FPH that is able to scavenge 50 %
of DPPH radical.
ABTS radical scavenging activity
ABTS radical scavenging activity was determined using the method described by Re
et al (1999). To prepare the 7 mM ABTS+· solution, 10 mg of ABTS were dissolved in 2.6 mL
of a 2.45 mM potassium persulfate solution. The solution remained for 16 hours in the dark at room temperature before use. The ABTS+· solution was diluted with 5 mM sodium phosphate buffer pH 7.4, to give an absorbance value of 0.7 ± 0.02 at 734 nm. Then, 20 µL of sample solutions at different concentrations were added to 2 mL of the diluted ABTS+· solution and the mixture was homogenized and incubated at 30 ºC for 6 minutes. In parallel, a control sample was prepared with 0.5 % sucrose solution (w/v), instead of the FPH samples. ABTS inhibition was also determined for the YE and CP separately. The samples absorbances’ were measured at 734 nm in a UNICAM UV – visible UV2 spectrophotometer.
Radical scavenging activity of the samples was expressed in percentage of inhibition:
Inhibition (%) = Abs ControlAbs - Abs ample
Control x 100
where AbsControl is the absorbance of the control sample with 0.5 % sucrose, and Abssample is
the absorbance of the FPH.
The results were expressed as Trolox equivalent antioxidant capacity. A standard curve was prepared using Trolox (0.25, 0.5, 1.0 and 1.5 mM) as standard.
2.3.2. Reducing Power
The reducing power of culture media and FPH samples was determined according to the method described by Oyaizu (1986). The assay was done by mixing 2 mL of each sample (0.5 % sucrose solution, for the control), 2 mL of 0.2 M phosphate buffer pH 6.6, and 2 mL of 1 % (w/v) potassium ferricyanide. The mixture was homogenized and incubated for 20 minutes at 50 ºC. After the incubation period, 2 mL of 10 % (w/v) TCA was added and the mixture was centrifuged at 1 500 x g for 10 minutes in a Sigma 2K15 centrifuge. Then, 2 mL of the supernatant were mixed with 2 mL distilled water and 0.4 mL of 0.1 % ferric chloride. This mixture was incubated for 10 minutes at room temperature and their absorbance was measured at 700 nm in a UNICAM UV – visible UV2 spectrophotometer. Reducing power was also determined for the YE and CPH separately.
The results were expressed as acid ascorbic equivalent reducing power. A standard curve was prepared using ascorbic acid (0.02, 0.04, 0.06, 0.08, 0.10 and 0.12 mg mL-1) as standard.
This assay was made in quadruplicate.
2.3.3. Metal ion chelating activity
Copper
Copper chelating activity was ascertained according to the procedure described by Saiga et al. (2003), with some modifications. Solution of 0.1 mg mL-1 copper sulfate in sodium acetate buffer 50 mM pH 6.0 was prepared, as well as a solution of 0.3 mM PV in sodium acetate buffer 50 mM pH 6.0. One milliliter of FPH sample was added to 1 mL of the copper sulfate solution, and the mixture was homogenized. Next, 250 µL of PV 50 mM solution were added and homogenized. Copper chelating activity was also determined for the YE and CPH separately. Absorbance was measured at 626 nm in a UNICAM UV – visible UV2 spectrophotometer.
Chelating activity was calculated using the following formula:
( ) Abs (P Cu ) - Abs (P Cu sample)
where Abs (PV + Cu++) is the absorbance of the PV + Cu++ complex in the absence of peptide samples and Abs (PV + Cu++ + sample) is the absorbance of the PV + Cu++ complex in the presence of peptide samples.
This assay was made in quadruplicate.
Iron
The chelating activity for iron was determined in the same way as mentioned by Decker & Welch (1990). One milliliter of samples with different concentrations was mixed with 3.7 mL of distilled water and 100 µL of ferrous chloride 2 mM, followed by homogenization. Then, 200 µL of ferrozine 5 mM was added to the mixture and it was shaken vigorously. Ten minutes later, the samples absorbance was measured at 565 nm in a UNICAM UV – visible UV2 spectrophotometer. Iron chelating activity was also determined for the YE and CPH separately for 0 hours of hydrolysis, since this was the only sampling time in which the proportion of these two components was known.
Chelating activity was estimated using the equation below:
Chelating Activity (%) = Abs Control - Abs ample
Abs Control x 100
where AbsControl is the absorbance of the control sample with 0.5 % sucrose and Abssample is
the absorbance of the FPH.
This assay was made in quadruplicate.
2.4. Statistical analysis
A factorial ANOVA was applied to determine significant differences between the FPH samples (p ≤ 0.0 ). Multiple comparisons were done by the Tukey D test. In the absence of homogeneity/normality conditions, a Kruskal – Wallis methodology was applied for the multiple comparisons. Statistical treatment was done with software STATISTICA© from StatSoft Inc. (Tulsa, OK, USA), version 7.0, 2004.