R E S E A R C H A R T I C L E
Open Access
Comprehensive assembly and analysis of
the transcriptome of maritime pine
developing embryos
Andreia S. Rodrigues
1,2†, José J. De Vega
3†and Célia M. Miguel
1,2,4*Abstract
Background: There are clear differences in embryo development between angiosperm and gymnosperm species. Most of the current knowledge on gene expression and regulation during plant embryo development has derived from studies on angiosperms species, in particular from the model plant Arabidopsis thaliana. The few published studies on transcript profiling of conifer embryogenesis show the existence of many putative embryo-specific transcripts without an assigned function. In order to extend the knowledge on the transcriptomic expression during conifer embryogenesis, we sequenced the transcriptome of zygotic embryos for several developmental stages that cover most of Pinus pinaster (maritime pine) embryogenesis.
Results: Total RNA samples collected from five zygotic embryo developmental stages were sequenced with Illumina technology. A de novo transcriptome was assembled as no genome sequence is yet published for Pinus pinaster. The transcriptome of reference for the period of zygotic embryogenesis in maritime pine contains 67,429 transcripts, which likely encode 58,527 proteins. The annotation shows a significant percentage, 31%, of predicted proteins exclusively present in pine embryogenesis. Functional categories and enrichment analysis of the
differentially expressed transcripts evidenced carbohydrate transport and metabolism over-representation in early embryo stages, as highlighted by the identification of many putative glycoside hydrolases, possibly associated with cell wall modification, and carbohydrate transport transcripts. Moreover, the predominance of chromatin
remodelling events was detected in early to middle embryogenesis, associated with an active synthesis of histones and their post-translational modifiers related to increased transcription, as well as silencing of transposons.
Conclusions: Our results extend the understanding of gene expression and regulation during zygotic embryogenesis in conifers and are a valuable resource to support further improvements in somatic embryogenesis for vegetative
propagation of conifer species. Specific transcripts associated with carbohydrate metabolism, monosaccharide transport and epigenetic regulation seem to play an important role in pine early embryogenesis and may be a source of reliable molecular markers for early embryogenesis.
Keywords: Zygotic embryo, Pinus pinaster, Embryogenesis, RNA-seq, Developmental stages, Transcript profiling
Background
In higher plants, embryogenesis starts with the zygote formation and comprehends the whole developmental process that leads to a full mature and dormant embryo, enclosed by the seed tissues [1]. Most of current
knowledge about plant embryogenesis derived from studies on angiosperm species, in particular from the model organism Arabidopsis thaliana (reviewed in [2]). However, gymnosperm and angiosperm lineages are esti-mated to have driven apart over 300 million years ago [3] and their differences, in particular at the embryo-genic phase, are well known (reviewed by [4]). Molecular studies of embryogenesis in gymnosperms, and espe-cially in conifers, have gained interest in the last few years (reviewed in [5,6]). This has been driven by a bet-ter understanding of how the characbet-teristic differences
* Correspondence:cmiguel@itqb.unl.pt
†Andreia S. Rodrigues and José J. De Vega contributed equally to this work. 1
Instituto de Biologia Experimental e Tecnológica (iBET), Apartado 12, 2780-901 Oeiras, Portugal
2Instituto de Tecnologia Química e Biológica António Xavier, Universidade
Nova de Lisboa (ITQB NOVA), Av. da República, 2780-157 Oeiras, Portugal Full list of author information is available at the end of the article
© The Author(s). 2018 Open Access This article is distributed under the terms of the Creative Commons Attribution 4.0 International License (http://creativecommons.org/licenses/by/4.0/), which permits unrestricted use, distribution, and reproduction in any medium, provided you give appropriate credit to the original author(s) and the source, provide a link to the Creative Commons license, and indicate if changes were made. The Creative Commons Public Domain Dedication waiver (http://creativecommons.org/publicdomain/zero/1.0/) applies to the data made available in this article, unless otherwise stated.
in embryo development between angiosperms and gymno-sperms are established at the molecular level, and their evo-lutionary implications. Moreover, further improvement of somatic embryogenesis, an attractive technology for large scale vegetative propagation of economically important co-nifers, is largely dependent on additional knowledge about the basic processes controlling embryo development.
Next-generation sequencing (NGS) technologies ap-plied to mRNA discover and profiling (RNA-seq) have proved useful to study plant gene regulation, in particu-lar for the non-model species still missing a genome of reference (reviewed by [7, 8]). Large RNA sequencing projects such as the 1KP project alone achieved the tran-scriptomic sequencing in over 1000 different plant spe-cies which represents a huge effort with high impact in phylogenetic and land plant evolution studies [http:// www.onekp.com; [9]]. RNA-seq data have considerably advanced our knowledge about the regulation of plant stress responses [10], plant development [11–13], syn-thesis of commercially/biotechnologically relevant plant products [14] or even the evolution of specific genes [15]. The embryo mRNA transcriptomes of several plant spe-cies, including rice (Oryza sativa) [16], maize (Zea mays) [17,18], canola (Brassica napus) [19] and radish (Rapha-nus sativus L.) [20], have been generated by RNA-seq technology. In conifers, the transcriptome of early devel-opmental stages of Scots pine (Pinus sylvestris) [21] dom-inant embryo has been profiled using high-throughput sequencing. Additionally, other studies addressing gymno-sperm embryogenesis using NGS (reviewed by [22]) in-clude the reports by Yakovlev et al. (2014) on embryo transcriptome changes in Picea abies under different temperature conditions [23], on the transcriptomes of em-bryogenic and non-emem-bryogenic tissues of Picea balfouri-ana [24] on transcriptome comparative analysis of early somatic embryo formation and seed development in Araucaria angustifolia [25], on a comprehensive tran-scriptome survey of several Pinus lambertiana tissue types including embryos [26], on somatic embryo transcriptome profiling in Picea abies and [27] on the identification of carbohydrate-mediated responses associated with Arau-caria angustifoliaembryo formation.
Previously, a time-course transcriptomic study in Pinus pinasterpointed out the relevance of epigenetic regulators and specific transcription factors during the development of the embryo [28]. In such study, a cross-species micro-array hybridization approach was followed, limiting the identification of candidate transcripts to the set of array probes derived from Pinus taeda root and needle tissues. Building upon that study, we extend here the scope of the transcriptomic analysis by using a high-throughput se-quencing approach, with its known benefits over microar-rays (reviewed in [29]), including the capacity to retrieve novel and/or lowly expressed transcripts, or alternative
splice variants that might have been missed by microarray analysis [12]. In this work, we generated a species-specific transcriptome of the developing embryo aiming to have a significantly extended catalogue of maritime pine tran-scripts expressed during embryogenesis, targeting those transcripts with higher differences in expression during embryo development. By following this approach, we have identified over-represented processes, namely carbohy-drate metabolism and epigenetic regulation, in specific phases of embryo development as well as specific tran-scripts involved. This unique resource in maritime pine further contributes for deepening our knowledge of the transcriptional activity during embryogenesis in conifers.
Results
Comprehensive transcriptome assembly
We performed RNA-seq on five embryogenesis stages (Day0, Day5, Day11, Day15 and Day25) according to a previously reported staging system [30], which cover the whole developmental period of the zygotic embryo of P. pinaster, up to the maturation stage. To capture the transcriptome landscape of the embryo and major differ-ences in gene expression throughout development Illumina short-reads technology was used to sequence the RNA-seq libraries. In the absence of a published reference genome for P. pinaster, a comprehensive tran-scriptome assembly approach ([31]; reviewed in [32]) was adopted, which combines a de novo assembly of the reads using Trinity (version 2.0.6) [33] and a guided-as-sembly by mapping both the reads and de novo assem-bled transcripts against P. taeda genome (version 1.01) [34]. A total of ca. 319 M read-pairs were obtained, with an average of 63.8 M read-pairs per sample and each sample contributing from 44.9 M (14.1%) to 75.4 M (23.6%) read-pairs. A 5.3% of the reads was removed by the filtering steps. The resulting ca. 302 M read-pairs were subsequently used for de novo transcriptome as-sembly and mapping to the P. taeda genome. After obtaining the comprehensive transcriptome assembly, a total of 183.4 M read-pairs mapped in the correct dis-tance and orientation (Properly paired) to this reference for expression analysis, which represents 57.5% of the raw reads (Table1).
The final reference transcriptome of maritime pine zygotic embryogenesis contains 67,429 transcripts (de-posited at DDBJ/ENA/GenBank under the accession GGEX01000000, https://www.ebi.ac.uk/ena/data/view/ GGEX01000000), varying in length from 148 bp to 12,752 bp and with a mean length of 999 bp (Table2). Transcriptome annotation
All ORF possibilities were generated from the newly as-sembled transcriptome, and only one per transcript (the longest one in case of multiple possibilities) was translated
to generate the final proteome containing 58,527 proteins (Additional file1). The annotation of the assembled devel-oping embryo transcriptome was done using two sources of information: best reciprocal hits (BRH) to the pro-teomes of P. taeda, P. lambertiana and A. thaliana, and homology to proteins in NCBI databases (Additional file2). The function and gene ontology (GO) terms from anno-tated BRHs were assigned back to the P. pinaster protein, to annotate as result 14,211 P. pinaster proteins. Blast2GO (version 3.1) was used to annotate the transcripts, starting from the BLASTX alignments of the transcriptome to the NCBI non-redundant proteins database (E-value < 10− 3, Additional file3). Nearly 30,000 sequences were annotated with at least one GO term, and around 7500 transcripts had a homologous in the NCBI database but could not clearly be associated to a GO term. There were 28,780, 26,585 and 24,241 transcripts with at least one F:GO, P:GO or C:GO term, respectively. There are 16,056 transcripts with at least one GO term from each of the three categor-ies. Over 20,000 P. pinaster protein sequences did not align to any protein in the database (Additional file4). The hom-ologous proteins presented a mean similarity of 71%, while 54% of the BLAST hits had a sequence similarity over 70%
(Additional file5). The analysis of the highest scoring hom-ologous sequence to each P. pinaster transcripts showed that Picea sitchensis, a close relative of P. pinaster, is the most represented species by far, with over 16,000 BLAST Top-Hits. The other homologous belonged to species from different plant taxonomic groups, including gymnosperms, angiosperms and mosses. Four other Pinus species were represented, namely P. taeda, P. radiata, P. sylvestris and P. monticola (Additional file 6). The comparison with EBI’s InterPro database (IPS) for protein sequences and functions revealed about 37,500 P. pinaster sequences with a IPS re-sult; IPS analysis contributed GO terms to over 20,000 P. pinaster sequences (Additional file7). Mapping results re-vealed that UniProtKB and TAIR were the two main source databases of GO terms associated to P. pinaster sequences (Additional file8).
Functional regulation during embryo development The proteins from P. pinaster, P. taeda and P. lambertiana were clustered together according to the eggNOG group of their respective best orthologous sequenced in EMBL’s egg-NOG database of functionally annotated proteins (Add-itional file 9). When comparing the number of groups in the three species, P. pinaster had the highest number of ex-clusive groups (4355). Still, most of the groups, in a total of 5698, had proteins from the three species (Fig. 1). The groups with more protein members (Additional file10) are common to the three conifer species, and were annotated as containing “pentatricopeptide -PPR- repeats”, either implicated in replication, recombination and repair or with a function unknown, “terminal inverse repeats -TIR-”, “leucine rich repeats” or “NB-ARC domains”, which are molecular switches implicated in signal transduction mech-anisms. On the other hand, the groups exclusive of P. pinasterthat include at least 10 proteins were annotated as “zinc finger proteins” (19 members), “sister chromatid cohesion protein PDS5” (13 members), “GDP-L-galactose phosphorylases” and “zinc ion binding proteins” (11 mem-bers each), and several clusters annotated as “retrotrans-poson proteins”. However, most of the groups exclusive of P. pinastercontained only one protein.
Since each protein group was classified into a functional eggNOG annotation [35], it was possible to condense the Table 1 RNA-seq and mapping statistics of P. pinaster embryo developmental stages
Embryo developmental stage Day0 Day5 Day11 Day15 Day25
Read lengtha PE 50 bp PE 50 bp PE 50 bp PE 100 bp PE 100 bp
Raw pairs of reads 72,632,308 55,550,140 44,898,746 75,433,086 70,463,384 Clean pairs of reads 72,472,236 55,413,990 44,803,454 66,982,962 62,388,454 Pairs of reads mapping in correct distance and orientation
on P. taeda genome (Properly paired) used for assembly
61,626,536 45,975,573 37,763,000 60,334,604 55,692,971 Pairs of reads properly mapping on P. pinaster comprehensive
transcriptome used for expression
44,178,974 33,660,866 28,187,082 41,345,428 35,994,032
a
PE = paired-end
Table 2 Statistics of the assembled transcriptome from P. pinaster embryo development
Reference transcriptome Total assembled transcripts 67,429
ExN50a 1653 bp
Shorter assembled transcript length (transcript)
148 bp (Pp11025) Longer assembled transcript
length (transcript)
12,752 bp (Pp28188)
Mean length 999 bp
Median length 627 bp
Transcripts without N’s bases 65,852 Mean gap percentage per
transcript length
0.2% Predicted coding transcripts 58,527 Predicted non-coding transcripts 8896
a
ExN50 = transcript length metric that considers the top most highly expressed transcripts and means that at least 50% of the assembled transcript nucleotides were found in transcripts that were at least this length
functional information to 24 categories. Most of the pre-dicted proteins and associated eggNOGs had function un-known(5684 from the total 14,134 eggNOGS found in P. pinaster) (Additional file 10). For the remaining, a heat-map of functional categories expressed throughout P. pin-aster embryo development (Fig. 2) shows three major clusters of functional categories predominantly expressed at the early (Day0), middle (Day5 and Day11) or late (Day15 and Day25) embryogenesis stages. At the early embryo stages, functions associated to the cytoskeleton, energy production and conversion, carbohydrate transport and metabolism, amino acid transport and metabolism and intracellular trafficking, secretion and vesicular transport are prevalent, with the first three being just up-regulated at these stages. In contrast, replication, recombination and repair, and cell cycle control, cell division, chromosome partitioning, and chromatin struc-ture and dynamics follow the opposite trend and are up-regulated in late embryo stages.
Regarding the overall metabolic activity of the develop-ing embryo, carbohydrate transport and metabolism is up-regulated at early embryo stages decreasing towards the mature embryo, amino acid transport and metabolism is predominant in early embryo to early cotyledonary em-bryo stages, while secondary metabolites biosynthesis, transport, and catabolism peak at the mature embryo
stage. Nucleotide transport and metabolism and coenzyme transport and metabolismshow highest expression at ma-ture embryo stage, whereas lipid transport and metabol-ism is relevant both in the pre-cotyledonary and mature embryo stages.
Differentially expressed transcripts along embryo development
From the 67,429 assembled transcripts, 64,766 are clearly expressed in at least one developmental stage and 39,838 are expressed in all five stages (Additional file11). The number of transcripts expressed in each stage is equivalent, over 10,000 expressed transcripts per stage. A total of 4953 transcripts (7.3%) are expressed in only one stage of embryo development: 848, 338, 282, 1703, 1782 are exclusively expressed in Day0, Day5, Day11, Day15, and Day25, respectively.
A differential expression analysis (FDR < 0.05) between each pair of consecutive stages identified 1738 tran-scripts (2.6%) differentially expressed in at least one transition (Additional file 12). A total of 798, 383, 591 Fig. 1 Venn diagram of the number of eggNOGs found with the
predicted proteins of P. pinaster (Ppi) and two other relative conifer species, P. taeda (Pta) and P. lambertiana (Pla). Proteins were first annotated with the eggNOG numbers of their best homolog and then those sharing the same eggNOG number were concatenated. The numbers in the intersections represent the eggNOGs these conifers have in common
Fig. 2 Heatmap of the eggNOG functional categories expressed throughout P. pinaster embryo developmental stages. The heatmap was built after the counts of each transcript belonging to a protein group in such category were added up, and later transformed in Z-scores. The capital letters in between brackets originate in the eggNOGs database and are specific to the functional categories. The hierarchical clustering on the left side of the image represents the correlation of the expression levels associated with distinct functional categories
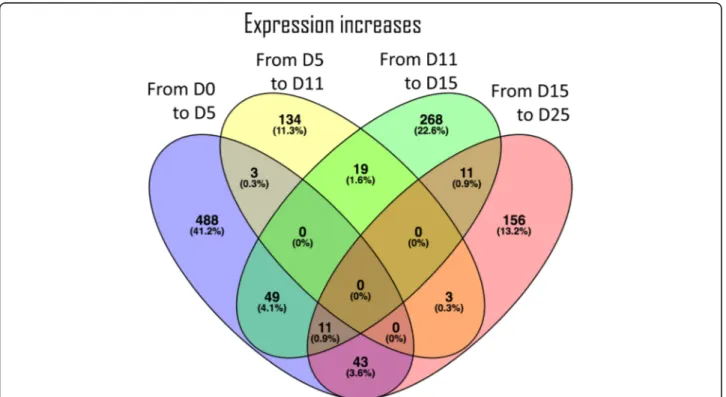
and 568 transcripts were differentially expressed in the first (from Day0 to Day5), second (from Day5 to Day11), third (from Day11 to Day15), and fourth (from Day15 to Day25) transition, respectively. Up-regulation of differ-entially expressed transcripts is predominant in the first transition, accounting for 594 of the 1185 up-regulated differentially expressed transcripts (Fig. 3) specific for first transition, while down-regulation of differentially expressed transcripts is more abundant in the last transi-tion (Fig.4), representing approximately 38% of the total down-regulated transcripts. Each developmental transi-tion shares few up- or down-regulated transcripts with the consecutive transition, supporting that the develop-mental stages selected for this study are clearly differen-tiated in terms of ongoing transcriptional activity.
A gene enrichment analysis of the differentially expressed transcripts retrieved over-represented GO terms associated with the first and last stage transitions (see Additional files 13, 14 and 15). Both transitions share an enrichment of down-regulated transcripts asso-ciated with regulation of cell cycle and cell division. Moreover, the first transition seems to be characterized by down-regulation of transcripts involved in monosac-charide transport and plant-type cell wall cellulose me-tabolism. The last transition is characterized by down-regulated transcripts related with epigenetics and annotated with the DNA-dependent DNA replication
GO term. As for the up-regulated transcripts, those found in the first transition are associated with terpenoid catabolism and tertiary alcohol metabolism, while the only enriched GO term found in last transition is the molecular function nutrient reservoir activity (data not shown). Overall, the terms carbohydrate transport and metabolism (Table 3) and epigenetics related terms (Table 4) are highly represented in the list of differen-tially expressed transcripts.
Clustering of the differentially expressed transcripts The 1738 differentially expressed transcripts throughout embryo development could be grouped into 12 distinct clusters (K) with similar patterns of expression by k-means clustering analysis (Fig.5). Overall, the clusters could be further divided in four groups (A to D) accord-ing to the embryo stage in which the expression peaks: (A) early embryo stages (clusters 1, 2, 3, 9), (B) early-cotyledonary and/or cotyledonary stages (clusters 6, 8, 10, 12), (C) pre-cotyledonary embryo stages (clus-ters 4, 5), and (D) mature embryo stage (clus(clus-ters 7, 11). Following an enrichment analysis performed in each cluster, several processes and functions were found over-represented in different phases of embryo develop-ment (Fig.5). The transcripts in group A are enriched in several GO terms including carbohydrate metabolism, monosaccharide transport, sterol metabolism, cell wall
Fig. 3 Venn diagram of the 1185 differentially expressed transcripts found up-regulated between two consecutive embryo developmental stages. The number of transcripts and respective percentage (relative to the total aforementioned 1185 transcripts) are represented for each transition. The numbers in the intersections represent transcripts found up-regulated in more than one developmental transition
organization or biogenesis, DNA-dependent DNA replica-tion, cell cycle, regulation of gene expression, epigenetic, among others (Fig. 5). In cluster 2, processes related to carbohydrate metabolism and monosaccharide transport and to the cell wall are highly represented (Additional file16). In cluster 3, which differs from cluster 2 mainly because the expression stays relatively high at mid-embryo stages before decreasing towards the mature embryo stage, DNA-depen-dent DNA replicationis particularly relevant in terms of the number of contributing transcripts (89 transcripts) and in-cludes chromatin organization, DNA modification, DNA methylation, histone lysine methylation, DNA packaging, his-tone methylation, regulation of gene expression, epigenetic (Additional file17). The transcripts in group B are enriched in GO terms such as steroid dehydrogenase activity, sesqui-terpenoid catabolism, release of seed from dormancy and tertiary alcohol metabolism. In group D, the most repre-sented terms are nutrient reservoir activity, carbon-oxygen lyase activity, alpha-bisabolene synthase activity and terpene synthase activity.
Validation by qPCR
A subset of eight transcripts was selected based on their ex-pression profile and putative involvement in carbohydrate metabolism (Table3) or epigenetic regulation (Table4), to
independently validate the RNA-seq results using RT-qPCR (information about the primers can be found in Additional file18). Five of these genes are differen-tially expressed transcripts throughout embryo development (FDR < 0.05) and are included in different transcription profiles (clusters 2, 3, 5, 10). The RT-qPCR and RNA-seq expression results are generally in good agreement as dem-onstrated by the values of Pearson correlation, which ranged between 0.52 (Pp34678) and 0.93 (Pp38781), confirming the peaks of expression associated with specific developmental stages (Fig. 6). There is also a good agreement between RT-qPCR and RNA-seq for transcripts which had not been predicted as differentially expressed (Pp29536, Pp34388 and Pp34678).
Discussion
In this work, RNA-seq is used to provide a comprehen-sive overview of the transcriptome of the maritime pine developing embryo. Previously, the first transcriptomic analysis of the maritime pine embryo using the same developmental stages as those analysed here, has relied on the use of a loblolly pine (P. taeda) microarray to identify transcripts present during embryogenesis which are conserved between the two species [36]. Although the microarray had been successfully used for cross-species Fig. 4 Venn diagram of the 904 differentially expressed transcripts found down-regulated between two consecutive embryo developmental stages. The number of transcripts and respective percentage (relative to the total aforementioned 904 transcripts) are represented for each transition. The numbers in the intersections represent transcripts found down-regulated in more than one developmental transition
Table 3 Differentially expressed transcripts related to carbohydrate transport and metabolism Cluster a Transcript At Locus Pta Locu s Pla Locus An notation b k1 Pp1026 5 #N/A #N/A #N/A ph osphoen olpyru vate car boxyk inase k1 Pp1126 #N/A #N/A #N/A mann an endo--be ta-manno sidase k1 Pp1915 4 #N/A #N/A #N/A cyt osoli c triosepho sphate isom erase k1 Pp2858 0 AT4G 37870 .1 2A_al l_VO_ L_6958 _T_66 /101|m .15610 V1_2 kb/polished_hi gh/00 0086|m .144 ph osphoen olpyru vate car boxyk inase k1 Pp4269 2 #N/A #N/A #N/A udp -d-glucuronate 4-epi merase 2 k1 Pp4590 7 #N/A #N/A #N/A tri ose phosp hate phosp hate non-gre en pre cursor k1 Pp4590 8 #N/A #N/A #N/A ph osphate pho sphoen olpyru vate trans locator precursor k2 Pp1143 7 #N/A #N/A #N/A xy loglucan end otrans gluc osylase hydrolas e k2 Pp1143 8 #N/A #N/A P/ miseq/c2758 0_g1_i 1|m.279 50 PR EDICT ED: pro bable xylogl ucan end otransglucosy lase/hydrolase pro tein 26 k2 Pp1281 9 AT1G 76160 .1 2A_al l_VO_ L_1_T_ 16554 1/18183 2|m. 14942 E1_2 kb_2/p olished _high/0 00754 |m.928 L-ascorb ate ox idase homo log SKU5 SIMI LA R 5 (SKS 5) k2 Pp1567 #N/A #N/A #N/A mu ltico pper ox idase k2 Pp1833 0 #N/A 6A_al l_VO_ L_6290 _T_21 /157|m .53348 #N/A PR EDICT ED: sug ar trans port prot ein 13 k2 Pp1856 7 #N/A #N/A DCR /hiseq /c107 286_g1_ i1|m .126449 PR EDICT ED: pro bable pe ctineste rase 68 k2 Pp1892 #N/A #N/A #N/A ald ose 1-epi merase k2 Pp2081 3 #N/A #N/A #N/A hexo se transport er k2 Pp2456 #N/A #N/A #N/A ce llulose synthas e k2 Pp2796 2 #N/A 5A_I15 _VO_L_ 1793_ T_10/1 5|m.468 09 #N/A PR EDICT ED: CM P-sial ic aci d trans porter 2 k2 Pp2811 7 #N/A #N/A #N/A alc ohol dehyd rogen ase k2 Pp2896 4 #N/A 2A_al l_VO_ L_8976 _T_26 /41|m. 15937 #N/A Xy loglucan end otrans glucosylase/ hydrolas e prot ein A pre cursor, putat ive k2 Pp3030 2 #N/A #N/A #N/A glyo xalase i k2 Pp3267 0 AT5G 26340 .1 #N/A JASS /hiseq /c635 25_g1_i1 |m.644 29 SUG AR TRAN SPORT PROTE IN 13 (ST P13), ATST P13, MSS 1 k2 Pp3296 0 #N/A #N/A #N/A pro bable inosi tol transport er 2-like k2 Pp3400 9 #N/A 3A_I18 _VO_L_ 2_T_2 368/13 6250|m. 32448 Bas ket/c191 28_g 1_i1|m .26924 PR EDICT ED: L-ascorb ate ox idase homo log k2 Pp3652 6 #N/A #N/A #N/A L-ascorb ate ox idase-like prot ein k2 Pp3739 7 #N/A #N/A #N/A na dp-depende nt mal ic enz yme k2 Pp3754 8 AT4G 39770 .1 #N/A M_S 1/c25 586_g1 _i4|m. 12934 1 tre halose-6 -phosph ate phosph atase k2 Pp3842 7 #N/A #N/A #N/A py ruvate kin ase k2 Pp3845 0 AT2G 01850 .1 2A_I15 _VO_L_ 1_T_1 24932 /13314 4|m.217 38 V1_1 kb_1/01 5976|m .720027 EN DOXYLO GLUCAN TR ANSFE RASE A3 (EXG T-A3), XYL OGLU CAN EN DOTRAN SGLUC OSYLAS E/HYD ROLA SE 27 (XTH 27), ATXT H27 k2 Pp3878 1 AT4G 02290 .1 2A_I15 _VO_L_ 39_T_ 24/48| m.217 81 S_2kb /pol ished_h igh/000 346|m. 477 glyc osyl hydrolas e 9B13 , end oglucanase 17 k2 Pp3892 4 #N/A #N/A #N/A xy lose isome rase k2 Pp3950 7 AT5G 13870 .1 6A_I20 _VO_L_ 1_T_6 4241/1 33533 |m.5541 1 E1_2 kb_2/p olished _high/ EN DOXYLO GLUCAN TR ANSFE RASE A4 (EXG T-A4), XYL OGLU CAN
Table 3 Differentially expressed transcripts related to carbohydrate transport and metabolism (Continued) Cluster a Transcript At Locus Pta Locu s Pla Locus An notation b 0022 88|m.23 04 EN DOTRAN SGLUC OSYLAS E/HYD ROLA SE 5 (XTH5) k2 Pp4291 6 #N/A 5A_I12 _VO_L_ 2_T_5 1143/5 3062|m. 43159 #N/A ph osphoen olpyru vate car boxyk inase k2 Pp4333 0 #N/A #N/A #N/A pe ctin me thylest erase (pect inest erase) k2 Pp4376 1 #N/A #N/A #N/A glyc osyl hydrolas e-like pro tein k2 Pp4617 0 AT3G 13790 .1 6A_al l_VO_ L_6326 _T_78 /89|m. 53354 #N/A Ar abido psis tha lia na CELL WAL L IN VERTAS E 1 (ATC WI1), ATB FRUCT1 , ATC WINV1, CW I1 k2 Pp4782 6 AT5G 03630 .1 5A_al l_VO_ L_2839 _T_31 /70|m. 40851 Wou nd/hi seq/c701 86_g2_ i1|m.476 59 Py ridine nuc leoti de-disul phide ox idoreductase family prot ein (MD AR2), mon odehyd roascorbate reduc tase k2 Pp6019 AT1G 77210 .1 #N/A #N/A SUG AR TRAN SPORT PROTE IN 14 (ST P14), ATST P14 k2 Pp6337 #N/A #N/A #N/A mu ltico pper ox idase k2 Pp8252 #N/A #N/A #N/A hexo se transport er k2 Pp8434 AT1G 68560 .1 #N/A S_2kb /pol ished_h igh/000 741|m. 810 ALP HA-X YLOSIDASE 1 (XYL1 ), ALT ERED XYL OGLUCAN 3 (AXY 3), THE RMOINHIBITI ON RESI STANT GE RMINAT ION 1 (TRG1 ), ATX YL1, GH31 k2 Pp8435 #N/A #N/A #N/A alp ha-xy losidase precursor k2 Pp8535 #N/A #N/A #N/A end oglu canase k2 Pp9898 AT3G 59480 .1 #N/A S_2kb _2/0 20091 |m.6291 85 pf kB-like carbohydrate ki nase family prot ein k3 Pp1564 4 #N/A #N/A #N/A be ta gluc osidase 43 k3 Pp2164 1 #N/A #N/A #N/A mann an endo--be ta-manno sidase 7 k3 Pp2379 2 #N/A 6A_al l_VO_ L_1347 4_T_9 /19|m. 54026 V1_1 kb_3/p olished _high/ 0010 86|m.10 85 se nescen ce-assoc iated prot ein 29 k4 Pp1642 3 #N/A #N/A #N/A pro tein k4 Pp2429 0 #N/A #N/A #N/A be ta-amylase 7-lik e k4 Pp2712 4 #N/A #N/A #N/A o-glycosy l hydro lases family 17 protein k4 Pp3484 5 #N/A #N/A #N/A ph osphatidylinos itol 4-kinase k4 Pp9901 #N/A #N/A #N/A alk aline alp ha galacto sidase i k5 Pp1437 9 #N/A #N/A #N/A O -Glycosyl hydrolas es family 17 prot ein k5 Pp1469 #N/A #N/A #N/A unk nown ; unkno wn [P ice a sitchen sis ] k5 Pp3214 0 #N/A #N/A #N/A bras sinos teroid-regulat ed protei n bru1 k5 Pp3214 1 #N/A #N/A SDN /miseq/c296 01_g2_ i2|m.398 98 xy loglucan end otrans gluc osylase/ hydrolas e prot ein 24 k5 Pp3214 4 #N/A #N/A P/ miseq/c3352 4_g1_i 3|m.508 29 PR EDICT ED: pro bable xylogl ucan end otransglucosy lase/hydrolase protei n 23 -like k5 Pp3958 3 #N/A #N/A #N/A the rmostable beta-glucosidase k5 Pp4158 6 #N/A #N/A #N/A pro bable glyceropho sphoryl diester phosp hodie sterase 3-l ike k5 Pp4948 #N/A #N/A #N/A catal ase
Table 3 Differentially expressed transcripts related to carbohydrate transport and metabolism (Continued) Cluster a Transcript At Locus Pta Locu s Pla Locus An notation b k5 Pp7568 #N/A #N/A #N/A alc ohol dehyd rogen ase k5 Pp9008 AT1G 22170 .1 #N/A E1/hi seq/c2513 1_g1_i 3|m.597 5 Pho sphog lycerate mu tase-like protei n k6 Pp2390 9 #N/A #N/A #N/A mann an endo--be ta-manno sidase 7 k6 Pp876 #N/A #N/A #N/A neu rofilam ent protei n h form h2 k6 Pp9495 #N/A #N/A #N/A ph osphol ipase c k7 Pp2650 3 #N/A #N/A #N/A gal actinol synthase k7 Pp2858 #N/A #N/A #N/A succ inate dehydro genase k7 Pp3490 0 #N/A #N/A #N/A mal ate synthas e k7 Pp3490 6 AT5G 03860 .1 2A_I2_ OT_c omp 27109 _c0_seq3 |m.239 89 Neg_ S1/c3 1207_ g1_i 2|m.108 321 mal ate synthas e k7 Pp4067 9 #N/A 6A_I23 _VO_L_ 1_T_4 4295/1 65398 |m.5887 4 BR N/hiseq/c655 94_g2_ i2|m.3 7248 gal actinol synthase k7 Pp4071 9 AT3G 24090 .1 5A_al l_VO_ L_2_T_ 19243 7/40905 1|m. 39335 E1/hi seq/c4006 8_g1_i 1|m.274 99 glu cosam ine-fructose-6-ph osphate ami notran sferas e k8 Pp1450 3 #N/A #N/A #N/A be ta-amylase 7-lik e k8 Pp4471 8 #N/A #N/A #N/A be ta-amylase 7-lik e k9 Pp3232 1 #N/A #N/A P/ miseq/c2647 2_g1_i 4|m.248 88 end oxylo glucan trans ferase A4 k9 Pp3971 5 #N/A 3A_I18 _VO_L_ 2_T_6 3095/1 36250 |m.3272 3 #N/A ald ose 1-epi merase family protei n k9 Pp4072 0 #N/A #N/A #N/A glu cosamine--fructose-6-ph osphate ami notrans ferase k10 Pp240 #N/A #N/A #N/A be ta-glu cosida se 44 -like k10 Pp3012 1 AT4G 38970 .1 3A_I16 _VO_L_ 2_T_4 8696/6 0890|m. 30958 V_ 1kb/017 920|m. 88970 8 fru ctose-bi sphosphat e ald olase 2 k11 Pp1454 1 #N/A #N/A #N/A ald ehyde de hydro genase family 2 memb er mi tochon drial-like k11 Pp1528 8 #N/A #N/A #N/A py ruvate de carboxylase isozy me k11 Pp1829 7 #N/A 5A_I14 _VO_L_ 947_T _33/56 |m.4517 1 DCS 1kb_1 /003053 |m.3 985 PR EDICT ED: pro bable xylogl ucan end otransglucosy lase/hydrolase pro tein 8-l ike k11 Pp2308 9 #N/A #N/A #N/A po lygalacturonase k11 Pp3532 6 #N/A #N/A #N/A pro tein k11 Pp9001 #N/A #N/A #N/A pro bable xylogl ucan end otransglucosy lase hyd rolase protei n 23 k11 Pp995 #N/A #N/A #N/A my o-inosi tol-1-ph osphate sy nthase k11 Pp9981 AT1G 32860 .1 #N/A #N/A Gl ycosyl hyd rolas e super family prot ein k12 Pp4662 2 AT4G 25000 .1 #N/A SDN /miseq/c158 56_g1_ i1|m.114 96 alp ha-am ylase-li ke aNumber of the cluster of expression that the transcript is associated with bOrder of preference for annotating each P. pinaster transcript after its homologs is: A. thaliana , P. taeda , P. lambertiana , and Blast2Go annotation against NCBI
Table 4 Differentially expressed transcripts involved in epigenetic regulation (with BRH found) Cluster a Tra nscript At Lo cus Pta Locu s Pla Lo cus Ann otation b DNA mod ificat ion 3 Pp11 214 AT1G578 20.1 #N/A V_2kb_ 2/polishe d_high/ 0001 75|m.18 1 VARIA NT IN METHYL ATIO N 1 (VIM1 ), ORTHR US 2 (OR TH2) 5 Pp37 94 #N/A #N/A P/mi seq/c155 61_g1_ i1|m.829 7 PREDI CTED: DNA (cy tosine -5)-met hyltransferase DRM 2-like Histone modif ication 1 Pp30 887 #N/A #N/A SDN/m iseq/c40 928_g1 _i1|m.61 118 ubiqu itin-co njugating enzy me 28, E2 3 Pp44 003 AT5G243 30.1 6A_al l_VO_ L_4227 _T_27 /112|m .53170 DCS/hiseq/c4851 9_g1_i 1|m.183 31 ARA BIDOPS IS TR ITHORA X-RELATED PROTEIN 6 (A TXR6) , SET DOMA IN PROTE IN 34 (SDG 34) 10 Pp33 894 #N/A 5A_I16 _NT_c omp 45588 _c0_seq2 |m.475 51 S/hiseq/c427 37_g 1_i1|m .36406 PREDI CTED: histo ne-lysine N-m ethyltr ansferase SUVR5 Chrom atin format ion or chromat in remode lling 3 Pp26 994 AT5G227 50.1 #N/A S/hiseq/c379 32_g 2_i1|m .21712 RAD 5, RAD5A 3 Pp34 781 AT1G654 70.1 6A_I23 _VO _L_468 9_T_3 9/51|m .59955 RF-S _3/po lished_hi gh/00 5053|m .5101 FASC IATA 1 (FAS1 ), FUGU 2, FUGU 2, NF B2, NUC LEOSOM E/ CHR OMATI N ASSEM BLY FACT OR GR OUP B 7 Pp30 270 AT5G370 55.1 #N/A BRN/h iseq/c66142 _g2_i1 |m.3882 7 SERRAT ED LEA VES AND EARLY FLOWE RING (SE F), ATSWC6 8 Pp14 163 AT1G054 90.1 #N/A S/hiseq/c331 64_g 1_i2|m .13589 CHR OMATI N REM ODELING 31 (CHR3 1) RNA silencing 1 Pp12 441 #N/A 5A_I13 _OT_c omp1946 1_c0_ seq4|m .44088 #N/A PREDI CTED: prot ein argonau te 2-like Histone s 3 Pp36 206 #N/A #N/A E1_2k b_2/poli shed_ high/ 00136 9|m.149 0 histon e H3 3 Pp38 724 #N/A #N/A DCS1kb_3/p olish ed_high /000803 |m.897 histon e H2A 12 6 Pp46 360 #N/A 2A_al l_VO_ L_1_T_ 65055 /181832 |m.1 4308 #N/A PREDI CTED: histo ne H1-like 10 Pp14 332 AT2G306 20.1 #N/A M_S 1/c45 20_g1_i1 |m.114 500 HISTO NE 1.2 (H1. 2) 10 Pp46 359 #N/A #N/A SDN/m iseq/c31 005_g5 _i1|m.46 415 histon e H1.2 Others 3 Pp41 359 #N/A 5A_al l_VO_ L_6933 3_T_1 1/13|m .42398 V_3_3-6 kb/0165 15|m .360307 Telom ere-as sociated prot ein RIF1 aNumber of the cluster of expression that the transcript is associated with bOrder of preference for annotating each P. pinaster transcript after its homologs is: A. thaliana , P. taeda , and P. lambertiana
Fig. 5 K-means clustering of differentially expressed transcripts along P. pinaster embryo development. Transcripts were clustered together according to their expression profiles and a representative mean expression profile (dashed line) was represented for every cluster. The 12 k-means clusters generated were further divided in four groups (A to D) depending on the embryo developmental stage in which the expression peaks. The inset displays the processes and functions found over-represented among the transcripts from the different clusters (and groups). a Clusters K1, K2, K3, K9, showing decreasing expression along development. Cellular carbohydrate metabolism, monosaccharide transport, carbohydrate metabolism, sterol metabolism, cell wall organization or biogenesis, external encapsulating structure organization,cell wall macromolecule metabolism, DNA-dependent DNA replication, biological regulation, organic cyclic compound metabolism, cellular aromatic compound metabolism, cellular component organization or biogenesis, cell cycle,developmental process, shoot system development, multicellular organismal process, mitotic cell cycle process, methylation, cell proliferation, microtubule-based process. b Clusters K6, K8, K10, K12, with expression peaking at Day11 and/or Day15. Steroid dehydrogenase activity, acting on the CH-CH group of donors, 3-oxo-5-alpha-steroid 4-dehydrogenase activity, abscisic acid catabolism, release of seed from dormancy. c Clusters K4, K5, with expression peaking at Day5. No GO-terms. d Clusters K7, K11, with increasing expression along development. Nutrient reservoir activity, carbon-oxygen lyase activity, acting on phosphates, carbon-oxygen lyase activity, alpha-bisabolene synthase activity, terpene synthase activity
Fig. 6 Validation of P. pinaster transcripts profile obtained by RNA-seq (red line) with RT-qPCR (blue line). Pearson correlation values (r) between the two technologies are shown. Fold-change values are also shown for each developmental stage. Dotted lines connect relative expression values calculated for Cq values detected in the last 5 cycles of the qPCR amplification program
hybridization [37, 38], it contained approximately 25,000 unique cDNAs from P. taeda representative of cDNA li-braries exclusively prepared from root and needle tissues, limiting the scope of the analysis considering our main focus on embryo development. In the present study, such limitation is overcome and the transcriptomic landscape during embryogenesis has been significantly expanded. Over 300 M read-pairs obtained from embryos at five stages of development were assembled using a compre-hensive strategy to produce a reference transcriptome for maritime pine zygotic embryogenesis with 67,429 tran-scripts. This number is three times the number of expressed transcripts that had been previously identified with the P. taeda microarray [36], corresponding to a similar increase in the number of annotated proteins. Nevertheless, Picea sitchensis, Vitis vinifera and Ricinus communisremain the top three most represented species in the distribution of all Top-BLAST hits.
The annotation of P. pinaster, P. taeda and P. lam-bertianapredicted proteins with the eggNOG number of its best homolog revealed that most annotated proteins are shared by the three species (40.3% in P. pinaster, 51.1% in P. lambertiana, and 86.2% in P. taeda). P. pin-aster and P. lambertiana predicted proteomes have ap-proximately 10 times more proteins in common than those shared with P. taeda, while the latter shares roughly the same percentage of proteins with either species. Moreover, the percentage of exclusive predicted proteins was higher in P. pinaster (30.8%), against 3.0% in P. taeda. The analysis of orthologous groups highlighted some eggNOGs, shared by the three species, with a high number of protein members, which include“PPR repeat” and“Retrotransposon protein” involved in replication, re-combination and repair, or with function unknown, and several eggNOGs described as “Leucine Rich Repeat (LRR)”, and “nucleotide binding domain with an ARC motif (NB-ARC domain)” involved in signaling transduc-tion mechanisms, and “toll/interleukin-1 receptor (TIR)” with function unknown. These results are in close agree-ment with the reported annotation of the shoot transcrip-tome of Pinus patula in which the largest family that was identified, including 1794 members, contained LRR, TIR, NB-ARC, Golgi transport complex 5 (COG5) and pox-virus A32 protein motifs [31].
Carbohydrate metabolism and transport in early embryogenesis
This work gathered several evidences, both from the ana-lysis of functional categories represented throughout embryo development and from the analysis of specific transcripts, pointing to a prominent role of carbohydrate transport and metabolism early in P. pinaster embryogen-esis. The analysis of functional categories assigned to eggNOGs showed up-regulation of carbohydrate transport
and metabolismin early embryo stages and a reduction in expression towards later stages of embryogenesis. Also, the enrichment analysis of all the differentially expressed transcripts revealed a group of highly expressed tran-scripts peaking at Day0 (cluster 2 profile) enriched in carbohydrate metabolism, including cellular carbohydrate metabolism. In the same profile, cellular carbohydrate me-tabolism appears associated to the metabolism of the primary cell wall components cellulose, pectin, and glu-can. Additionally, the 204 differentially expressed tran-scripts down-regulated from Day0 to Day5 were enriched in monosaccharide transport and plant-type cell wall cellulose metabolism (see Additional file 13). A recent study in P. sylvestris seed development has also pointed out to an over-representation of carbohydrate metabolic processand cell wall modification terms among the differen-tially expressed transcripts over-represented at early devel-opmental stages [21].
Many glycoside hydrolases encoding transcripts were found more expressed in the first embryo stage (cluster 2), including the Pp38781 homolog of AT4g02290 (glycosyl hydrolase 9 family) whose expression profile was success-fully validated by RT-qPCR. In particular, the presence of several pine homologs of α-xylosidase and xyloglucan endotransglycosylase (previously named xyloglucan-endo-β-glucanase) within this expression profile points out the importance of xyloglucan mobilization and/or degrad-ation in pine early embryogenesis [39]. Xyloglucan is the main hemicellulose constituent of the primary cell walls of spermatophytes except for grasses (reviewed by [40]), and the glycosidases capable of trimming the xyloglucan side chains are expected to act in the turnover or recycling of xyloglucan during cell wall expansion (reviewed in [41]). The Arabidopsis ALPHA-XYLOSIDASE 1/ ALTERED XYLOGLUCAN 3/ THERMOINHIBITION RESISTANT GERMINATION 1 (XYL1/ AXY3/ TRG1), whose putative maritime pine homolog (Pp8434) was also up-regulated in early embryogenesis, codes for an enzyme involved in xyloglucan degradation into free monosaccharides [42] and the only α-xylosidase active against xyloglucan [43]. Germinating seeds of Arabidopsis xyl1 loss-of-function mutants display cell wall loosening and reduced seed dor-mancy due to alterations in primary cell wall integrity [44]. Also a putative homolog (Pp38450) of the Arabidop-sis ENDOXYLOGLUCAN TRANSFERASE A3/
XYLO-GLUCAN ENDOTRANSGLUCOSYLASE/HYDROLASE
27(EXGT-A3/ XTH27), involved in the differentiation of tracheary elements through the degradation of the xylo-glucan deposited in the cell walls [45], was identified with the same expression profile (cluster 2), together with a pu-tative homolog of XTH5, a gibberellin (GA)-inducible gene expressed in the embryonic axis and in the radicle of seeds, involved in germination [46]. Overall, it seems that the glycoside hydrolases involved in cell-wall modification
during germination, are also relevant for the control of early stages of pine embryogenesis. In fact, enzymes re-sponsible for xyloglucan degradation have already been found associated to somatic embryogenesis induction in divergent species (reviewed by [47,48]), including conifers such as P. radiata where the up-regulation of α-D-galac-tosidase (SEPR1) was detected [49]. In Picea abies somatic embryogenesis a Xyloglucan:xyloglucosyl transferase and a Glycosyl transferase family 1 protein were found differen-tially expressed and down-regulated in the transitions from proliferation to differentiation of early embryos and from early embryos to development of late embryos [38].
Other members of the glycosyl hydrolase family were found differentially expressed in our results, including a putative homolog (Pp46170) of CELL WALL INVERT-ASE 1 (CWINV1/CWI1), described as playing a role in plant sink tissues where it performs the hydrolysis of su-crose, unloaded from the phloem via apoplast, into fruc-tose and glucose (reviewed in [50]). Studies in cotton and Arabidopsis seeds revealed that CWINV is expressed all over the globular embryo but seems to be restricted to the central zone of the torpedo embryo [51]. In a comparison of the response to somatic embryogenesis induction in shoot primordia derived from adult trees of Picea glauca, up-regulation of CWINV1 was detected only in non-re-sponsive genotype, and a possible link with biotic stress response was discussed [52]. There are also many evi-dences that associate CWINV-mediated sucrose hydroly-sis with the sugar signaling that promotes cell division in early embryogenesis (reviewed by [50,53]).
Many transcripts coding for putative carbohydrate transporters also peaked at the first embryo stage (Day0), most of them hexose (or monosaccharide) trans-porters involved in transport and intake into the cyto-plasm, possibly after CWIN has cleaved the sucrose present in the apoplast [51]. Although still very little is known about the role played by these hexose transporters specifically in early plant embryogenesis (reviewed in [54]), previous work on other sink tissues that, like the de-veloping embryo, are also symplastically isolated, had shown their dependence on transport proteins to uptake the sucrose-derivatives through the plasma membrane (reviewed by [55]). A putative pine homolog (Pp6019) of the Arabidopsis SUGAR TRANSPORT PROTEIN 14 (AtSTP14) belonging to the AtSTPs family, but specific for galactose transport and expressed both in source (green leaves) and in sink tissues (seed endosperm and cotyle-dons) [56], was also detected. There are several evidences pointing to a role of AtSTP14 in cell wall recycling, namely in the transport of the cell wall-derived galactose released upon cell wall degradation performed by β-galactosidases (glycosyl hydrolases) and other enzymes [56]. Yet another putative pine homolog (Pp32670) of the Arabidopsis AtSTP13 was found in cluster 2, likely
involved in the transport of monosaccharides derived from the cell wall (reviewed in [54]).
The GO enrichment results from clusters 2 and 3, which gather several glycosyl hydrolases, carbohydrate transporters and kinases, as well as cell cycle related tran-scripts, seem to support an active communication be-tween regulators of carbohydrate metabolism and cell cycle in P. pinaster early embryogenesis. So far, the impact on plant cell cycle control and cell division derived from the interaction between the nutritional state and genetic control has been elucidated only in post-embryonic devel-opment studies [57]. Observations in Arabidopsis show that carbohydrates availability plays a role on cell decision over G2/M transition by sugar signaling interaction with specific key cell cycle regulators, such as CYCB1;1 and CDKB1;1, which directly impacts proliferation of meri-stematic tissues [58]. Among the five cyclin dependent kinase b transcripts found among clusters 2 and 3 there is Pp42651, a putative pine homolog of the
Ara-bidopsis CYCLIN-DEPENDENT KINASE B2;2
(CDKB2;2) which has been shown to be a regulator of cell cycle progression and SAM organization, and involved in hormone signaling [59].
Epigenetics associated transcripts in early to middle embryogenesis
Many transcripts associated with different components of epigenetic regulation are found differentially expressed during maritime pine embryogenesis. Most of them are included in cluster 3 profile, characterized by a peak of expression at early embryogenesis.
Five putative histone subunits homologs are differen-tially expressed across pine embryo development and follow different expression profiles. Pp36206 and Pp38724, putatively encoding core H3 and H2A histone subunits, respectively, show a higher abundance in early embryogenesis and generally decreasing towards late em-bryogenesis (with a second minor peak at Day11). Also in Picea abiessomatic embryogenesis a Histone 3 was found differentially expressed and down-regulated in the late embryogeny phase [60]. Histone H3 is a known phosphor-ylation target, in a cell cycle-dependent manner, of all three Arabidopsis Aurora kinases [61,62]. Interestingly, a pine homolog of Aurora-2 (Pp32543) is present in the same cluster. Additionally, the H1 (linker) histones, puta-tively encoded by Pp46360, Pp14332 and Pp46359 pine transcripts following an overall profile presenting a peak of expression at D11/D15 stages (cluster 6 or 10), have been reported as involved in DNA methylation and demethylation, cell-cycle progression, and plant develop-ment (reviewed by [63]). A microarray analysis of somatic embryogenesis material from Picea abies revealed up-regulation of Histone H1 in proembryogenic masses (PEMs) one day after withdrawal of plant growth
regulators, when PEM-to-embryo transition is induced, and in the transition from proliferation to differentiation of early embryos [38].
Genes associated with chromatin formation or remod-elling also appeared differentially expressed across pine embryo development. A Serrated and early flowering/
SWR1 complex subunit 6 (SEF/SWC6) pine homolog
(Pp30270) increased its expression throughout embryo development (cluster 7). SEF encodes a subunit of SWR1 chromatin-remodelling complex, which is respon-sible for the ATP-dependent replacement of histone H2A by H2A.Z variant, and is associated with flowering repression in Arabidopsis by means of positive regula-tion of the flowering repressors FLOWERING LOCUS C (FLC) and MADS-AFFECTING FLOWERING 4 (MAF4) [64–66]. Two other SNF2-related chromatin remodelling putative transcripts follow different expression profiles. Pp14163, the putative pine homolog of CHROMATIN RE-MODELING 31(CHR31) peaked at Day5 and Day15, while the homolog of RAD5 (Pp26994), was over-represented at early embryogenesis, pointing to a developmental stage dependent expression of these genes. Also peaking in early embryos was Pp34781, a putative FASCIATA 1 (FAS1) pine homolog encoding one of the three subunits of the histone chaperone Chromatin Assembly Factor-1 (CAF-1). Its Ara-bidopsis counterpart is required during post-embryonic de-velopment, for proper organization and function of both apical meristems, however it appears not to be needed dur-ing embryo development, at least durdur-ing Arabidopsis late embryogenesis [67].
The transcriptome of P. pinaster embryogenesis is abundant in transcripts possibly encoding enzymes for post-translational modification of histone subunits, in particular E2 ubiquitin-conjugating enzymes. Pp30887, a putative pine homolog of E2 ubiquitin-conjugating en-zyme 28 gene, is differentially expressed and up-regulated in early and middle embryogenesis (cluster 1). These pro-teins are known to perform H2B monoubiquitination that has been associated with transcriptional activation (reviewed in [68]). Histone lysine methylation also plays a relevant role in pine embryogenesis considering the iden-tification of the differentially expressed transcripts Pp44003 and Pp33894, putatively coding for an ARABI-DOPSIS TRITHORAX-RELATED PROTEIN 6 (ATXR6) (in cluster 3) and a SU(VAR)3–9-RELATED protein 5 (SUVR5) (in cluster 10), respectively. ATXR5 and ATXR6, involved in the repressive chromatin modification H3K27 me1, contribute to keep the constitutive heterochromatin status, in most cases of transposons and other repetitive and silent elements, and to prevent re-replication to occur in the same cell cycle [69,70]. On the other hand, SUVR5 is responsible for the repressive chromatin modification H3K9me2, independently of the presence of DNA methyla-tion [71], whose presence is usually associated to
transposon silencing and DNA methylation control, being predominant in pericentromeric/centromeric regions [72].
A putative homolog of VARIANT IN METHYLA-TION 1/ORTHRUS 2 (VIM1/ORTH2) gene, a methyl cytosine-binding protein that collaborates with DNA METHYLTRANSFERASE 1 (MET1) to promote CpG methylation and centromeres organization [73, 74], was also found in our data (Pp11214) showing a maximum expression in the earlier embryo stages (cluster 3) and decreasing towards the mature embryo. In Picea abies, VIM1 was found differentially expressed between som-atic embryos in the early morphogenesis stage grown under two distinct temperature conditions (18 °C and 30 °C), being up-regulated at higher temperature [23]. However, Pp3794, which is an homolog of the plant
DO-MAINS REARRANGED METHYLTRANSFERASE 2
(DRM2), a major de novo DNA methyltransferase gene responsible for DNA methylation in all sequence con-texts (CG, CHG and CHH) (reviewed by [75]), followed an expression profile peaking at Day5, but increasing from middle embryogenesis towards maturation (cluster 5). DRM2 maintains CHH methylation through de novo methylation, typically within the RNA-directed DNA methylation (RdDM) pathway (reviewed in [76]). Al-though the expression of the pine putative DRM2 peaks before reaching maturation, a tendency for a steady increase from the middle embryo stages up to the mature embryo was detected. This observation is in agreement with studies in Arabidopsis showing that mature embryos exhibit saturation of the CHH methylation sites, and a higher activity of RdDM and expression of DRM2 when comparing with early em-bryos [77, 78].
Finally, many transcripts associated with RNA silen-cing have been found in the pine embryo transcriptome. Within this group, it is worth highlighting Pp12441, a putative pine homolog of the RNA silencing player ARGONAUTE 2 which has been associated with biotic stress response [79], up-regulated during early and mid-dle embryogenesis (cluster 1).
Conclusions
This work provides an additional resource to help understand the gene regulation and major events associ-ated with embryogenesis progression in conifers. By using RNA-seq technology to access the genes being expressed at specific embryo developmental stages, we have extended the previously published transcriptome profiling of maritime pine zygotic embryogenesis which had been obtained with DNA microarray hybridization technology. One such important outcome is that carbohydrate transport and metabolism was found clearly over-represented in early embryo stages. Either the analysis of functional categories assigned to
eggNOGs, or the enrichment analysis of the differen-tially expressed transcripts and identification of many putative glycoside hydrolases and carbohydrate trans-port genes, point towards their relevant role in pine embryo development. Another relevant outcome pro-viding strong support to previous studies is the predomin-ance, during early and middle embryogenesis, of several events of chromatin remodelling evidenced by an active synthesis of histones and their post-translational modifiers associated to increased transcription, as well as silencing of transposons.
While there is no genome published for P. pinaster, this transcriptome of reference for pine zygotic embryo-genesis is useful to the plant research community fo-cused on the improvement of the vegetative propagation of conifers through somatic embryogenesis.
Methods Plant material
Immature female cones were collected from open-polli-nated P. pinaster Ait. trees growing in a clonal seed orchard at Mata Nacional do Escaroupim, Portugal (Longitude 8° 44’W, latitude 39°4’N). This seed orchard was established by top grafting of clones genetically selected in a half-sib progeny test. The plus trees were originally selected in Mata Nacional de Leiria (Portugal) in 1963/64 [80]. The trees are part of an experimental plantation established for research on land of the Portuguese government. The cones were ob-tained from INIAV (Oeiras, Portugal), Ministério da Agri-cultura, Florestas e Desenvolvimento Rural, and were provided upon permission by the forest engineers Alex-andre Aguiar and Isabel Carrasquinho, complying with in-stitutional and national guidelines.
The collection period occurred between mid June and end of July. Seeds were removed and used to isolate em-bryos as previously described in [36]. Each embryo was quickly evaluated for developmental stage following the staging system described by [30], the suspensor was re-moved, and the embryo immediately frozen in liquid ni-trogen into different pools according to the stage. Five different embryo developmental stages were considered as follows: Day0 included the early embryo stages T0, T1 and T2; Day5 included the pre-cotyledonary embryo stages T3 and T4; Day11 included the early cotyledonary embryo stage T4B; Day15 included the cotyledonary embryo stage T5; and Day25 included the mature em-bryo stage T7. Depending on the emem-bryo stages, each pool contained 20–65 zygotic embryos. Several separate pools were prepared for each stage and samples were stored at− 80 °C until further analysis.
RNA extraction and sequencing
RNA extraction from each embryo pool was performed with RNeasy Plant Mini kit (Qiagen, Valencia CA, USA),
using buffer RLC, according to the manufacturer’s instruc-tions. RNA yield and purity were determined using ND-1000 spectrophotometer (NanoDrop, Wilmington DE, USA), and integrity was checked by electrophoresis in 0.8% agarose gel and staining with RedSafe™ Nucleic Acid Stain-ing Solution (iNtRON Biotechnology). RNA samples were cleaned from DNA contamination using RNase-Free DNase I (Qiagen), according to manufacturer’s instructions. Total RNA samples from the five embryo stage pools (one biological replicate), were sent to the sequencing service provider where Illumina RNA-seq libraries were prepared and sequenced using the HiSeq 2000 platform.
RNA-seq data pre-processing and comprehensive assembly A comprehensive transcriptome assembly approach [31] reviewed in [32] was adopted to generate the reference transcriptome (Software was run with default parameters unless otherwise indicated): The raw reads were filtered with Trimmomatic (v 0.32; [81]) using the default options for paired-end (PE) reads to remove Illumina adaptor se-quences, reads with low quality or complexity (SLIDING-WINDOW:4:5), 5 bp from both ends (LEADING:5 TRAILING:5) and reads shorter than 25 bp (MINLEN:25). All the clean reads were used for de novo assembly with Trinity, but only pairs where both reads remained were used for the guided assembly or expression analysis. Trinity (v 2.0.6; [33]) was used to generate a de novo assembly with default parameters, plus “--min_glue 4 --CuffFly --group_-pairs_distance 600 --genome_guided_max_intron 10000”. The P. taeda genome and annotations (v 1.01) were downloaded from the genome project at the University of California [34]. Clean pairs of reads from each embryo stage were independently aligned to this P. taeda genome using GSNAP without gene annotation (v 2014-08-04; [82]). We only used“concordant paired” alignments where both reads in a pair align with a minimum length of 25 bp (50 bp per alignment), in the right forward-reverse orien-tation and insert length distance. The read alignments from all the stages, together with the P. taeda gene anno-tation, were used as input in Cufflinks (v. 2.2.1; [83]) to re-construct another set of transcripts. The final step involves combining both set of transcripts, from Trinity and Cufflinks: These transcripts were aligned to the P. taeda genome with GMAP (v 2014-12-22, [84]), and the aligning transcripts were clustered by locus with PASA (release 20,140,417; [85]). However, the transcripts that did not align on the P. taeda genome were clustered by sequence using CD-HIT with“-pid 1” (v 4.6.3; [86]), later validated by checking the presence of a clear ORF within each of them with TransDecoder (v 2.0.1; [87]) using all the Viridiplantae proteins in UniProt as reference, and fi-nally concatenated to the previous transcripts (those clus-tered by locus). To produce the final comprehensive transcriptome, we filtered out the 602 short transcripts
without an ORF and shorter than 200 bp. These 602 tran-scripts are listed in Additional file2.
Functional annotation
Transcripts were compared with the NCBI non-redundant (nr) and Arabidopsis TAIR protein databases using NCBI BLASTX with an E-value of 1e-10. Results were imported in Blast2GO [88] to annotate the GO terms, enzymatic pro-tein codes and KEGG pathways. The conserved motifs and structures in the transcripts were identified by comparison against the motifs databases in EBI InterPro (http://www.e bi.ac.uk/interpro/interproscan.html). We used the Plant
Transcription Factor database (PLNTFDB, http://
plntfdb.bio.uni-potsdam.de/) as reference to identify the TFs and other transcriptional regulators in our transcriptome. The database contains close to 30,000 protein sequences of experimentally-identified elements from diverse plant spe-cies, and their classification in families according to their protein domains by HMM methods. The sequences of the differentially expressed transcripts were aligned to the PLNTFDB using BLASTX and a minimum E-value of 1e-10. We considered any transcript with a result under that threshold as a TF/transcriptional regulator, and annotated it within the family of the homologous with a lower E-value.
All ORF possibilities were generated from the newly assembled transcriptome using TransDecoder as previ-ously described, but only the longest ORF per transcript was retained in the final P. pinaster proteome. We clas-sified any assembled transcript where TransDecoder could not identify an ORF as non-coding. The transcrip-tomes of other conifers were downloaded from the Pine-RefSeq project at University of Davis. The proteome for each of them was built in a similar way as for P. pinaster with TransDecoder. Best reciprocal hits (BRH) were identified by aligning all the proteins against each other with BLASTP with an E-value of 1e-5. Any annotation from the close relatives was assigned back to the original P. pinaster transcript. The proteins from P. pinaster, P. taeda and P. lambertiana were clustered together ac-cording the eggNOG group of their respective best orthologous sequenced in EBI’s eggNOG database of functionally annotated proteins. Each protein was firstly aligned to a database of proteins that have already been categorized, and then annotated with the eggNOG num-ber of its best homolog. Clusters of proteins were made among the three conifer species by concatenating the proteins annotated with the same eggNOG number. The annotated database of protein sequences and descrip-tions is available to download at EMBL (http://eggnogdb .embl.de/).
Analysis of expression, gene enrichment and clustering The clean reads from each of the developing stages were aligned to the comprehensive transcriptome with Bowtie
(v 2.2.5; [89]) and retaining only pairs of reads mapping in the right distance and orientation (−-very-sensitive -X 1000 --no-mixed --no-discordant). From these align-ments, the abundance of each transcript was quantified in each stage using eXpress (v. 1.5.1; [90]) to produce a table of counts that was used downstream in edgeR [91]. Transcripts with less than 10 counts were discarded at this point. Due to the technical difficulties in isolating enough amounts of zygotic embryos at the very early stages of development, we do not have replicated libraries. To minimize the impact of the lack of repli-cates, we followed the protocol recommended by the developers in such cases [92]: a common dispersion was calculated for the whole dataset with“x = DGEList(roun-d(read.delim(‘eXpress.eff_counts’)),group=c(1,1,1,1,1); x = calcNormFactors(x); x = estimateDisp(x);”, and later dif-ferentially expressed transcripts were identified between each pair of consecutive stages at FDR < 0.05 using edgeR’s exact test “exactTest()”, which allows both common dispersion and single factor experiments (time in ours).
Differentially expressed transcripts were divided in clusters according to the normalized number of aligned reads in each stage by K-means clustering implemented in Mayday [93] based on Euclidian correlation between expression values. The list of transcripts in each cluster was used in Blast2GO to identify the enriched GO terms. The enrichment analysis was based on a F-fisher test (FDR < 0.05). The relation among GO terms was assigned using REVIGO with the Resvik algorithm option [94] and plotted in R with the Treemap library (github.com/mtennekes/treemap.git). To build the ex-pression heatmap by functional categories, the counts of each transcript belonging to a protein group in such cat-egory were added up, and later transformed in Z-scores, clustered, and plotted in a heatmap using Mayday [93]. Expression validation by RT-qPCR
A subset of genes from the de novo assembled P. pinaster transcriptome was selected, based on differential expression and/or epigenetic-related annotation, to validate the RNA-seq results by RT-qPCR. Primer3Plus (http://pri mer3plus.com/cgi-bin/dev/primer3plus.cgi) was used to de-sign the RT-qPCR primers, with the following conditions: 50–60% of GC content and Tm between 50 and 65 °C (according to Nearest Neighbor Tm); should bind the 5′ or 3′ less conserved regions of the transcript; the ampli-con size of 75–200 bp (Additional file 18). The quality of the primers was verified with PCR Primer Stats (http:// www.bioinformatics.org/sms2/pcr_primer_stats.html) and OligoAnalyzer 3.1 (https://eu.idtdna.com/calc/analyzer).
RNA samples were first quantified in Qubit 3.0 Fluor-imeter using the RNA BR Assay kit (Thermo Fisher Scientific). The cDNA synthesis was performed using the Transcriptor High Fidelity cDNA Synthesis Kit
(Roche Diagnostics), according to the manufacturer’s in-structions in the Standard Procedure for Quantitative RT-PCR, adding 1000 ng of total RNA per 20 uL reac-tion mix. Three biological replicates were prepared for each embryo stage pool.
All qPCR experiments were performed in a Light-Cycler 480 (Roche Diagnostics) with 96-well white plates (Roche Diagnostics), where each 20 uL qPCR reaction mixture included 1X SYBR Green I Master (Roche Diagnostics), 500 nM of each primer and 2 uL of 1:20 diluted cDNA. Three technical replicates were prepared for each biological replicate. The amplifica-tion program was the same for all genes, with slight differences in the annealing temperatures: 95 °C for 10 min, 40 cycles of 10 s at 95 °C, 20 s at annealing temperature and 8 s at 72 °C (annealing temperatures in Additional file 18). To check for the presence of a single peak upon amplification, melting curves were obtained. In order to discard any possibility of remnant gDNA contamination, control samples were prepared from the same RNAs but in the absence of the Reverse Transcriptase enzyme, and used as tem-plates in qPCR amplification with the ELF1A primers, where the absence of signal proved the effectiveness of the previous RNase-free DNase I (Qiagen) treat-ment. As additional controls, non-template controls (NTC) and positive controls were included in all runs. Additionally, three biological replicates of a pool sam-ple, prepared from equal amounts of total RNA from each of the five embryo stage pools, were also in-cluded in all runs. The efficiency of each pair of primers was manually calculated according to [95], using the Cp values retrieved by the ROCHE LC480 software (Additional file 18). The relative expression of each gene of interest (GOI) was efficiency cor-rected as described in [95], using ELF1A, ATUB and Histo3 as reference genes, which showed up as reli-able reference genes in a previous study on P. pinas-ter somatic embryogenesis [96].
The data obtained from the RNA-seq experiment
and the RT-qPCR were compared. From the
RNA-seq a logarithmic ratio of base 2 between the counts (from eXpress) of a gene in each developmen-tal stage and the mean counts of the same gene in all developmental stages were made. A similar ap-proach was followed for the data obtained by RT-qPCR by doing a logarithmic ratio of base 2 be-tween the normalized quantities (delta-delta-Ct) of the gene of interest in each developmental stage and the mean normalized quantities of the same gene in all developmental stages in analysis. If expression could not be detected by RT-qPCR after 35 cycles, we assigned an expression value lower than the pre-vious detected.
Additional files
Additional file 1:List of all sequences of proteins in the final proteome encoded by the reference transcriptome of P. pinaster zygotic embryogenesis. Only the longest ORF possibility per transcript was translated into protein sequence to generate the final proteome. (FASTA 14164 kb)
Additional file 2:Reference transcriptome of P. pinaster zygotic embryogenesis with annotations from BRH to the proteomes of P. taeda, P. lambertiana and A. thaliana, and from homology to proteins in NCBI databases. Table S1: List of assembled transcripts, longest ORFs, and corresponding predicted proteins. Table S2: Annotation information for the predicted proteins derived from the longest ORFs. Table S3: List of short non-coding transcripts without an ORF that were excluded. (XLSX 11164 kb)
Additional file 3:E-value distribution of the BLAST hits resulting from the BLASTX alignment of the P. pinaster transcriptome to the NCBI non-redundant proteins database. (PNG 74 kb)
Additional file 4:The functional annotation of P. pinaster transcriptome
done with Blast2GO generated different charts. The“data distribution” chart
shows the distribution of un-blasted (with BLAST (without hits)), blasted (with BLAST hits), mapped (with mapping) and annotated (with GO
annota-tion) transcripts over the whole transcriptome. The“GO mapping
distribu-tion” chart is a representation of the amount of GO terms assigned to each
sequence during the GO Mapping step. The third chart represents the num-ber of annotations achieved at distinct GO levels (0-to-15), listing the GO terms by biological process (P), molecular function (F) and cellular
compo-nent (C). The“annotation distribution” chart shows the number of
se-quences annotated with different amounts of GO terms. (PDF 2905 kb)
Additional file 5:Distribution of the sequence similarities (percentage) that were calculated for the BLAST hits. (PNG 79 kb)
Additional file 6:Distribution of species to which most transcripts were aligned when only considering the Top-BLAST hits. (PNG 103 kb)
Additional file 7:InterProScan (IPS) results showing the number of transcripts with and without IPS as well as with GO terms retrieved by this annotation step. (PNG 45 kb)
Additional file 8:Distribution of the number of GO terms, retrieved by the Blast2GO mapping step, per database resource. (PNG 24 kb)
Additional file 9:List of proteins from P. pinaster, P. taeda and P. lambertiana clustered together according to the eggNOG group of their
respective best orthologous sequenced in EMBL’s eggNOG database of
functionally annotated proteins. (TXT 3127 kb)
Additional file 10:Number of proteins from P. pinaster, P. taeda and P. lambertiana clustered together according to the eggNOG group of their
respective best orthologous sequenced in EMBL’s eggNOG database of
functionally annotated proteins. Information on each eggNOG group is complemented by a general category and its description. (XLSX 844 kb)
Additional file 11:Transcripts abundance per developmental time point (0D_eff_counts to 25D_eff_counts). (XLSX 4407 kb)
Additional file 12:Results from the edgeR analysis for the identification of differentially expressed transcripts between each pair of consecutive stages at FDR < 0.05. Fold-change (FC), counts per million (CPM) and p-value data are shown per developmental transition and transcript. Table S4: Complete list of transcripts analysed with edgeR. Table S5: Exclusive list of 1738 differentially expressed transcripts along embryo development, includ-ing the number of the cluster of expression profile. (XLSX 2943 kb)
Additional file 13:REVIGO TreeMap representation of GO terms enrichment analysis associated with biological process GO terms found in the list of 204 differentially expressed transcripts down-regulated in transi-tion from Day0 to Day5. (PNG 62 kb)
Additional file 14:REVIGO TreeMap representation of GO terms enrichment analysis associated with biological process GO terms found in the list of 594 differentially expressed transcripts up-regulated in transi-tion from Day0 to Day5. (PNG 50 kb)
Additional file 15:REVIGO TreeMap representation of GO terms enrichment analysis associated with biological process GO terms found in the list of 344 differentially expressed transcripts down-regulated in transition from Day15 to Day25. (PNG 167 kb)