INTRODUCTION
Ecological systems are naturally complex and inher-ently variable, and there is an increasing appreciation that more knowledge about this variability is crucial to understanding the ecological processes structuring these systems. Because different ecological processes generate variability at different scales, examination of patterns across a range of spatial scales is a funda-mental step before explanatory models for these pat-terns can be proposed (Underwood & Chapman 1996, Hewitt et al. 2007). The development of analytical ap-proaches, such as hierarchical designs and estimates of
variance components, allow variability to be examined at a range of spatial scales, from very small variability at the scale of the sampling unit, to large geographic comparisons (Underwood 1997).
Rocky intertidal communities have been extensively studied and have proved to be tractable systems for experimental ecology, contributing much to our gen-eral understanding of population and community ecol-ogy. There is an extensive literature on most aspects of assemblage structure, including manipulative experi-ments to test models of competition (e.g. Connell 1961), predation or herbivory (e.g. Paine 1974, Cole-man et al. 2006). More complex designs have tested
© Inter-Research 2008 · www.int-res.com *Email: [email protected]
Rocky intertidal community structure in
oceanic islands: scales of spatial variability
Gustavo M. Martins
1, 2, 3,*, Richard C. Thompson
1, Stephen J. Hawkins
3, 5,
Ana I. Neto
2, Stuart R. Jenkins
3, 41Marine Biology and Ecology Research Centre, Marine Institute, University of Plymouth, Plymouth PL4 8AA, UK 2Secção Biologia Marinha and CIRN, Departamento Biologia, Universidade dos Açores, 9501-801 Ponta Delgada,
Açores, Portugal
3Marine Biological Association, Citadel Hill, Plymouth PL1 2PB, UK
4School of Ocean Sciences, University of Wales Bangor, Menai Bridge, Anglesey LL59 5EY, UK 5College of Natural Sciences, University of Bangor, Bangor, Gwynedd LL57 2UW, UK
ABSTRACT: There is a clear bias in the literature on island ecology towards terrestrial rather than marine systems, which have remained comparatively poorly studied. Marine populations are typi-cally open, and local production may have little impact on local recruitment, such that long-distance dispersal is an important determinant of population ecology. Since oceanic islands form discrete patches of habitat surrounded by a structurally different environment, we tested the general hypo-thesis that processes operating at the scale of islands have a greater influence on these populations than the processes operating at smaller, intra-island scales. A hierarchical design examined the pat-terns of abundance and distribution of conspicuous taxa at 3 tidal heights at a range of spatial scales, ranging from a few meters to hundreds of kilometres apart in the rocky intertidal of the Azores. Both uni- and multivariate analyses showed that at the largest scale (islands), significant variation was detected in the lower and mid-shore communities, but not on the upper shore. Along the vertical gradient of immersion there was a trend for increasing small-scale patchiness towards the top of the shore. The potential role of local environmental stress gradients and broad-scale oceanographic patterns of recruitment in structuring these assemblages is discussed. This study corroborates the suitability of the analytical tools used here to examine patterns of distribution over a range of spatial scales and its applicability in the field of island marine ecology.
KEY WORDS: Hierarchical analysis · Variance component · Spatial scale · Community structure · Rocky intertidal · Fragmented habitats · Oceanic island · Azores · Assemblage biogeography
models on the interplay between physical and biologi-cal factors (e.g. Thompson et al. 2004). Furthermore, there has been considerable analysis of spatial and temporal scales of variability of intertidal populations over the last decade (Underwood & Chapman 1996, Benedetti-Cecchi 2001, see Fraschetti et al. 2005 for review).
Habitat loss and fragmentation are among the princi-pal factors leading to biodiversity loss (Pimm & Raven 2000), prompting considerable research on the study of habitat patchiness. Archipelagos form highly frag-mented habitats surrounded by a structurally different system and are useful to test ecological hypotheses that can be of relevance to a range of other patchy habitats, including marine protected areas, seamounts, and freshwater lakes. In recent years, island ecology has been dominated by island biogeography theory based on MacArthur & Wilson (1967), which posits that the number of species on islands results from the balance between immigration and extinctions — the former in-fluenced by the distance from the mainland and the lat-ter by the effect of island area acting on population size. Thus, a common approach has been to count the num-ber of species on islands of differing sizes and relate these patterns of species richness to the geographical or physical attributes of islands (Báldi & McCollin 2003). However, the model of island biogeography has been fraught with difficulties owing to the accumulation of contradictory results and the study of island ecology has more recently embraced a meta-population ap-proach (Lomolino 2000, Báldi & McCollin 2003). Al-though the importance of carrying out work over a greater range of spatial scales in the study of islands has been stressed (e.g. Whittaker 2000), such studies have remained scarce; the literature on marine island ecology has lagged behind that on terrestrial ecosys-tems (but see Tuya & Haroun 2006, Cornell et al. 2007).
A suite of analytical procedures is now available to ecologists that allows us to examine patterns of distribution at a range of spatial (or temporal) scales not previously possible. The few studies that have applied these methodologies to marine island ecology (e.g. Ramírez et al. 2005, Tuya & Haroun 2006) have provided valuable insights into the processes shaping these populations. Hence one of the principal objectives of this study was to identify the relevant scales of variation in order to help focus our attention on the physical and biolog-ical factors that most probably influence these systems.
In addition, oceanic islands form pat-ches of habitat surrounded by a
struc-turally different oceanic environment. In such open sys-tems larval retention is probably low and local produc-tion may have little impact on local recruitment (Hughes et al. 1999, Swearer et al. 1999). Since the ma-jority of intertidal animals and plants have at least a short planktonic phase during their life-cycle, and be-cause the capability to disperse over long distances is a strong determinant of the biogeography of sessile marine organisms which vary noticeably among spe-cies (Johnson et al. 2001), it has been suggested that the processes operating at larger scales may play a key fac-tor in the population biology and in structuring marine island communities. Thus, as a second objective of this study, we examined the proposition that regional-scale processes are central in structuring marine island com-munities and that this will be detected by greater inter-island variability (i.e. among different inter-islands) rather than intra-island variability (i.e. at the scale of shores or sites; see ‘Materials and methods’).
MATERIALS AND METHODS
Study site and community. The present study was done in the Azorean archipelago, which comprises 9 volcanic islands and several small islets organised into 3 separate groups (eastern, central and western), and is located between 37 to 40° N and 25 to 31° W (Fig. 1). The islands are surrounded by deep water (~1000 m) and the coastline presents a convoluted topography with high and steep cliffs alternating with rocky beaches (Morton et al. 1998). Shores are exposed to medium and high levels of wave action with shel-tered areas restricted to harbours.
Tidal range in the archipelago never exceeds 2 m above Chart Datum (CD) although some intertidal or-ganisms such as chthamalid barnacles and littorinids
Flores Western group Central group Graciosa Pico N Eastern group São Miguel 39° 38° 37° N 31°W 29° 27° 25°
can extend their vertical distribution far above this level due to frequent swell and wave splash. The present study was carried out at 3 shore heights corresponding to distinct communities: low shore algal-dominated levels (1.20 ± 0.10 m above CD), mid shore levels (1.90 ± 0.10 m above CD) at the boundary between the turf-forming algae and barnacle/rock cover, and upper-shore animal-dominated levels (2.50 ± 0.10 m above CD) towards the upper limit of limpets and barnacles. Heights were determined in relation to low water using levelling poles. The most abundant organisms through-out the archipelago were turf-forming algae lower on the shore and the chthamalid barnacle Chthamalus stellatus higher up. Among patellid limpets, Patella candei was the most common grazer at mid-shore lev-els, whereas P. aspera was also present on the low shore. Fucus spiralis formed scattered clumps at mid-shore levels, while Sargassum spp. and Cystoseira spp. were commonly found in rock pools. Upper-shore graz-ers included the littorinids Littorina striata and Me-larhaphe neritoides. Mussels, a dominant space occu-pier on most temperate rocky shores, were absent, while canopy algae, which are an important habitat modifier on many shores worldwide, were rare.
Sampling design. A hierarchical design was adopted to examine patterns of species distribution at 4 islands separated by 120 to 515 km. Islands were randomly selected but stratified to encompass at least one island per group (western, central and eastern) and hence cover the whole archipelago (Fig. 1).
Within each island, we selected 3 exposed locations (located several kilometres apart) at random. Within each location, 3 sites (at least 20 m apart) comprising a stretch of coast of 20 m were randomly selected and 5 replicate quadrats (a few metres apart) of 25 × 25 cm randomly placed on well-drained rock were used at each tidal level at each site. Digital photography was used to rapidly assess assemblage structure and hence allow for a high level of geographical coverage and replication. Photographs were analysed by overlaying 50 random points and recording the organisms beneath. The lack of abundant erect algae allowed this approach to accurately determine percentage cover of major space occupiers. The abundance of coralline turf (e.g. Corallina elongata, Jania spp.), coarsely branched algae (e.g. Gelidium spp., Callithamnion spp., Os-mundea spp.), foliose algae Ulva spp., canopy-forming algae Fucus spiralis and the barnacle Chthamalus stel-latus were expressed as percentage cover. Mobile invertebrates such as gastropods were counted and expressed as number per quadrat. Organisms that were scarce at the levels examined (e.g. encrusting and erect corallines Melaraphe neritoides) or difficult to identify against a black basaltic background (e.g. the encrusting alga Ralfsia spp.) were not analysed.
Data analysis. Univariate analysis: To examine patterns of spatial variation we used a 3-way fully nested ANOVA for each tidal height. Factors were island (random, 4 levels), shore (random, 3 levels) and site (random, 3 levels) with 5 replicates. Cochran’s test was used to check homogeneity of variances and trans-formations applied where necessary (Underwood 1997). Occasionally, heterogeneity of variances per-sisted after transformation. In these cases, analysis was done on untransformed data, since ANOVA is robust to departures from this assumption where replication is high (Underwood 1997). However, a more conserva-tive p-value (< 0.01) was used.
MS estimates were used to assess the variation asso-ciated with each scale. This was done by dividing the difference between the MS of the term of interest and the MS of the term hierarchically below by the product of the levels of all terms below that of interest. Nega-tive estimates of variation were removed from the analysis and all the other values were recalculated fol-lowing the procedure described by Fletcher & Under-wood (2002). Estimates of spatial variation were re-ported as actual variances to guarantee independence and allow comparisons with other habitats, but also as percentages to ascertain the magnitude of each scale’s contribution to patterns of distribution.
Multivariate analysis: To examine patterns of as-semblage structure at different spatial scales, the same general procedure as described for the univariate analysis was applied, but using a distance-based mul-tivariable analysis of variance (PERMANOVA, Ander-son 2001). The multivariate pseudo-variance compo-nents can be considered as analogues to the univariate ANOVA estimators (M. J. Anderson pers. comm.) and these were used to calculate the components of varia-tion associated with each term in a similar way as described for the univariate analysis. Graphical repre-sentation of the centroids for sites used non-metric dimensional scaling (MDS). All multivariate analyses were performed on untransformed data, using Bray-Curtis dissimilarity measures and 999 permutations.
RESULTS Univariate analysis Low shore community
The lower-shore community was dominated by algal turf assemblages mainly composed of coralline (e.g. Corallina spp.) and coarsely branched (e.g. Gelidium spp.) algae. Macroinvertebrates were scarce and re-stricted to a few individuals of Patella aspera. Three morphological groups of algae were considered for
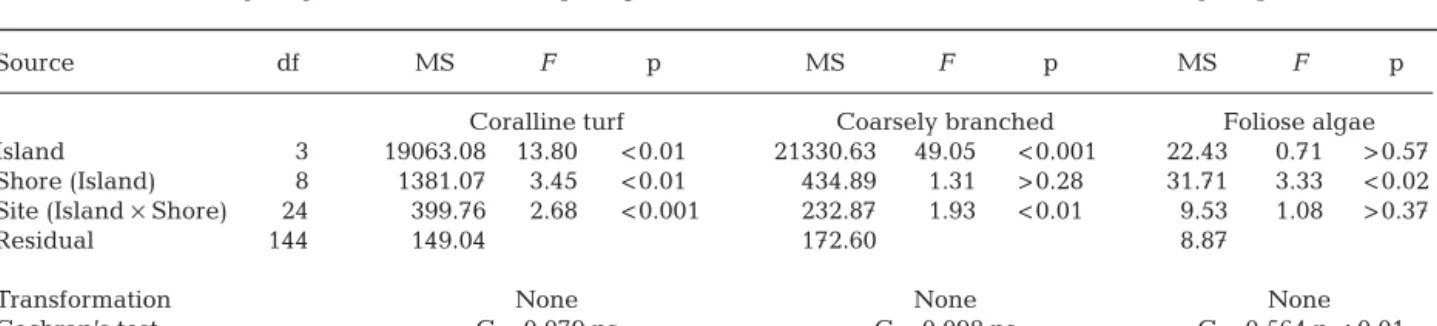
analysis. These differed significantly in their patterns of spatial variability (Fig. 2, Table 1). Coralline turfs and coarsely branched algae showed significant varia-tion at both small and large spatial scales, but for both, the processes generating inter-island variation was responsible for most of the overall variability (Table 2). Mean percentage cover varied among islands from 35 to 78% and from 13 to 59% in coralline turfs and coarsely branched algae, respectively (Fig. 2). In con-trast, foliose algae showed no variation at this spatial scale (Table 1) but had high variability at the smaller scale of quadrats (Table 2).
Mid-shore community
The mid-shore community structure was a mixture of both algae and animals (Figs. 3 & 4). These formed a mosaic structure consisting of algal patches, mainly composed of coarsely branched algae and in few loca-tions of Fucus spiralis, interspersed among patches of barnacles and bare space. Limpets were the main grazing gastropods and were found in algal-free patches. Among the algae, 3 morphological groups were relatively abundant but differed significantly in their patterns of distribution (Fig. 3, Table 3). Coarsely branched algae showed no significant variation at either the scale of island or site (Table 3) and most vari-ability was present at the scale of quadrats (Table 2). In contrast, foliose algae and F. spiralis showed signifi-cant variation at the scale of islands, ranging in cover between 1 and 8%, and 0 and 7%, respectively (Fig. 3, Table 3), but for both, the scales associated with most variation differed. Whilst for foliose algae most of the variation was similarly associated with both the larger (38%) and smaller (45%) spatial scales, for F. spiralis the processes operating at the smaller scale of quadrats had much greater influence (86%) on the patterns of distribution (Table 2).
Patterns of spatial distribution differed substantially among invertebrates (Fig. 4). The barnacle Chthama-lus stellatus showed significant inter-island variation, Coralline turf 0 20 40 60 80 100 Coarsely branched algae 0 20 40 60 80 Foliose algae F1 F2 F3 G1 G2 G3 P1 P2 P3 S1 S2 S3 Per centage cover 0 4 8 12
Fig. 2. Low shore mean (± SE) algal cover. Each bar represents one site on each shore. Flores — F1: Fajã grande; F2: Lajedo; F3: Fajãzinha. Graciosa — G1: Porto Afonso; G2: Santa Cruz; G3: Carapacho. Pico — P1: Prainha; P2: Lajes; P3: Santa Cruz.
São Miguel — S1: Lagoa; S2: Caloura; S3: Mosteiros
Table 1. Three-way fully-nested ANOVA comparing the abundance of lower shore taxa at a hierarchy of spatial scales
Source df MS F p MS F p MS F p
Coralline turf Coarsely branched Foliose algae
Island 3 19063.08 13.80 < 0.01 21330.63 49.05 < 0.001 22.43 0.71 > 0.57 Shore (Island) 8 1381.07 3.45 < 0.01 434.89 1.31 > 0.28 31.71 3.33 < 0.02 Site (Island × Shore) 24 399.76 2.68 < 0.001 232.87 1.93 < 0.01 9.53 1.08 > 0.37
Residual 144 149.04 172.60 8.87
Transformation None None None
ranging in mean cover between 16% (São Miguel) and 36% (Flores) (Fig. 4, Table 3). Significant intra-island varia-tion was also detected at the scale of sites. Heterogeneity of variances meant that at a more conservative p-value, there was no significant variation asso-ciated with any scale for Patella aspera (Table 3). However, patterns of distrib-ution of the conspecific P. candei dif-fered among shores (Fig. 4, Table 3). For all mid-shore invertebrates the greatest proportion of spatial variation was associated with the smallest scale of quadrats (Table 2).
Upper-shore community On the animal-dominated upper-shore, erect algae were reduced to a few plants of Ulva rigida, but these were mostly restricted to pits or crevices. Patella candei was the only limpet found at this tidal height but its abundance was low. We limited our analysis to the 2 most abun-dant species: Chthamalus stellatus and Littorina striata (Fig. 5). Both species showed similar patterns of spatial distribution with significant intra-island variation at the scales of shore and site, but not at the scale of islands (Table 4). For both species, a greater proportion of variability was associated with the smaller scale of quadrats, whilst intermediate levels of variation were found at the scales of shore and site (Table 2).
Multivariate analysis
Significant variation in the assemblage structure was detected at all spatial scales both on the lower- and mid-shore tidal heights (Fig. 6, Table 5). In contrast, the structure of upper-shore assemblages was similar among the 4 islands examined, although there was significant intra-island variation. Inter-island variabil-ity was high lower on the shore but decreased with increasing shore height (Table 6). Residual variation, however, was low at the bottom of the shore and high at both the mid- and upper-shore assemblages.
DISCUSSION
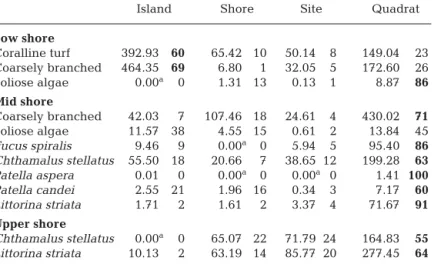
The structure of rocky intertidal communities in tem-perate oceanic islands has received far less attention than that of mainland coastlines. Characterization of spatial (or temporal) scales of variation is a preliminary Table 2. Univariate estimates of variance associated with each scale and
re-spective percentage contribution. Bold values denote contributions > 50% of overall variability
Island Shore Site Quadrat
Low shore Coralline turf 392.93 60 65.42 10 50.14 8 149.04 23 Coarsely branched 464.35 69 6.80 1 32.05 5 172.60 26 Foliose algae 0.00a 0 1.31 13 0.13 1 8.87 86 Mid shore Coarsely branched 42.03 7 107.46 18 24.61 4 430.02 71 Foliose algae 11.57 38 4.55 15 0.61 2 13.84 45 Fucus spiralis 9.46 9 0.00a 0 5.94 5 95.40 86 Chthamalus stellatus 55.50 18 20.66 7 38.65 12 199.28 63 Patella aspera 0.01 0 0.00a 0 0.00a 0 1.41 100 Patella candei 2.55 21 1.96 16 0.34 3 7.17 60 Littorina striata 1.71 2 1.61 2 3.37 4 71.67 91 Upper shore Chthamalus stellatus 0.00a 0 65.07 22 71.79 24 164.83 55 Littorina striata 10.13 2 63.19 14 85.77 20 277.45 64
aNegative values were set to zero following Fletcher & Underwood (2002)
Coarsely branched Per centage cover 0 20 40 60 80 Foliose algae 0 5 10 15 20 25 Fucus spiralis F1 F2 F3 G1 G2 G3 P1 P2 P3 S1 S2 S3 0 10 20 30 40
Chthamalus stellatus Per centage cover 0 20 40 60 Patella aspera 0.0 0.5 1.0 1.5 2.0 Patella candei F1 F2 F3 G1 G2 G3 P1 P2 P3 S1 S2 S3 Density (per 625 cm 2) Density (per 625 cm 2) 0 2 4 6 8 10 12 Littorina striata F1 F2 F3 G1 G2 G3 P1 P2 P3 S1 S2 S3 0 10 20 30 40
Fig. 4. Mid-shore mean (+ SE) animal abundance. Legend as in Fig. 2
Table 3. Three-way fully-nested ANOVA comparing the abundance of mid shore taxa at hierarchy of spatial scales
Source df MS F p MS F p MS F p
Coarsely branched Foliose algae Fucus spiralis
Island 3 4056.27 1.87 > 0.21 27.65 12.88 < 0.01 9.53 14.34 < 0.01 Shore (Island) 8 2165.01 3.91 < 0.05 2.15 4.09 < 0.01 0.66 0.34 > 0.94 Site (Island × Shore) 24 553.07 1.29 > 0.18 0.52 1.03 > 0.43 1.96 2.39 < 0.001
Residual 144 430.02 0.51 0.82
Transformation None sq rt ln(x+1)
Cochran’s test C = 0.085 ns C = 0.121 ns C = 0.118 ns
Chthamalus stellatus Patella aspera Patella candei
Island 3 3200.15 4.56 < 0.05 1.67 7.35 < 0.02 153.07 3.99 > 0.05 Shore (Island) 8 702.45 1.79 > 0.12 0.23 1.11 > 0.39 38.33 4.33 < 0.01 Site (Island × Shore) 24 392.51 1.97 < 0.01 0.21 1.23 > 0.22 8.86 1.23 > 0.22
Residual 144 199.28 0.17 7.17
Transformation None None None
Cochran’s test C = 0.099 ns C = 0.283 p < 0.01 C = 0.134 ns
Littorina striata
Island 3 189.53 1.68 > 0.24
Shore (Island) 8 112.62 1.27 > 0.30 Site (Island × Shore) 24 88.53 1.23 > 0.22
Residual 144 71.97
Transformation None
step to experimental testing of hypotheses. Identifica-tion of appropriate scales can centre our attenIdentifica-tion on the most relevant processes (Benedetti-Cecchi 2001), while integrative studies, including manipulative
ex-periments across identified significant scales of varia-tion, are an important means of scaling up from local manipulative experiments (Hewitt et al. 2007). More-over, partitioning natural variability across a range of spatial scales is useful for comparisons with other stud-ies and habitats, provided that similar scales are used. Much experimental work has provided evidence of the small-scale processes influencing rocky intertidal populations. For instance, small-scale variation may result from spatial differences in pre-recruitment pro-cesses, such as the dispersal of larvae or propagules (Bobadilla & Santelices 2005), from recruitment itself (Coleman 2003), or from post-recruitment processes, such as grazing (Benedetti-Cecchi et al. 2001), compe-tition (Steneck et al. 1991), or mortality (Jenkins et al. 2001) and physical stress mediated by small-scale spa-tial differences in topographic features of the substra-tum (Underwood 2004) and disturbances (Sousa 1979). A high level of small-scale variation seems to be an intrinsic feature of most marine habitats, including soft-sediment habitats (Ysebaert & Herman 2002), rock pools (Metaxas & Scheibling 1993), coral reefs (Hughes et al. 1999) or seagrass beds (Piazzi et al. 2004). Whilst many studies on marine systems provide evidence of the pervasive nature of small-scale spatial variability (see Fraschetti et al. 2005 and references therein), few have examined naturally fragmented and isolated habitats such as islands.
Oceanic islands typically form discrete patches of habitat. In such open systems, larvae produced by ben-thic adults and released to the water column are dispersed away through physical transport and local larval retention may be minimal (Hughes et al. 1999, Swearer et al. 1999). Since recruitment is a key process in structur-ing marine populations (reviewed by Caley et al. 1996), we suggest that pat-terns of oceanic current transport will be a key process in structuring island populations. Although the experimen-tal manipulation of large-scale pro-cesses is fraught with difficulties, their influence on population dynamics can
Chthamalus stellatus Per centage cover 0 20 40 60 Littorina striata F1 F2 F3 G1 G2 G3 P1 P2 P3 S1 S2 S3 Density (per 625 cm 2) 0 20 40 60 80
Fig. 5. Upper shore mean (+ SE) animal abundance. Legend as in Fig. 2
Table 4. Three-way fully-nested ANOVA comparing the abundance of taxa on the upper shore at a hierarchy of spatial scales
Source df MS F p MS F p
Chthamalus stellatus Littorina striata
Island 3 1106.19 0.67 > 0.59 5.96 0.58 > 0.64 Shore (Island) 8 1647.47 3.15 < 0.05 10.22 2.97 < 0.05 Site (Island × Shore) 24 523.76 3.18 < 0.001 3.44 3.77 < 0.001
Residual 144 164.83 0.91
Transformation None ln(x+1)
Cochran’s test C = 0.078 ns C = 0.114 ns
Table 5. Three-way fully-nested PERMANOVA comparing the assemblage structure at a hierarchy of spatial scales on each tidal height
Source df MS F p MS F p MS F p
Low shore Mid shore Upper shore
Island 3 22805.27 21.48 < 0.01 14705.35 4.11 < 0.01 4163.49 0.57 > 0.77 Shore (Island) 8 1061.77 2.22 < 0.05 3576.32 2.03 < 0.05 7352.65 2.90 < 0.01 Site (Island × Shore) 24 479.12 2.29 < 0.01 1766.01 1.69 < 0.01 2537.91 2.65 < 0.01
be ascertained by examining the scale at which most variability is associated. For instance, work in the Canary Islands has detected significant inter-island variation in the abundance of several taxa (Ramírez et al. 2005, Tuya & Haroun 2006); this variation has been linked to regional-scale differences in the productivity of coastal waters. This has also been shown in frag-mented terrestrial systems, where an important pro-portion of variation is also commonly detected at the scale of landscapes (Saab 1999).
In this study, there was significant inter-island vari-ation for most taxa in the lower and mid shore but not higher on the shore. Lower-shore algal-dominated communities were mostly influenced by processes operating at the scale of islands. At mid-shore heights, however, despite significant inter-island variation, there was a greater proportion of variability at the scale of the sampling unit, except for foliose algae, which showed similar levels of vari-ability associated with both the smallest and largest scales. Both univariate and multivariate analyses concurred with these patterns, suggesting that along the vertical gradient of emersion, there is a trend for a decreasing influence of larger-scale processes with increasing shore height. This may be the result of differences in the dispersal ability between the lower-shore, algal-dominated assemblages (Bobadilla & Santelices 2005) and the higher-shore, animal--dominated communities (Johnson et al. 2001). How-ever, higher-shore assemblages were notably domi-nated by the barnacle Chthamalus stellatus and the grazing mollusc Littorina striata. Both species have planktonic larvae and hence can disperse over large spatial scales. In fact, genetic evidence indicates that, at least for L. striata, there is larval exchange among islands (De Wolf et al. 2000). This highlights the potential influence that large-scale processes (e.g. currents) may have on the distribution of these ani-mals and it is, therefore, odd that inter-island varia-tion was not detected in the present study. A more likely explanation could be that the influence of large-scale factors on upper-shore populations was masked by an interaction between the increased environmental harshness towards the top of the shore, which tends to lead to greater patchiness (Underwood & Chapman 2000), and the reduced time during which these populations are influenced by the marine environ-ment. This pattern was clear in popu-lations of C. stellatus, which showed a broad vertical distribution. At the lower limit of its distribution, there was significant variation at the largest and smallest spatial scales. However, Table 6. Multivariate estimates of pseudo variance associated with each scale
and respective percentage contribution. Bold values denote contributions > 50% of overall variability
Island Shore Site Quadrat
Low shore 483.19 62 38.84 5 53.89 7 209.68 27 Mid shore 247.31 16 120.69 8 144.37 9 1044.14 67 Upper shore 0.00a 0 262.99 17 315.76 21 959.11 62
aNegative values were set to zero following Fletcher & Underwood (2002)
Fig. 6. MDS ordination representing the community structure on the (a) low-, (b) mid-, and (c) upper-shore tidal heights. Each circle represents the centroid for that site. Black: Flores;
toward the upper limit of distribution, variation sig-nificantly increased at the smaller spatial scale.
The rocky intertidal of the Azores is characterised by hard basaltic shores exposed to high wave action with sheltered areas restricted to harbours. Any nutrients that run off from the land are quickly lost in the vast-ness of the sea and the islands’ isolation limits any such influence from the nearest land mass (Morton et al. 1998). In addition, the islands have little latitudinal variation, with similar climate among islands. Thus, the rocky intertidal of the Azores forms a rather uni-form habitat with few obvious gradients in the physical environment. Hence, the sources for the large-scale variation in the distribution and numbers of rocky intertidal animals and plants are probably related to the seasonal variation in the intensity and direction of currents, the time that larvae can spend in the water column and their ability to find suitable substratum for colonisation. Examination of the temporal and spatial patterns of settlement and recruitment could greatly benefit our understanding regarding the dynamics of these populations. However, the possibility that other processes could also produce significant variation in the structure of intertidal populations at the larger scale of islands must not be discarded. For instance, there is evidence suggesting that the influence of anthropogenic activities (e.g. fishing) can change the abundance of exploited species among islands (Tuya et al. 2006). In the present study, this could well be the case for patellid limpets, which are known to be harvested at dissimilar levels on different islands (Hawkins et al. 2000).
CONCLUSIONS
It is clear that variability is an intrinsic feature of oceanic islands. Significant variation was detected at all spatial scales examined, indicating the complexity of insular intertidal systems. As hypothesised, the pro-cesses operating at the larger scale of islands played an important role in structuring these populations. This was, however, most pronounced on the lower, algal-dominated communities, suggesting an interaction between the processes affecting the horizontal (e.g. currents, coastal productivity) and vertical (e.g. envi-ronmental harshness) patterns of distribution. The per-vasive nature of small-scale variability was also con-firmed in this study, but this was more pronounced higher in the shore as a result of increased physical stress. This study emphasises the need to use complex analyses to realistically describe patterns of variability. This can be achieved by using an integrative approach involving uni- and multivariate analyses of hierarchi-cal spatial (or temporal) shierarchi-cales of variation and analysis
of associated variance components, and should be applied in a range of ecological studies relevant to the field of island ecology.
Acknowledgements. The authors are grateful to Secretaria
Regional dos Equipamentos e Transportes (SRET) and Câmara Municipal of Santa Cruz da Graciosa for transporta-tion and accommodatransporta-tion in Graciosa. G.M.M. is personally grateful to M. A. Cabral for help during field work. G.M.M. was supported by a postgraduate grant SFRH/BD/22009/2005 by Fundação para a Ciência e Tecnologia (FCT). S.R.J. and S.J.H. were supported by NERC Grants to the Marine Biolog-ical Association of the UK. This work was partially supported by CIRN–Centro de Investigação de Recursos Naturais, FCT. This manuscript was greatly improved by the comments of 4 anonymous reviewers.
LITERATURE CITED
Anderson MJ (2001) A new method for non-parametric multi-variate analysis of variance. Austral Ecol 26:32–46 Báldi A, McCollin D (2003) Island ecology and contingent
the-ory: the role of spatial scale and taxonomic bias. Global Ecol Biogeogr 12:1–3
Benedetti-Cecchi L (2001) Variability in the abundance of algae and invertebrates at different spatial scales on rocky sea shores. Mar Ecol Prog Ser 215:79–92
Benedetti-Cecchi L, Bulleri F, Acunto S, Cinelli F (2001) Scales of variation in the effects of limpets on rocky shores in the northwest Mediterranean. Mar Ecol Prog Ser 209: 131–141
Bobadilla M, Santelices B (2005) Variation in the dispersal curves of macroalgal propagules from a source. J Exp Mar Biol Ecol 327:45–57
Caley MJ, Carr MH, Hixon MA, Hughes TP, Jones GP, Menge BA (1996) Recruitment and the local dynamics of open marine populations. Annu Rev Ecol Syst 27: 477–500
Coleman MA (2003) The role of recruitment in structuring patterns of small-scale variability in intertidal and subtidal algal turfs. J Exp Mar Biol Ecol 291:131–145
Coleman RA, Underwood AJ, Benedetti-Cecchi L, Åberg P and others (2006) A continental scale evaluation of the role of limpet grazing on rocky shores. Oecologia 147:556–564 Connell JH (1961) Influence of interspecific competition and other factors on distribution of barnacle Chthamalus stel-latus. Ecology 42:710–723
Cornell HV, Karlson RH, Hughes TP (2007) Scale-dependent variation in coral community similarity across sites, islands, and island groups. Ecology 88:1707–1715 De Wolf H, Verhagen R, Backeljau T (2000) Large scale
pop-ulation structure and gene flow in the planktonic develop-ing periwinkle, Littorina striata, in Macaronesia
(Mollus-ca: Gastropoda). J Exp Mar Biol Ecol 246:69–83
Fletcher DJ, Underwood AJ (2002) How to cope with negative estimates of components of variance in ecological field studies. J Exp Mar Biol Ecol 273:89–95
Fraschetti S, Terlizzi A, Benedetti-Cecchi L (2005) Patterns of distribution of marine assemblages from rocky shores: evi-dence of relevant spatial scales. Mar Ecol Prog Ser 296: 13–29
Hawkins SJ, Corte-Real HBSM, Pannacciulli FG, Weber LC, Bishop JDD (2000) Thoughts on the ecology and evolution of the intertidal biota of the Azores and other Atlantic islands. Hydrobiologia 440:3–17
Hewitt JE, Thrush SF, Dayton PK, Bonsdorff E (2007) The effect of spatial and temporal heterogeneity on the design and analysis of empirical studies of scale-dependent sys-tems. Am Nat 169:398–408
Hughes TP, Baird AH, Dinsdale EA, Moltschaniwskyj NA, Pratchett MS, Tanner JE, Willis BL (1999) Patterns of recruitment and abundance of corals along the Great Barrier Reef. Nature 397:59–63
Jenkins SR, Åberg P, Cervin G, Coleman RA and others (2001) Population dynamics of the intertidal barnacle
Semibalanus balanoides at three European locations:
spatial scales of variability. Mar Ecol Prog Ser 217: 207–217
Johnson MP, Allcock AL, Pye SE, Chambers SJ, Fitton DM (2001) The effects of dispersal mode on the spatial distrib-ution patterns of intertidal molluscs. J Anim Ecol 70: 641–649
Lomolino MV (2000) A call for a new paradigm of island bio-geography. Global Ecol Biogeogr 9:1–6
MacArthur RH, Wilson EO (1967) The theory of island bio-geography. Monographs in Population Biology. Princeton University Press, Princeton, NJ
Metaxas A, Scheibling RE (1993) Community structure and organization of tidepools. Mar Ecol Prog Ser 98:187–198 Morton B, Britton JC, Martins AMF (1998) Coastal ecology of
the Azores. Sociedade Afonso Chaves, Ponta Delgada Paine RT (1974) Intertidal community structure —
experimen-tal studies on relationship between a dominant competitor and its principal predator. Oecologia 15:93–120
Piazzi L, Balata D, Cinelli F, Benedetti-Cecchi L (2004) Pat-terns of spatial variability in epiphytes of Posidonia ocean-ica: differences between a disturbed and two reference
locations. Aquat Bot 79:345–356
Pimm SL, Raven P (2000) Biodiversity — extinction by num-bers. Nature 403:843–845
Ramírez R, Tuya F, Sánchez-Jerez P, Férnandez-Gil C, Bergassa O, Haroun RJ, Hernández-Brito JJ (2005) Popu-lation structure and spatial distribution of the gastropod molluscs Osilinus atrata and Osilinus sauciatus in the
rocky intertidal zone of the Canary Islands (Central East Atlantic). Cienc Mar 31:697–706
Saab V (1999) Importance of spatial scale to habitat use by
breeding birds in riparian forests: a hierarchical analysis. Ecol Appl 9:135–151
Sousa WP (1979) Experimental investigations of disturbance and ecological succession in a rocky intertidal algal com-munity. Ecol Monogr 49:227–254
Steneck RS, Hacker SD, Dethier MN (1991) Mechanisms of competitive dominance between crustose coralline algae: a herbivore-mediated competitive reversal. Ecology 72: 938–950
Swearer SE, Caselle JE, Lea DW, Warner RR (1999) Larval retention and recruitment in an island population of a coral-reef fish. Nature 402:799–802
Thompson RC, Norton TA, Hawkins SJ (2004) Physical stress and biological control regulate the producer-consumer balance in intertidal biofilms. Ecology 85:1372–1382 Tuya F, Haroun RJ (2006) Spatial patterns and response to
wave exposure of shallow water algal assemblages across the Canarian Archipelago: a multi-scaled approach. Mar Ecol Prog Ser 311:15–28
Tuya F, Sanchez-Jerez P, Haroun RJ (2006) Populations of inshore serranids across the Canarian Archipelago: rela-tionships with human pressure and implications for con-servation. Biol Conserv 128:13–24
Underwood AJ (1997) Experiments in ecology: their logical design and interpretation using analysis of variance. Cambridge University Press, Cambridge
Underwood AJ (2004) Landing on one’s foot: small-scale topo-graphic features of habitat and the dispersion of juvenile intertidal gastropods. Mar Ecol Prog Ser 268:173–182 Underwood AJ, Chapman MG (1996) Scales of spatial
pat-terns of distribution of intertidal invertebrates. Oecologia 107:212–224
Underwood AJ, Chapman MG (2000) Variation in abundance of intertidal populations: consequences of extremities of environment. Hydrobiologia 426:25–36
Whittaker RJ (2000) Scale, succession and complexity in island biogeography: Are we asking the right questions? Global Ecol Biogeogr 9:75–85
Ysebaert T, Herman PMJ (2002) Spatial and temporal variation in benthic macrofauna and relationships with environmental variables in an estuarine, intertidal soft-sediment environment. Mar Ecol Prog Ser 244:105–124
Editorial responsibility: Otto Kinne, Oldendorf/Luhe, Germany
Submitted: February 21, 2007; Accepted: September 11, 2007 Proofs received from author(s): February 13, 2008