Original article
Do we need bone mineral density to
estimate osteoporotic fracture risk?
A 10-year prospective multicentre
validation study
Andréa Marques,1,2 Raquel Lucas,3 Eugénia Simões,4 Suzanne M M Verstappen,5,7 Johannes W G Jacobs,6 Jose A P da Silva1
To cite: Marques a, lucas r, Simões e, et al. Do we need bone mineral density to estimate osteoporotic fracture risk? a 10-year prospective multicentre validation study. RMD Open 2017;3:e000509. doi:10.1136/ rmdopen-2017-000509 ►Prepublication history and additional material for this paper are available online. to view please visit the journal (http:// dx. doi. org/ 10. 1136/ rmdopen- 2017- 000509).
received 4 June 2017 revised 30 July 2017 accepted 25 august 2017
For numbered affiliations see end of article.
Correspondence to Professor Jose a P da Silva; jdasilva@ ci. uc. pt
AbstrAct
Objective evaluate the performance of FraX®, with and
without bone mineral densitometry (BMD), in predicting the occurrence of fragility fractures over 10 years.
Methods Participants aged ≥40 years at baseline, with
a complete set of data and a minimum of 8.5 years of follow-up were identified from three cohorts (n=2626). ten-year fracture risk at baseline were estimated with FraX® and assessed by comparison with observed fractures and receiver operating characteristic analysis.
Results During a mean (SD) follow-up of 9.12 (1.5) years,
178 participants suffered a major osteoporotic (MOP) fracture and 28 sustained a hip fracture. the predictive performance of FraX® was superior to that of BMD alone for both MOP and hip fractures. the area under the curve (aUc) of FraX® without BMD was 0.76 (95% ci 0.72 to 0.79) for MOP fractures and 0.78 (95% ci 0.69 to 0.86) for hip fractures. no significant improvements were found when BMD was added to clinical variables to predict either MOP (0.78, 95% ci 0.74 to 0.82, p=0.25) or hip fractures (0.79, 95% ci 0.69 to 0.89, p=0.72). aUcs for FraX® (with and without BMD) were greater for men than for women. FraX®, with and without BMD, tended to underestimate the number of MOP fractures and to overestimate the number of hip fractures in females. in men, the number of observed fractures were within the 95% ci of the number predicted, both with and without BMD.
Conclusion FraX® without BMD provided good fracture
prediction. adding BMD to FraX® did not improve the performance of the tool in the general population.
InTROduCTIOn
Osteoporotic fractures currently represent an enormous social and economic burden world-wide,1 which will tend to increase persistently
due to the progressive ageing of the popula-tion and other societal changes,2 unless
effec-tive preveneffec-tive measures are taken.
For cost-effectiveness purposes, preventive strategies should be based on the absolute risk of osteoporotic fractures in the individual patient. FRAX®3 4 is the most widely used tool
to estimate osteoporotic fracture probabili-ties,5 and it has been incorporated in a large
number of guidelines for the prevention and management of osteoporosis.2 6–9 FRAX®
esti-mates are based on a set of easily assessable clinical risk factors, with or without consider-ation of femoral neck bone mineral density (BMD),4 making it a feasible tool, even in
technically deprived environments.
Given the differences in the incidence of major osteoporotic (MOP) fractures between countries,10 11 FRAX® should be validated in
Key messages
What is already know about this subject? ► FraX® has been validated and is used in a
large number of countries to estimate the risk of osteoporotic fractures, thus informing individual treatment, societal preventive strategies and national guidelines to initiate treatment. However, a recent systematic literature review identified a large number of important limitations and caveats in the available studies.
What does this study add?
► this study provides a methodologically robust piece of evidence supporting the predictive value of FraX® (area under the curve: 0.72 to 0.93) in a general population setting. it also demonstrates, for the first time that, at a global level, the performance of this tool is not enhanced by considering bone mineral density in addition to immediately available clinical risk factors.
How might this impact on clinical practice? ► the data presented on this study substantially adds,
in quantity and quality, to the evidence supporting the use of FraX® to estimate the risk of fracture and serve as a reference in the decision to treat. the data indicates that, overall, estimates based solely on the clinical risk factors included in the algorythmhave a similar reliability, questionning the need for systematic assessment of bone mineral density.
national cohorts to optimise its predictive value in each country.4 A recent systematic review12 demonstrated that
this has not always been done and that most validation studies have significant bias, especially recruitment bias regarding the target population, and missing data on clinical risk factors. Few of these studies worldwide have been conducted in the general population.12
The purpose of this study was to evaluate the perfor-mance of FRAX® in predicting the 10-year probability of osteoporotic fractures using data from three prospec-tive cohorts from the general population. We also investi-gated the value of adding BMD to the clinical parameters of FRAX®.
MeTHOds
For this study, data of three different Portuguese cohorts, SAOL, IPR and EPIPorto (from centre, south and north of the country, respectively), were combined. Only persons aged >40 years and with a complete set of data on FRAX® clinical risk factors were included. There were no other exclusion criteria.
More details on cohorts and selection of partici-pants can be found on online supplementary material. Online supplementary figure 1 shows the disposition of participants during follow-up and numbers used for data analysis.
BMd evaluation
Dual energy X-ray absorptiometry (DXA) scans of the spine and proximal femur of the non-dominant side were performed at the baseline visit of all participants, using a Hologic QDR 4500/c bone densitometer in all cases. A daily quality exam was performed every day to ensure the quality of the exams performed in the bone densi-tometer (as recommended by the manufacture); a well-trained technician in every cohort performed the exams. Participants without femoral BMD measurement at base-line were excluded. Hip T scores were used as provided by the bone densitometer on the basis of NHANES III (Third National Health and Nutrition Examination Survey) reference values.13
Fractures
The first new fracture during follow-up and the date on which it occurred were self-reported at the follow-up visit in all cohorts. In the SAOL cohort, fracture reports were confirmed by clinical file review in all but 2 of 52 frac-tures.
The fracture outcome of interest in this analysis was new first hip fracture and fracture of either the hip, wrist, shoulder or clinical fracture of the spine (MOP), regard-less of the degree of trauma, so as to conform to the defi-nition of hip, and MOP fracture by FRAX®.
FRAX® predictions
The 10-year fracture risk estimates for hip and MOP frac-tures (with and without adding the variable femoral neck BMD) for each individual case were assessed using the
Portuguese version of the FRAX® tool by an operator who was blinded for the fracture outcomes. All variables were defined exactly as prescribed by FRAX®.
All three cohort studies had been approved by local ethics committees, and informed consent had been obtained from all patients. The Research Ethics Board of Faculty of Medicine of Coimbra University approved the current analysis.
sTATIsTICs
Follow-up time for the fracture analyses was truncated at 10 years, when applicable, to correspond with the 10-year fracture risk estimates from FRAX®. Of participants who deceased during follow-up (n=292), fracture data were collected from family members and included in the anal-yses, according to the assumption of the tool.10 Data for
survival analyses was censored at the date of first fracture, date of death or 10 years without fractures or end of follow-up before 10 years without fractures (as described in Methods, participants from EPIPorto did not complete 10 years of follow-up).
Descriptive statistics for demographic and baseline characteristics are presented as mean (SD) or median (IQR) for continuous variables or count (percentage) for categorical variables.
Crude comparisons of parameters of participants with fractures versus those with no fractures were performed with χ2 tests and Mann-Whitney U test.
Cox proportional hazards models were constructed for MOP and for hip fracture prediction separately, to assess the contributions of the individual FRAX® vari-ables. Cox proportional hazards takes time into account, thus the shorter duration of follow-up in EPIPorto was not an issue for those who had a first new fracture during this follow-up. Receiver operating characteristic (ROC) area under the curve (AUC) analyses were conducted to explore the fracture risk stratification using FRAX® with and without BMD and the prediction of BMD alone (femoral neck T score or minimum value at any site). An AUC of 0.50 indicates a result no better than chance, an AUC >0.5–0.6 or <0.5–0.4: poor discrimina-tive value, 0.6–0.8 or 0.2–0.4: moderate discriminadiscrimina-tive value and >0.8 or <0.2: high discriminative value14; only
AUCs with CI excluding 0.5 are statistically significant. Pairwise comparison of AUCs ROC was performed using MedCalc (V.14.8.1). Sensitivity analyses were performed by excluding data from EPIPorto given their shorter follow-up. Kaplan-Meier curves were plotted, showing fracture incidence over time by cohort.
We assessed the fit of predicted values of FRAX® by comparing the observed proportion of participants who sustained a first new fracture with the proportion predicted by FRAX®. These analyses were undertaken in the entire cohort and then repeated in the cohort divided into clinically relevant subgroups for age and gender.
Statistical analyses were performed with SPSS for Windows (V.20.0). We applied STROBE (Strengthening
the reporting of oservational studies in epidemiology)
criteria for cohort studies to ensure the quality of our study.15 A p value of <0.05 was taken as statistically significant.
ResulTs
The study sample with baseline and follow-up observa-tions consisted of 2626 participants (1943 women (73%) and 683 (27%) men). Baseline characteristics are summa-rised in table 1. The mean (SD) age at baseline was 58.2 (10.2) years; during follow-up, 292 (11.1%) participants had died from different causes. The most prevalent among FRAX® clinical risk factors was ‘secondary osteo-porosis’ (24.3%), and the least prevalent was rheumatoid arthritis (4.9%).
During follow-up, with a mean (SD) duration of 9.12 (1.5) years (minimum and a total 23 949 person/years), 28 (1.1%) of these participants suffered from an incident hip fracture (median FRAX®-estimated risk at baseline for hip fracture: without BMD 2.8% (1.4–4.8); with BMD 6.9% (1.9–11.8)) and 178 (6.8%) had an incident MOP (median FRAX®-estimated risk at baseline for MOP: without BMD 6.7% (3.9–10); with BMD 8.9% (5.2–14)).
More details can be found in online supplementary table 1.
In table 2, we present the ROC AUC for FRAX® esti-mates, with and without BMD, as well as ROC AUC for DXA alone. The performance of FRAX® is superior to that for DXA alone, for both MOP and hip fractures, in both men and women. Please see also online supplemen-tary figures 2 and 3.
AUCs based on FRAX® were numerically higher when including DXA, compared with not including DXA, with the exception of hip fractures in men, but none of these differences reached statistical significance. AUCs based on FRAX® with DXA were higher to those of DXA alone, all differences being statistically significant. ROC analyses excluding participants from EPIPorto revealed exactly the same AUC values, except for a modest increase for hip prediction with BMD (AUC 0.80, 95% CI 0.71 to 0.89) (data not shown).
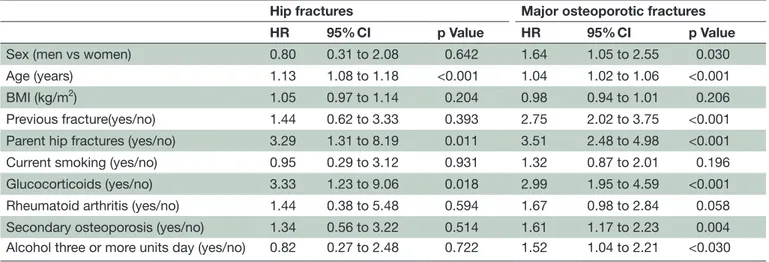
As shown in table 3, when BMD was not included in the model, all clinical risk factors except BMI and rheumatoid arthritis were independent predictors of new MOP fractures. Regarding new hip fractures, the model without BMD retains age and glucocorticoids as
Table 1 Baseline characteristics of participants and baseline FRAX® risk estimates
All Men Women
N, n (%) 2626 683 (27) 1943 (73.0) Age, mean (SD) 58.2 (10.2) 60.3 (11.4) 57.7 (9.9) 40–59, n (%) 1495 (56.9) 352 (51.5) 1143 (58.8) 60–74, n (%) 950 (36.2) 260 (38.1) 690 (35.5) ≥75, n (%) 181 (6.9) 71 (10.4) 110 (5.7) BMI, mean (SD) 27.3 (4.5) 75.5 (11.9) 66.4 (11.6) Previous fracture, n (%) 512 (19.5) 153 (22.4) 359 (18.5) Parent hip fractures, n (%) 213 (8.1) 50 (7.3) 163 (8.4) Current smoking, n (%) 612 (23.3) 344 (50.4) 268 (13.8) Oral glucocorticoids, n (%) 182 (6.9) 38 (5.6) 144 (7.4) Rheumatoid arthritis, n (%) 128 (4.9) 18 (2.6) 110 (5.7) Secondary osteoporosis, n (%) 639 (24.3) 46 (6.7) 593 (30.5) Alcohol three or more units day, n (%) 529 (20.1) 287 (42) 242 (12.5) Femoral neck T score, mean (SD)* −1.54 (1.31) −1.35 (1.40) −1.58 (1.30) ≥ −1, n (%) 595 (31.4) 138 (37.7) 457 (29.9) −2.5<T<−1, n (%) 867 (45.7) 152 (41.5) 715 (46.7) ≤−2.5, n (%) 435 (22.9) 76 (20.8) 359 (23.4) Median 10 year probability, median (IQR)
MOP fracture without BMD 2.9 (1.7–5.8) 1.6 (1.6–4.4) 3.0 (1.7–6.2) MOP fracture with BMD 3.4 (1.8–6.9) 3.1 (1.7–6) 3.5 (1.9–7) Hip fracture without BMD 0.5 (0.2–1.6) 0.5 (0.2–1.6) 0.5 (0.2–1.6) Hip fracture with BMD 0.7 (0.2–2.5) 0.95 (0.28–2.93) 0.6 (0.2–2.3)
There were no missing data for any of the clinical risk factors considered by FRAX®. *Femoral Neck BMD was available for 1897 participants.
significant predictors associated with a history of parent hip fractures.
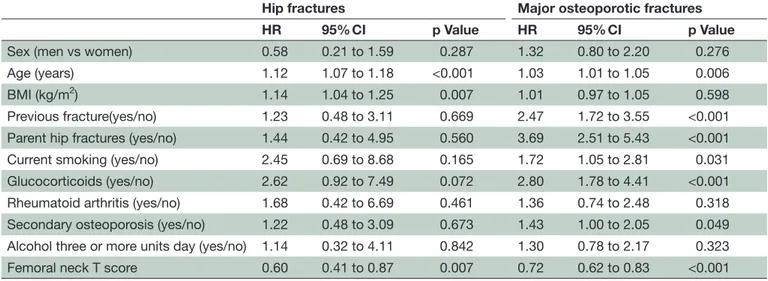
When BMD was included in the model (table 4), age, glucocorticoids, parent hip fractures, previous osteopo-rotic fracture, current smoking, secondary osteoporosis and femoral neck BMD were all independent predictors of MOP fractures in our sample. In the model with BMD, parental hip fractures showed the largest predicted risk for MOP fracture (HR 3.69, 95% CI 2.51 to 5.43) and BMD showed the smallest (HR 0.72, 95% CI 0.62 to 0.83).
The only independent predictors of hip fractures were age, BMI and femoral neck BMD. Gender, alcohol usage, secondary osteoporosis and rheumatoid arthritis were
not independently associated with either MOP or hip fractures.
Table 5 shows the calibration of each calculator by comparing the number of observed first new fractures and the at baseline estimated risk by FRAX® (95% CI). FRAX® with and without BMD underestimated incident MOP and overestimated hip fractures in women. In men, the observed rates of first new fractures were within the 95% CI of baseline FRAX® predicted rates.
Regarding age and considering both genders together, the observed number of hip fractures was within the 95% CI of prediction in all ages groups, with the excep-tion of underestimaexcep-tion of the FRAX® with BMD
Table 2 ROC area under the curve (AUC) analyses for hip and major osteoporotic fractures
Hip fractures Major osteoporotic fractures
AUC 95% CI p Value AUC 95% CI p Value
Women
BMD femoral neck alone 0.68 0.66 to 0.71 <0.009 0.66 0.63 to 0.68 <0.001 FRAX® without BMD 0.72† ns 0.69 to 0.74 <0.001 0.75†*** 0.73 to 0.77 <0.001 FRAX® with BMD 0.75†‡** ns 0.62 to 0.87 <0.001 0.76†‡*** ns 0.74 to 0.78 <0.001 Men
BMD femoral neck alone 0.82 0.78 to 0.86 <0.004 0.80 0.76 to 0.84 <0.001 FRAX® without BMD 0.93†*** 0.89 to 0.95 <0.001 0.81† ns 0.76 to 0.85 <0.001 FRAX® with BMD 0.90†‡***ns 0.86 to 0.93 <0.001 0.85†‡* ns 0.81 to 0.88 <0.001 Both
BMD femoral neck alone 0.72 0.61 to 0.83 <0.001 0.69 0.64 to 0.73 <0.001 FRAX® without BMD 0.78 0.69 to 0.86 <0.001 0.76†*** 0.72 to 0.79 <0.001 FRAX® with BMD 0.79†‡*** ns 0.69 to 0.89 <0.001 0.78†‡*** ns 0.74 to 0.82 <0.001
*p<0.05. **p<0.01. ***p<0.001.
†p Value versus same site/gender BMD alone.
‡p Value versus same site/gender FRAX® without BMD.
BMD, bone mineral density; ns, non-significant; ROC, receiver operating characteristic.
Table 3 HRs for fracture based on individual FRAX® variables excluding BMD. All variables are defined as prescribed by FRAX®
Hip fractures Major osteoporotic fractures
HR 95% CI p Value HR 95% CI p Value
Sex (men vs women) 0.80 0.31 to 2.08 0.642 1.64 1.05 to 2.55 0.030 Age (years) 1.13 1.08 to 1.18 <0.001 1.04 1.02 to 1.06 <0.001 BMI (kg/m2) 1.05 0.97 to 1.14 0.204 0.98 0.94 to 1.01 0.206
Previous fracture(yes/no) 1.44 0.62 to 3.33 0.393 2.75 2.02 to 3.75 <0.001 Parent hip fractures (yes/no) 3.29 1.31 to 8.19 0.011 3.51 2.48 to 4.98 <0.001 Current smoking (yes/no) 0.95 0.29 to 3.12 0.931 1.32 0.87 to 2.01 0.196 Glucocorticoids (yes/no) 3.33 1.23 to 9.06 0.018 2.99 1.95 to 4.59 <0.001 Rheumatoid arthritis (yes/no) 1.44 0.38 to 5.48 0.594 1.67 0.98 to 2.84 0.058 Secondary osteoporosis (yes/no) 1.34 0.56 to 3.22 0.514 1.61 1.17 to 2.23 0.004 Alcohol three or more units day (yes/no) 0.82 0.27 to 2.48 0.722 1.52 1.04 to 2.21 <0.030
estimate for the group aged <60 years. For MOP frac-tures, the baseline FRAX® estimate also underestimated the risk for those under the age of 75 years. The agree-ment between predicted and observed rats above this age was better, although the number of observed new first fractures was small.
Kaplan-Meier survival models showed that a similar number of new first fractures occurs every year in all three cohorts (data not shown). Based on this observation, we estimated that 12 MOP fractures would have occurred
in the 2.5 missing years of follow-up in EPIPorto, which are unaccounted for. The impact of this difference of follow-up was evaluated through sensitivity analysis, as described above.
dIsCussIOn
In this study in a cohort of general population, we used several approaches to compare the predictive perfor-mance of baseline FRAX® estimates with and without
Table 4 HRs for fracture based on individual FRAX® variables including femoral neck BMD
Hip fractures Major osteoporotic fractures
HR 95% CI p Value HR 95% CI p Value
Sex (men vs women) 0.58 0.21 to 1.59 0.287 1.32 0.80 to 2.20 0.276 Age (years) 1.12 1.07 to 1.18 <0.001 1.03 1.01 to 1.05 0.006 BMI (kg/m2) 1.14 1.04 to 1.25 0.007 1.01 0.97 to 1.05 0.598
Previous fracture(yes/no) 1.23 0.48 to 3.11 0.669 2.47 1.72 to 3.55 <0.001 Parent hip fractures (yes/no) 1.44 0.42 to 4.95 0.560 3.69 2.51 to 5.43 <0.001 Current smoking (yes/no) 2.45 0.69 to 8.68 0.165 1.72 1.05 to 2.81 0.031 Glucocorticoids (yes/no) 2.62 0.92 to 7.49 0.072 2.80 1.78 to 4.41 <0.001 Rheumatoid arthritis (yes/no) 1.68 0.42 to 6.69 0.461 1.36 0.74 to 2.48 0.318 Secondary osteoporosis (yes/no) 1.22 0.48 to 3.09 0.673 1.43 1.00 to 2.05 0.049 Alcohol three or more units day (yes/no) 1.14 0.32 to 4.11 0.842 1.30 0.78 to 2.17 0.323 Femoral neck T score 0.60 0.41 to 0.87 0.007 0.72 0.62 to 0.83 <0.001
BMD, bone mineral density; BMI, body mass index.
Table 5 FRAX®-estimated and observed number of first new fractures during follow-up
FRAX® without BMD (n=2626) FRAX® with BMD (n=1986)
Observed Estimated (95% CI) Observed Estimated (95% CI)
Women
MOP 145 97.5 (78.6 to 116.3) 116 91.3 (73.1 to 109.4) Hip 20 30.9 (20.1 to 41.8) 17 35.8 (24.2 to 44.4) Men
MOP 33 24.9 (15.3 to 34.6) 23 18.9 (10.6 to 27.2) Hip 8 9.9 (3.82 to 16.1) 7 10.3 (4.1 to 16.5) Women and Men
MOP 178 122.4 (101.3 to 143.6) 139 116.2 (95.7 to 136.7) Hip 28 40.9 (28.4 to 53.3) 24 48.7 (35.2 to 62.2)
Age <60 years
MOP 69 34.7 (23.3 to 46.1) 52 36.8 (25.1 to 48.5) Hip 1 5.5 (0.9 to 10.1) 1 12.4 (5.5 to 19.2)
Age 60–75 years
MOP 97 67 (51.5 to 82.5) 77 60.4 (45.9 to 75) Hip 21 24.1 (14.6 to 33.7) 18 26.3 (16.5 to 36.1)
Age >75 years
MOP 12 21 (12.7 to 29.3) 10 13.7 (7.08 to 20.3) Hip 6 11.4 (5.06 to 17.8) 5 7.8 (2.6 to 13)
BMD with observed first new fractures during follow-up. FRAX® is designed to predict the risk of fracture and does not distinguish the risk of multiple fractures in one individual. That is why our data were censored at the first fracture.
AUC ROC values of baseline FRAX® estimates ranged from 0.78 to 0.79 for hip fracture and from 0.76 to 0.78 for MOP fracture, indicating moderate discriminative ability of FRAX®, with and without BMD, for predicting both hip and MOP fractures in both genders. The AUC ROC values for BMD alone were 0.72 for hip fractures and 0.69 for MOP fracture. FRAX® estimates with and without BMD have a better performance than has BMD alone. No significant differences were found between the predictive performance of FRAX® estimates with and without BMD.
The prediction of first new hip fractures was more reli-able than that of MOP fractures, which is in agreement with previous studies.16–22 The performance of the tool was higher in males than in females, for both groups of fractures.18 23
AUC ROC values found in our study are generally higher than those found in a recent meta-analysis.12 This may be related to the higher quality of methods used in our study and the full respect for the conditions of FRAX® applicability predicted in its development process4 10; in contrast with most previous studies, we
included participants from the general population and considered all clinical risk factors included in FRAX® using the exact definitions provided by the tool; we only included cases with a complete set of clinical data, and we accounted for participants who died during follow-up. Our only limitation in this respect was the shorter dura-tion of follow-up in one of the cohorts. The prevalence of clinical risk factors was similar to other studies, with exception of secondary osteoporosis and consumption of alcohol and tobacco that were higher in our study, which may be related to the systematic questioning about these risk factors. We also found that the individual risk factors used by FRAX® had significant independent contribu-tions to fracture prediction. Age and glucocorticoid use were strongly associated with new first MOP and hip frac-ture risk in both models (with and without BMD).
FRAX®, with and without BMD, underestimated inci-dent MOP and overestimated hip fractures in women, while in men the observed number of both types of fractures was within the 95% CI of the prediction, both with and without BMD. These results are similar with those found in other studies16 20 21 24 25 and a systematic
review.26 We hypothesise that the discrepancies between
the observed and predicted rates of fractures in females may be related to the fact that for the construction of Portuguese FRAX® algorithm, we have only used actual national epidemiological data for hip fractures, the rate for the MOP fractures being estimated using Swedish age specific ratios.27 When considering age, the number
of observed first new MOP fractures was higher than
estimated until the age of 75 years. There was good agree-ment regarding hip fractures in all age groups.
Overall, our results show that the FRAX® algorithm with clinical risk factors has a better performance at predicting the rate of first new fractures than BMD alone. This is in agreement with previous studies.3 18 They also
demonstrate that adding BMD to the clinical risk factors brings no improvement to FRAX® prediction, in terms of AUC ROC or rates of observed versus predicted fractures. This is the case in both men and women, MOP and hip fractures. The impact of DXA on FRAX® performance has, to the best of our knowledge, not been investigated before. Our observations question the cost-effectiveness of DXA measurements for the purpose of predicting frac-tures in the general population.
Some limitations of this study need to be acknowledged. Our dropout rate was 25.2%, which is considerable, although similar to that reported in other prospective cohort studies of FRAX®.28–30 Patients lost to follow-up
did not differ significantly for those included in the anal-yses in terms of clinical risk factors included in FRAX® (data not shown). Fracture events were self-reported and only confirmed in the SAOL cohort by clinical file review. During follow-up, 7.6% of participants used antiosteo-porotic agents at some time, which reflects the low rate of treatment of osteoporosis in the general Portuguese population.31 Such treatment may have prevented some
fractures, potentially contributing to the overestimation of the fracture risk, even though recent studies have been unable to show this effect in open population-based studies.32 33 We investigated the performance of FRAX®
Portugal,we are unable to comment on the calibration or discrimination of other country-specific FRAX® tools. Follow-up in the EPIPorto cohort was shorter than the 10-year timeline of FRAX®. This did not have a relevant impact regarding the ROC analyses but may have artifi-cially reduced, although slightly, the underestimation of the actual number of fractures by FRAX®.
Our study has several strengths: it is a multicentre cohort of participants recruited from the general popula-tion, the average duration of follow-up was 8.7 years, the clinical risk factors included in FRAX® were collected in all participants and we also considered death hazard. These qualities support the validity of the results in the population expected to receive the test in daily practice.
The FRAX® tool has been incorporated in the clinical guidelines for osteoporosis of several countries.34 The
data presented in this paper have already influenced the recent Portuguese recommendations35; both the
require-ment of DEXA (Dual-energy X-ray absorptiometry) and the initiation of treatment are based on estimates of the actual risk of fracture by FRAX®, with or without BMD T scores
COnClusIOn
A moderate performance of FRAX® was found in both men and women, with higher AUCs ROC than those
reported in the derivation and validation cohorts studied by the WHO Collaborating Centre3 and considered in a
recent meta-analyses.12 The performance was better for
hip than for MOP fractures, in males than in females, and in participants over the age of 75 years. Adding BMD to the model did not improve FRAX® performance.
Author affiliations
1rheumatology Department, centro Hospitalar e Universitário de coimbra, clínica
Universitária de reumatologia, University of coimbra, coimbra, Portugal
2coimbra nursing School, esenfc, Health Sciences research Unit: nursing
(UiciSa:e), coimbra, Portugal
3ePiUnit – institute of Public Health and Porto Medical School, University of Porto,
Porto, Portugal
4instituto Português de reumatologia, lisboa, Portugal
5arthritis research UK centre for epidemiology, Division of Musculoskeletal
& Dermatological Sciences, School of Biological Sciences, Faculty of Biology, Medicine and Health, the University of Manchester, Manchester, UK
6Department of rheumatology and clinical immunology, University Medical center,
Utrecht, the netherlands
7niHr Manchester Biomedical research centre, central Manchester University
Hospitals nHS Foundation trust, Manchester academic Health Science centre, Manchester, UK
Contributors aM and JaPS were responsible for conceiving the project. aM and rl were responsible for data collection. aM performed the data management and statistical analysis in collaboration with rl, SMMV, JJ and JaPS. aM wrote the paper in collaboration with all coauthors. all coauthors read the report and made suggestions about its content.
Funding this study was supported by unrestricted grants from the Direção geral da Saúde and amgen, which had no role in the design of the study, the writing or review of the paper.
Competing interests none declared. Patient consent Obtained.
ethics approval the research ethics Board of Faculty of Medicine of coimbra University approved the current analysis. all participants gave informed consent before taking part.
Provenance and peer review not commissioned; externally peer reviewed. data sharing statement no additional data are available.
Open Access this is an Open access article distributed in accordance with the creative commons attribution non commercial (cc BY-nc 4.0) license, which permits others to distribute, remix, adapt, build upon this work non-commercially, and license their derivative works on different terms, provided the original work is properly cited and the use is non-commercial. See: http:// creativecommons. org/ licenses/ by- nc/ 4. 0/
© article author(s) (or their employer(s) unless otherwise stated in the text of the article) 2017. all rights reserved. no commercial use is permitted unless otherwise expressly granted.
RefeRences
1. Kanis JA, Odén A, McCloskey EV, et al. A systematic review of hip fracture incidence and probability of fracture worldwide. Osteoporos Int 2012;23:2239–56.
2. Kanis JA, McCloskey EV, Johansson H, et al. European guidance for the diagnosis and management of osteoporosis in postmenopausal women. Osteoporos Int 2013;24:23–57.
3. Kanis JA, Oden A, Johnell O, et al. The use of clinical risk factors enhances the performance of BMD in the prediction of hip and osteoporotic fractures in men and women. Osteoporos Int
2007;18:1033–46.
4. Kanis JA, Hans D, Cooper C, et al. Interpretation and use of FRAX in clinical practice. Osteoporos Int 2011;22:2395–411.
5. Kanis JA, Johansson H, Oden A, et al. Worldwide uptake of FRAX.
Arch Osteoporos 2014;9:166.
6. Briot K, Cortet B, Thomas T, et al. 2012 update of French guidelines for the pharmacological treatment of postmenopausal osteoporosis.
Joint Bone Spine 2012;79:304–13.
7. Papaioannou A, Morin S, Cheung AM, et al. 2010 clinical practice guidelines for the diagnosis and management of osteoporosis in Canada: summary. CMAJ 20102010;182:1864–73;182:1864–73. 8. Cosman F, de Beur SJ, LeBoff MS, et al. Clinician’s guide to
prevention and treatment of osteoporosis. Osteoporos Int
2014;25:2359–81.
9. Kanis JA, McCloskey EV, Johansson H, et al. Case finding for the management of osteoporosis with FRAX--assessment and intervention thresholds for the UK. Osteoporos Int
2008;19:1395–408.
10. Kanis JA, Oden A, Johansson H, et al. Pitfalls in the external validation of FRAX. Osteoporos Int 2012;23:423–31. 11. Kanis JA, McCloskey EV, Harvey NC, et al. Intervention
thresholds and the diagnosis of osteoporosis. J Bone Miner Res
2015;30:1747–53.
12. Marques A, Ferreira RJ, Santos E, et al. The accuracy of
osteoporotic fracture risk prediction tools: a systematic review and meta-analysis. Ann Rheum Dis 2015;74:1958–67.
13. Kelly TL, Wilson KE, Heymsfield SB. Dual energy X-Ray
absorptiometry body composition reference values from NHANES.
PLoS One 2009;4:e7038.
14. Cook NR. Statistical evaluation of prognostic versus diagnostic models: beyond the ROC curve. Clin Chem 2008;54:17–23. 15. von Elm E, Altman DG, Egger M, et al. The Strengthening the
Reporting of Observational Studies in Epidemiology (STROBE) statement: guidelines for reporting observational studies. Prev Med
2007;45:247–51.
16. Bolland MJ, Siu AT, Mason BH, et al. Evaluation of the FRAX and Garvan fracture risk calculators in older women. J Bone Miner Res
2011;26:420–7.
17. Cheung EY, Bow CH, Cheung CL, et al. Discriminative value of FRAX for fracture prediction in a cohort of Chinese postmenopausal women. Osteoporos Int 2012;23:871–8.
18. Ettinger B, Ensrud KE, Blackwell T, et al. Performance of FRAX in a cohort of community-dwelling, ambulatory older men: the Osteoporotic fractures in men (MrOS) study. Osteoporos Int
2013;24:1185–93.
19. Leslie WD, Lix LM, Johansson H, et al. Independent clinical validation of a Canadian FRAX tool: fracture prediction and model calibration. J Bone Miner Res 2010;25:2350–8.
20. Sornay-Rendu E, Munoz F, Delmas PD, et al. The FRAX tool in French women: how well does it describe the real incidence of fracture in the OFELY cohort? J Bone Miner Res 2010;25:2101–7. 21. Tamaki J, Iki M, Kadowaki E, et al. Fracture risk prediction using
FRAX®: a 10-year follow-up survey of the Japanese Population-Based Osteoporosis (JPOS) Cohort Study. Osteoporos Int
2011;22:3037–45.
22. Trémollieres FA, Pouillès JM, Drewniak N, et al. Fracture risk prediction using BMD and clinical risk factors in early postmenopausal women: sensitivity of the WHO FRAX tool. J Bone Miner Res 2010;25:1002–9.
23. Friis-Holmberg T, Rubin KH, Brixen K, et al. Fracture risk prediction using phalangeal bone mineral density or FRAX(®)?-A Danish cohort study on men and women. J Clin Densitom 2014;17:7–15.
24. Leslie WD, Lix LM; Manitoba Bone Density Program. Absolute fracture risk assessment using lumbar spine and femoral neck bone density measurements: derivation and validation of a hybrid system.
J Bone Miner Res 2011;26:460–7.
25. Collins GS, Mallett S, Altman DG. Predicting risk of osteoporotic and hip fracture in the United Kingdom: prospective independent and external validation of QFractureScores. BMJ 2011;342:d3651. 26. Nayak S, Edwards DL, Saleh AA, et al. Performance of risk
assessment instruments for predicting osteoporotic fracture risk: a systematic review. Osteoporos Int 2014;25:23–49.
27. Marques A, Mota A, Canhão H, et al. A FRAX model for the estimation of osteoporotic fracture probability in Portugal. Acta Reumatol Port 2013;38:104–12.
28. Fewtrell MS, Kennedy K, Singhal A, et al. How much loss to follow-up is acceptable in long-term randomised trials and prospective studies? Arch Dis Child 2008;93:458–61.
29. Kristman V, Manno M, Côté P. Loss to follow-up in cohort studies: how much is too much? Eur J Epidemiol 2004;19:751–60. 30. von Elm E, Altman DG, Egger M, et al. Strengthening the Reporting
of Observational Studies in Epidemiology (STROBE) statement: guidelines for reporting observational studies. BMJ 2007;335:806–8. 31. Marques A, Lourenço Ó, da Silva JA; Portuguese Working
Group for the Study of the Burden of Hip Fractures in Portugal. The burden of osteoporotic hip fractures in Portugal: costs, health related quality of life and mortality. Osteoporos Int
32. Leslie WD, Majumdar SR, Lix LM, et al. Can change in FRAX score be used to “treat to target”? A population‐based cohort study. J Bone Miner Res 2014;29:1074–80.
33. McCloskey EV, Harvey NC, Johansson H, et al. FRAX updates 2016.
Curr Opin Rheumatol 2016;28:433–41.
34. Kanis JA, Harvey NC, Cooper C, et al. A systematic review of intervention thresholds based on FRAX: a report prepared for
the National Osteoporosis Guideline Group and the International Osteoporosis Foundation. Arch Osteoporos 2016;11:25. 35. Marques A, Rodrigues AM, Romeu JC, et al. Multidisciplinary
Portuguese recommendations on DXA request and indication to treat in the prevention of fragility fractures. Acta Reumatol Port
prospective multicentre validation study
osteoporotic fracture risk? A 10-year
Do we need bone mineral density to estimate
Verstappen, Johannes W G Jacobs and Jose A P da Silva Andréa Marques, Raquel Lucas, Eugénia Simões, Suzanne M M
doi: 10.1136/rmdopen-2017-000509
2017 3:
RMD Open
http://rmdopen.bmj.com/content/3/2/e000509
Updated information and services can be found at:
These include:
References
http://rmdopen.bmj.com/content/3/2/e000509#ref-list-1
This article cites 35 articles, 6 of which you can access for free at:
Open Access
http://creativecommons.org/licenses/by-nc/4.0/ non-commercial. See:
provided the original work is properly cited and the use is
non-commercially, and license their derivative works on different terms, permits others to distribute, remix, adapt, build upon this work
Commons Attribution Non Commercial (CC BY-NC 4.0) license, which This is an Open Access article distributed in accordance with the Creative
service
Email alerting
box at the top right corner of the online article.
Receive free email alerts when new articles cite this article. Sign up in the
Notes
http://group.bmj.com/group/rights-licensing/permissions
To request permissions go to:
http://journals.bmj.com/cgi/reprintform
To order reprints go to:
http://group.bmj.com/subscribe/