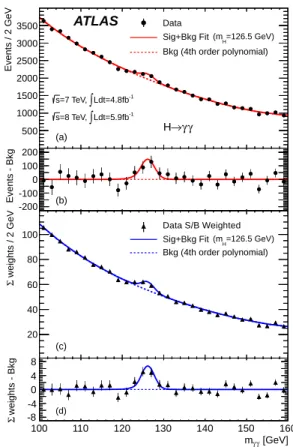
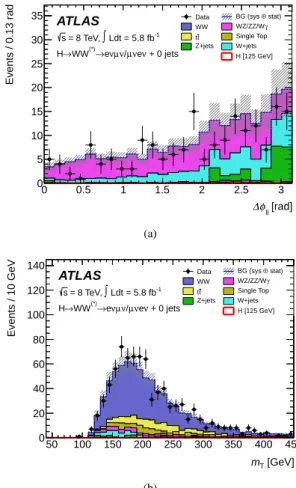
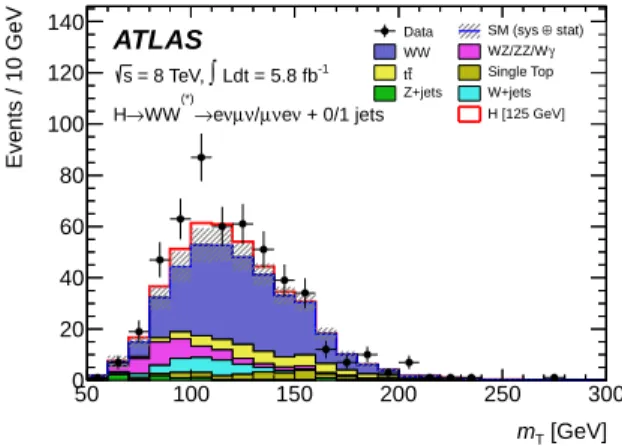
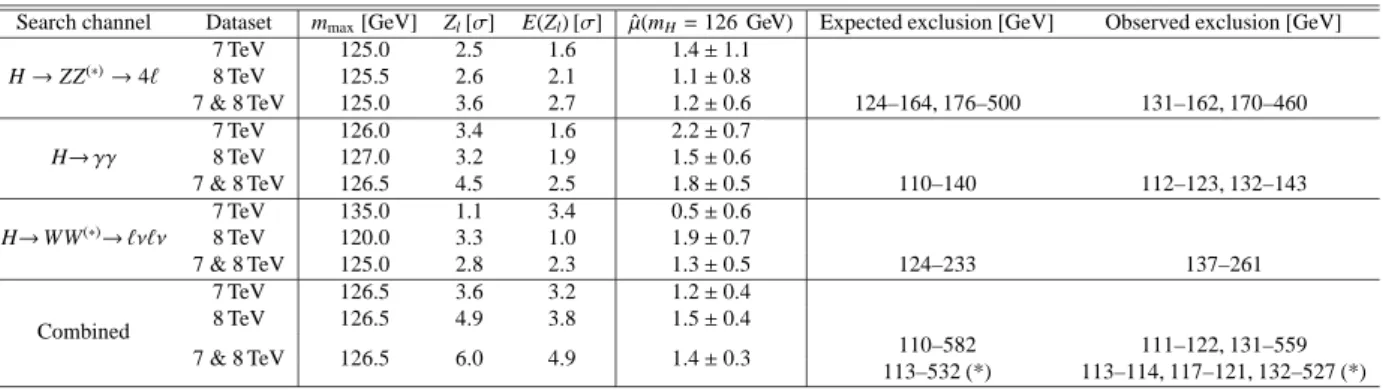
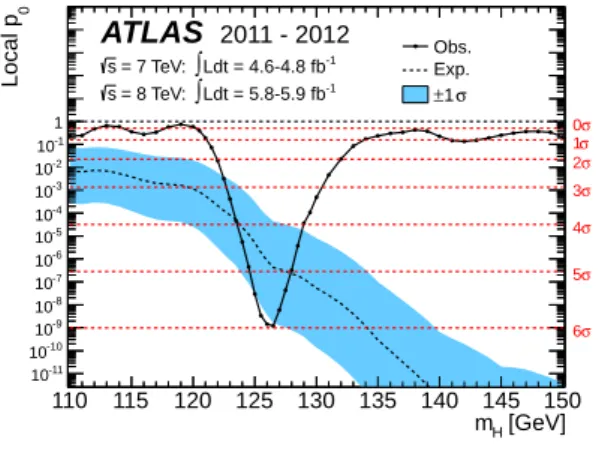
Observation of a new particle in the search for the Standard Model Higgs boson with the ATLAS detector at the LHC
Texto
Imagem

Documentos relacionados
If analyzed data for 2007, the growth of companies by number of employees paid the services sector is the one with highest number of firms with high growth both in number
Os autores concluíram que a utilização de PUI teve resultados mais favoráveis quanto à remoção de detritos das irregularidades do segmento apical do SCR, em relação a
Através da utilização dos materiais disponibilizados, a turma deve seguir as seguintes regras para jogar: formar um par com um colega do grupo; um dos alunos indica dois
A quantidade de dentifrício consumido no período do estudo também foi uma medida direta controlada por meio da entrega do tubo de dentifrício para o adolescente e outro para a
Atualmente, os tipos de agentes cimentantes dis- poníveis são: fosfato de zinco, ionômero de vidro convencional e modificado por resina, cimentos resinosos e autoadesivos.. A
Em alguns casos, estes jovens foram institucionalizados porque careciam de um meio familiar capaz de dar respostas às suas necessidades, não recebendo os cuidados
Desta forma, a escola constitui-se como um solo fecundo para a implementação de estratégias que visem o desenvolvimento da capacidade de pensar, criticamente sobre a
