EUROPEAN ORGANIZATION FOR NUCLEAR RESEARCH (CERN)
CERN-PH-EP/2013-077 2013/07/15
CMS-HIN-13-002
Multiplicity and transverse-momentum dependence of
two- and four-particle correlations in pPb and PbPb
collisions
The CMS Collaboration
∗Abstract
Measurements of two- and four-particle angular correlations for charged particles emitted in pPb collisions are presented over a wide range in pseudorapidity and full azimuth. The data, corresponding to an integrated luminosity of approximately 31 nb−1, were collected during the 2013 LHC pPb run at a nucleon-nucleon center-of-mass energy of 5.02 TeV by the CMS experiment. The results are compared to 2.76 TeV semi-peripheral PbPb collision data, collected during the 2011 PbPb run, covering a similar range of particle multiplicities. The observed correlations are characterized by the near-side (|∆φ| ≈0) associated pair yields and the azimuthal anisotropy Fourier harmonics (vn). The second-order (v2) and third-order (v3) anisotropy harmonics are
extracted using the two-particle azimuthal correlation technique. A four-particle cor-relation method is also applied to obtain the value of v2and further explore the
multi-particle nature of the correlations. Both associated pair yields and anisotropy harmon-ics are studied as a function of particle multiplicity and transverse momentum. The associated pair yields, the four-particle v2, and the v3 become apparent at about the
same multiplicity. A remarkable similarity in the v3signal as a function of multiplicity
is observed between the pPb and PbPb systems. Predictions based on the color glass condensate and hydrodynamic models are compared to the experimental results.
Published in Physics Letters B as doi:10.1016/j.physletb.2013.06.028.
c
2013 CERN for the benefit of the CMS Collaboration. CC-BY-3.0 license
∗See Appendix A for the list of collaboration members
1
1
Introduction
Studies of multi-particle correlations play a major role in characterizing the underlying mech-anism of particle production in high-energy collisions of protons and nuclei. Of particular interest in relativistic nucleus-nucleus (AA) collisions is the observed long-range (large |∆η|) structure in two-dimensional (2D)∆η-∆φ correlation functions. Here, ∆φ and ∆η are the dif-ferences in azimuthal angle φ and pseudorapidity η =−ln[tan(θ/2)]between the two particles,
where the polar angle θ is defined relative to the beam axis. One source of such long-range correlations is the “elliptic flow” induced by the hydrodynamic evolution of the lenticular col-lision zone in non-central nucleus-nucleus interactions [1]. Elliptic flow contributes a cos(2∆φ)
component to the two-particle correlation function over a broad|∆η|range [2]. The studies of elliptic flow have been carried out over a wide range of energies and collision systems [3–11]. After subtracting the elliptic flow component, a pronounced correlation structure at|∆φ| ≈ 0 (near-side) extending over large|∆η|remains in AuAu collisions at the Relativistic Heavy Ion Collider (RHIC) [12–15]. Such long-range near-side correlations are not reproduced by models of nucleon-nucleon interactions such asPYTHIA, and are not observed in pp collisions at RHIC
energies. A variety of theoretical models were proposed to interpret this residual long-range near-side correlation as a consequence of jet-medium interactions [16–21]. However, it was later realized that, because of event-by-event fluctuations in the initial-state collision geome-try [22–24], higher-order anisotropic flow components could also be induced, in particular the “triangular flow” which contributes a cos(3∆φ)component [25–30]. Therefore, the observed long-range∆η correlations in AA collisions can, in general, be attributed to the collective ex-pansion of a strongly-interacting medium. The detailed azimuthal correlation function is typ-ically characterized by its Fourier components, ∼ 1+2∑nv2
ncos(n∆φ), where vn denote the
single-particle anisotropy harmonics [31]. In particular, the second (elliptic) and third (triangu-lar) Fourier harmonics are assumed to most directly reflect the medium response to the initial collision geometry and to its fluctuations, respectively. Detailed studies of elliptic and triangu-lar flow provide insight into fundamental transport properties of the medium [26, 27, 32]. The long-range correlations and anisotropy Fourier harmonics have also been extensively studied in PbPb collisions at the Large Hadron Collider (LHC) [9–11, 33–37].
Recently, a similar long-range near-side correlation structure (without subtraction of any flow component) was observed in the highest particle multiplicity proton (pp) [38] and proton-lead (pPb) [39] collisions at the LHC. In pPb collisions, the overall strength of the near-side correlation is found to be significantly greater than in pp collisions. The away-side (|∆φ| ≈ π)
correlations contain substantial contributions from the back-to-back jets, and thus have not been the focus of these initial studies. A procedure for removing the jet correlations on the away side by subtracting the correlations for very-low-multiplicity data was recently intro-duced [40, 41], and used to study the long-range correlations in pPb on both near and away sides using the anisotropy Fourier harmonics. Evidence of such correlations was also found recently in 200 GeV deuteron-gold collisions at RHIC [42]. While hydrodynamic flow is the commonly accepted explanation of such long-range correlations in the AA collision systems, a variety of theoretical models have been proposed to explain the origin of this phenomenon in small collision systems like pp (see Ref. [43] for a recent review) and pPb. Such models include gluon saturation in the initial interaction of the protons and nuclei [44, 45] and hydrodynamic effects in the high-density systems possibly formed in these collisions at TeV energies [46, 47]. Since hydrodynamic flow is intrinsically a multi-particle phenomenon, it can be probed more directly using multi-particle correlation (or cumulant) techniques [48] rather than with two-particle correlations. In particular, two-two-particle correlations, arising from jet production, are expected to be strongly suppressed using the multi-particle method. A measurement of an
elliptic flow signal using the four-particle cumulant method in pPb collisions was recently pre-sented [49].
To provide further constraints on the theoretical understanding of the particle production mech-anisms in different collision systems, this paper presents a detailed analysis of two- and four-particle angular correlations in pPb collisions at √sNN = 5.02 TeV. This 2013 data set, espe-cially with the implementation of a dedicated high-multiplicity trigger, provides a much larger sample of very-high-multiplicity pPb events. Therefore, correlations can be explored up to a multiplicity comparable to that in mid-central PbPb collisions (e.g.,∼55% centrality, where cen-trality is defined as the fraction of the total inelastic cross section, with 0% denoting the most central collisions). The two-particle long-range correlation data are presented in two different but closely-related approaches: the near-side associated yields, which characterize the abso-lute yield of correlated particle pairs, and anisotropy harmonics (v2 and v3), which provide a
measurement of relative correlation magnitude with respect to the uncorrelated background. To further investigate the multi-particle nature of the correlations, a four-particle cumulant analysis is also performed for determining the v2 harmonic. Both the associated yields and
anisotropy harmonics are studied as a function of particle multiplicity and transverse momen-tum, providing a direct comparison of pPb and PbPb collision systems over a broad range of similar multiplicities.
2
Experimental Setup
The CMS detector comprises a number of subsystems and a detailed description can be found in Ref. [50]. The results in this paper are mainly based on the silicon tracker information. This detector, located in the 3.8 T field of the superconducting solenoid, consists of 1 440 silicon pixel and 15 148 silicon strip detector modules. The silicon tracker measures charged particles within the pseudorapidity range |η| < 2.5, and provides an impact parameter resolution of
≈15 µm and a transverse momentum (pT) resolution better than 1.5% up to pT ≈ 100 GeV/c.
The electromagnetic calorimeter (ECAL) and hadron calorimeter (HCAL) are also located in-side the solenoid. The ECAL consists of 75 848 lead-tungstate crystals, arranged in a quasi-projective geometry and distributed in a barrel region (|η| < 1.48) and two endcaps that
ex-tend to|η| =3.0. The HCAL barrel and endcaps are sampling calorimeters composed of brass
and scintillator plates, covering |η| < 3.0. Iron/quartz-fiber ˇCerenkov hadron forward (HF)
calorimeters cover the range 2.9 < |η| < 5.2 on either side of the interaction region. The
de-tailed Monte Carlo (MC) simulation of the CMS detector response is based on GEANT4 [51].
3
Selections of Events and Tracks
This analysis is performed using data recorded by CMS during the LHC pPb run in 2013. The data set corresponds to an integrated luminosity of about 31 nb−1, assuming a pPb interaction cross section of 2.1 barns. The beam energies were 4 TeV for protons and 1.58 TeV per nucleon for lead nuclei, resulting in a center-of-mass energy per nucleon pair of 5.02 TeV. The direction of the higher energy proton beam was initially set up to be clockwise, and was then reversed. As a result of the energy difference between the colliding beams, the nucleon-nucleon center-of-mass in the pPb collisions is not at rest with respect to the laboratory frame. Massless particles emitted at ηcm =0 in the nucleon-nucleon center-of-mass frame will be detected at η= −0.465
(clockwise proton beam) or 0.465 (counterclockwise proton beam) in the laboratory frame. A sample of 2.76 TeV PbPb data collected during the 2011 LHC heavy-ion run, corresponding to an integrated luminosity of 2.3 µb−1, is also analyzed for comparison purposes.
3
Minimum bias (MB) pPb events were triggered by requiring at least one track with pT >
0.4 GeV/c to be found in the pixel tracker for a pPb bunch crossing. Because of hardware limits on the data acquisition rate, only a small fraction (∼10−3) of all minimum bias triggered events were recorded (i.e., the trigger was “prescaled”). In order to select high-multiplicity pPb colli-sions, a dedicated high-multiplicity trigger was implemented using the CMS level-1 (L1) and high-level trigger (HLT) systems. At L1, the total transverse energy summed over ECAL and HCAL was required to be greater than a given threshold (20 or 40 GeV). Online track recon-struction for the HLT was based on the three layers of pixel detectors, and required a track origin within a cylindrical region of length 30 cm along the beam and radius 0.2 cm perpendic-ular to the beam. For each event, the vertex reconstructed with the highest number of pixel tracks was selected. The number of pixel tracks (Ntrkonline) with|η| < 2.4, pT > 0.4 GeV/c, and
a distance of closest approach of 0.4 cm or less to this vertex, was determined for each event. Data were taken with thresholds of Nonline
trk >100, 130 (L1 threshold of 20 GeV), and 160, 190 (L1
threshold of 40 GeV) with prescaling factors dependent on the instantaneous luminosity. The
Ntrkonline >190 trigger was never prescaled throughout the entire run.
In the offline analysis, hadronic collisions were selected by requiring a coincidence of at least one HF calorimeter tower with more than 3 GeV of total energy in each of the HF detectors. Events were also required to contain at least one reconstructed primary vertex within 15 cm of the nominal interaction point along the beam axis and within 0.15 cm transverse to the beam trajectory. At least two reconstructed tracks were required to be associated with the primary vertex. Beam related background was suppressed by rejecting events for which less than 25% of all reconstructed tracks were of good quality (i.e., the tracks selected for physics analysis as will be discussed later).
The pPb instantaneous luminosity provided by the LHC in the 2013 run resulted in approxi-mately 3% probability of at least one additional interaction occurring in the same bunch cross-ing, resulting in pileup events. A procedure for rejecting pileup events was developed to select clean, single-vertex pPb collisions. The approach was to investigate the number of tracks, Nbest trk
that is assigned to the best reconstructed vertex (e.g., the one with the greatest number of as-sociated tracks), and Ntrkadd assigned to each of the additional vertices, as well as the distance between the two vertices in the z direction (∆zvtx). Based on studies using low pileup pPb data
(from the 2012 pilot run), PbPb data, and MC simulations, events with Ntrkadd above a certain threshold at a given∆zvtxwere identified as pileup events and removed from the event
sam-ple. This threshold was set to be higher for smaller∆zvtxand larger Ntrkbestto account for the fact
that events with a smaller vertex separation and greater multiplicity have a higher probability of vertex splitting in the reconstruction algorithm. The residual pileup fraction was estimated to be no more than 0.2% for the highest multiplicity pPb interactions studied in this paper. Among those pPb interactions simulated with theEPOS[52] andHIJING[53] event generators, which have at least one primary particle with total energy E > 3 GeV in both η ranges of
−5<η< −3 and 3< η<5, the above criteria are found to select 97–98% of the events.
In this analysis, the CMS highPurity [54] tracks were used. Additionally, a reconstructed track was only considered as a primary-track candidate if the significance of the separation along the beam axis (z) between the track and the best vertex, dz/σ(dz), and the significance of the impact
parameter relative to the best vertex transverse to the beam, dT/σ(dT), were each less than 3.
The relative uncertainty of the transverse-momentum measurement, σ(pT)/pT, was required to
be less than 10%. To ensure high tracking efficiency and reduce the rate of misidentified tracks, only tracks within |η| < 2.4 and with pT > 0.3 GeV/c were used in the analysis (a different
time at HLT).
The events were divided into classes of reconstructed track multiplicity, Noffline
trk , where primary
tracks with|η| < 2.4 and pT > 0.4 GeV/c were counted, in a method similar to the approach
used in Refs. [38, 39]. Data from the HLT minimum bias trigger were used for Ntrkoffline < 120, while the track multiplicity triggers with online track thresholds of 100, 130, 160, and 190 were used for 120 ≤ Ntrkoffline < 150, 150 ≤ Ntrkoffline < 185, 185 ≤ Ntrkoffline < 220, and Ntrkoffline ≥ 220, respectively. This correspondence ensures at least 90% trigger efficiency in each multiplicity bin. The fractions of MB triggered events after event selections falling into each of the main multiplicity classes are listed in Table 1. The table also lists the average values of Ntrkoffline and
Ntrkcorrected, the event multiplicity of charged particles with|η| < 2.4 and pT > 0.4 GeV/c
cor-rected for detector acceptance and efficiency of the track reconstruction algorithm, as discussed in the following section. The average Noffline
trk values for MB pPb samples with opposite proton
beam directions are found to be consistent within 0.2%.
In order to compare directly the pPb and PbPb systems using event selections based on the multiplicity of the collisions, a subset of data from peripheral PbPb collisions collected during the 2011 LHC heavy-ion run with a minimum bias trigger were reanalyzed using the same track reconstruction algorithm as the one employed for pp and pPb collisions. The selection of events and tracks is the same as for the present pPb analysis although a different trigger is used. A description of the 2011 PbPb data can be found in Ref. [55]. The average Noffline
trk and
Ntrkcorrected values, and corresponding average PbPb collision centrality, as determined by the
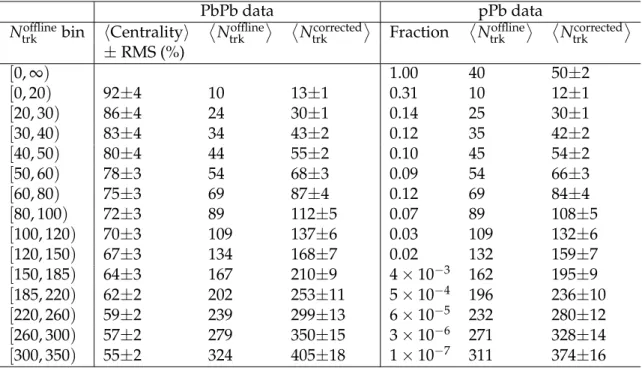
total energy deposited in the HF calorimeters [9], are listed in Table 1 for each Ntrkofflinebin. Table 1: Fraction of MB triggered events after event selections in each multiplicity bin, and the average multiplicity of reconstructed tracks per bin with|η| < 2.4 and pT > 0.4 GeV/c, before
(Ntrkoffline) and after (Ntrkcorrected) efficiency correction, for 2.76 TeV PbPb and 5.02 TeV pPb data.
PbPb data pPb data
Ntrkofflinebin hCentralityi Noffline trk
Ncorrected trk
Fraction Ntrkoffline Ntrkcorrected
±RMS (%) [0,∞) 1.00 40 50±2 [0, 20) 92±4 10 13±1 0.31 10 12±1 [20, 30) 86±4 24 30±1 0.14 25 30±1 [30, 40) 83±4 34 43±2 0.12 35 42±2 [40, 50) 80±4 44 55±2 0.10 45 54±2 [50, 60) 78±3 54 68±3 0.09 54 66±3 [60, 80) 75±3 69 87±4 0.12 69 84±4 [80, 100) 72±3 89 112±5 0.07 89 108±5 [100, 120) 70±3 109 137±6 0.03 109 132±6 [120, 150) 67±3 134 168±7 0.02 132 159±7 [150, 185) 64±3 167 210±9 4×10⁻³ 162 195±9 [185, 220) 62±2 202 253±11 5×10⁻⁴ 196 236±10 [220, 260) 59±2 239 299±13 6×10⁻⁵ 232 280±12 [260, 300) 57±2 279 350±15 3×10⁻⁶ 271 328±14 [300, 350) 55±2 324 405±18 1×10⁻⁷ 311 374±16
5
4
Analysis Technique
4.1 Two-Particle Correlation Function
The two-particle correlation functions are constructed following the procedure established in Refs. [33, 34, 39]. For each track multiplicity class, “trigger” particles are defined as primary charged tracks within a given ptrigT range. The number of trigger particles in the event is de-noted by Ntrig. Particle pairs are formed by associating each trigger particle with the remaining
charged primary particles from a specified passocT interval (which can be either the same or dif-ferent from the ptrigT range). The per-trigger-particle associated yield is defined as
1 Ntrig d2Npair d∆η d∆φ = B(0, 0) × S(∆η, ∆φ) B(∆η, ∆φ), (1)
where ∆η and ∆φ are the differences in η and φ of the pair. The signal pair distribution, S(∆η, ∆φ), represents the yield of particle pairs normalized by Ntrigfrom the same event,
S(∆η, ∆φ) = 1
Ntrig
d2Nsame
d∆η d∆φ . (2)
The mixed-event pair distribution,
B(∆η, ∆φ) = 1
Ntrig
d2Nmix
d∆η d∆φ , (3)
is constructed by pairing the trigger particles in each event with the associated particles from 10 different random events in the same 2 cm wide zvtx range and from the same track
mul-tiplicity class. Here, Nmix denotes the number of pairs taken from the mixed events. The ratio B(0, 0)/B(∆η, ∆φ)accounts for the random combinatorial background as well as for pair-acceptance effects, with B(0, 0)representing the mixed-event associated yield for both particles of the pair going in approximately the same direction and thus having full pair acceptance (with a bin width of 0.3 in∆η and π/16 in ∆φ). The signal and background distributions are first calculated for each event, and then averaged over all the events within the track multi-plicity class. The range of 0 < |∆η| < 4.8 and 0 < |∆φ| < π is used to fill one quadrant
of the (∆η, ∆φ) histograms, with the other three quadrants filled (for illustration purposes) by reflection to cover a (∆η, ∆φ) range of−4.8 < ∆η < 4.8 and−π/2 < ∆φ < 3π/2 for the 2D
correlation functions, as will be shown later in Fig. 2.
4.2 Azimuthal Anisotropy Harmonics from Two- and Four-Particle Correlations
The azimuthal anisotropy harmonics are determined from a Fourier decomposition of long-range two-particle∆φ correlation functions,
1 Ntrig dNpair d∆φ = Nassoc 2π " 1+
∑
n 2Vn∆cos(n∆φ) # , (4)as described in Refs. [33, 34], where Vn∆ are the Fourier coefficients and Nassoc represents the
total number of pairs per trigger particle for a given (ptrigT , passocT )bin. The first three Fourier terms are included in the fits to the dihadron correlation functions. Including additional terms has a negligible effect on the results of the Fourier fit. A minimum|∆η|of 2 units is applied to remove short-range correlations from jet fragmentation. The elliptic and triangular anisotropy
harmonics, v2{2,|∆η| >2}and v3{2,|∆η| > 2}, from the two-particle correlation method can
be extracted as a function of pTfrom the fitted Fourier coefficients,
vn{2,|∆η| >2}(pT) =
Vn∆(pT, prefT )
q
Vn∆(prefT , prefT )
, n=2, 3. (5)
Here, a fixed prefT range for the “reference particles” is chosen to be 0.3< pT <3.0 GeV/c.
The second-order elliptic harmonic, v2{4}, is also determined from a four-particle cumulant
analysis using the Q-cumulant method described in Ref. [48]. A reference flow v2{4}is first
determined by correlating four particles within the tracker acceptance |η| < 2.4 and in a prefT
range, 0.3< prefT <3.0 GeV/c,
vref2 {4} =q4 −
c2{4}, (6)
where the reference four-particle cumulant, c2{4}, is calculated as,
c2{4} = DD e−2i(φ1+φ2−φ3−φ4) EE −2×DDe−2i(φ1−φ2) EE2 . (7)
Here, φ1, φ2, φ3, φ4 are the azimuthal angles of four different particles in an event, andhh·ii
represents the average over all particles from all events within a given multiplicity range. With respect to the reference flow, the differential v2{4}(pT)as a function of pTis then derived
via v2{4}(pT) = −d2{4}(pT) (vref 2 {4})3 , (8)
where the differential four-particle cumulant, d2{4}(pT), is calculated by replacing one of the
four reference particles in Eq. (7) by a particle from a particular pTregion. An∆η requirement
is not applied in the four-particle cumulant analysis since short-range two-particle correlations are inherently minimized by applying this multi-particle method.
4.3 Corrections and Systematic Uncertainties
In performing the correlation analyses, each reconstructed track is weighted by a correction factor, described in Refs. [33, 34]. This factor accounts for the reconstruction efficiency, the de-tector acceptance, and the fraction of misreconstructed tracks. Detailed studies of tracking per-formance based on MC simulations and collision data can be found in Ref. [56]. The combined geometrical acceptance and efficiency for track reconstruction exceeds 60% for pT ≈0.3 GeV/c
and|η| < 2.4. The efficiency is greater than 90% in the|η| <1 region for pT >0.6 GeV/c. For
the entire multiplicity range (up to Noffline
trk ∼350) studied in this paper, no dependence of the
tracking efficiency on multiplicity is found and the rate of misreconstructed tracks remains at the 1–2% level.
Based on the studies in Ref. [56], the total uncertainty of the absolute tracking efficiency is estimated to be 3.9%. This translates directly into a 3.9% systematic uncertainty of the extracted associated yields, while the vnvalues are insensitive to it. Systematic uncertainties due to track
quality requirements are examined by varying the track selections for dz/σ(dz)and dxy/σ(dxy)
from 2 to 5. The results of both associated yields and vn are found to be insensitive to these
track selections within 2%. A comparison of high-multiplicity pPb data for a given multiplicity range but collected by two different HLT triggers with different trigger efficiencies shows an agreement within 1%. Possible contamination of residual pileup events is also investigated. By varying the zvtxrange in performing the analysis, the pileup probability is expected to vary by
7 offline trk
N
50 100 150 200{4}
2c
-0.03 -0.02 -0.01 0.00 0.01 0.02 0.03 -3 10 × bin width of 2 offline trk N bin width of 5 offline trk N bin width of 30 offline trk N = 5.02 TeV NN s (a) Data, pPb gen-level chN
50 100 150 200{4}
2c
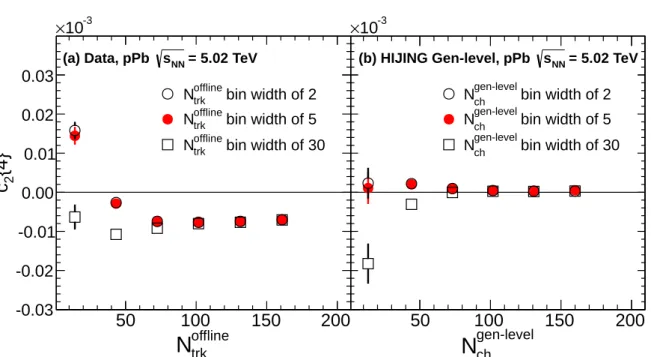
-0.03 -0.02 -0.01 0.00 0.01 0.02 0.03 -3 10 × bin width of 2 gen-level ch N bin width of 5 gen-level ch N bin width of 30 gen-level ch N = 5.02 TeV NN s (b) HIJING Gen-level, pPbFigure 1: The c2{4}values as a function of multiplicity calculated for bin width of 30 (open
squares), and first derived using a smaller bin width of 2 (open circles) or 5 (solid circles) and then averaging over the same wider bin of 30, for pPb HIJINGMC simulations (left) and data
(right) at√sNN= 5.02 TeV.
a factor of 3–4. The systematic uncertainties for associated yields and vnfrom possible residual
pileup effects are estimated to be 1–2% for Ntrkoffline <200, increasing to 6% for Ntrkoffline≥260. The event-by-event variation of track multiplicity within a given multiplicity bin width is found to have an effect on the four-particle cumulant analysis, especially for the low-multiplicity region. The c2{4}values calculated directly for a multiplicity bin width of 30 show a large
dis-crepancy from those derived first using a smaller bin width (e.g., 2 or 5) and then averaged over the same wider bin, as illustrated for pPb data in Fig. 1a and for pPb MCHIJING simu-lation (generator-level only) in Fig. 1b. The event multiplicity inHIJING, Nchgen-level, is counted for charged primary particles at the generator level with |η| < 2.4 and pT > 0.4 GeV/c. With
smaller multiplicity bin widths, the c2{4} values for HIJING are largely consistent with zero.
This is expected due to the absence of collective effect in theHIJINGevent generator. An Ntrkoffline bin width of 5 is chosen for the v2{4}analysis in this paper. Studies performed with
differ-ent Ntrkoffline bin widths, allowing different multiplicity content in the bins, suggest a system-atic uncertainty of only 1% for Ntrkoffline > 100 but up to 10% for the low multiplicity region Ntrkoffline <60.
The different systematic sources described above are added in quadrature to obtain the overall systematic uncertainty, shown as boxes in Figs. 5–11.
5
Results
5.1 Correlation Functions
Figure 2 shows the 2D two-particle correlation functions measured in 2.76 TeV PbPb (a) and 5.02 TeV pPb (b) collisions, for pairs of charged particles with 1 < ptrigT < 3 GeV/c and 1 <
passocT < 3 GeV/c, and with the track multiplicity in the range 220 ≤ Ntrkoffline < 260. For PbPb collisions, this Ntrkoffline range corresponds to an average centrality of approximately 60%, as shown in Table 1. For both high-multiplicity systems, in addition to the correlation peak near
(∆η, ∆φ) = (0, 0)due to jet fragmentation (truncated for better illustration of the full correlation structure), a pronounced long-range structure is seen at∆φ ≈ 0 extending at least 4.8 units in
|∆η|. This structure was previously observed in high-multiplicity (Noffline
trk ∼110) pp collisions
at√s = 7 TeV [38] and pPb collisions at√sNN= 5.02 TeV [39–41]. The structure is also prominent in AA collisions over a wide range of energies [2, 12–15, 33, 34, 36, 37]. On the away side (∆φ ≈ π) of the correlation functions, a long-range structure is also seen and found to exhibit
a magnitude similar to that on the near side for this pT range. In non-central AA collisions,
this cos(2∆φ)-like azimuthal correlation structure is believed to arise primarily from elliptic flow [31]. However, the away-side correlations must also contain contributions from back-to-back jets, which need to be accounted for before extracting any other source of correlations.
η ∆ -4 -2 0 2 4 (radians) φ ∆ 0 2 4 φ∆ d η∆ d pair N 2 d trig N 1 2.4 2.6 2.8 < 260 offline trk N ≤ = 2.76 TeV, 220 NN s (a) CMS PbPb < 3 GeV/c trig T 1 < p < 3 GeV/c assoc T 1 < p η ∆ -4 -2 0 2 4 (radians) φ ∆ 0 2 4 φ∆ d η∆ d pair N 2 d trig N 1 3.1 3.2 3.3 3.4 < 260 offline trk N ≤ = 5.02 TeV, 220 NN s (b) CMS pPb < 3 GeV/c trig T 1 < p < 3 GeV/c assoc T 1 < p
Figure 2: The 2D two-particle correlation functions for (a) 2.76 TeV PbPb and (b) 5.02 TeV pPb collisions for pairs of charged particles with 1 < ptrigT < 3 GeV/c and 1 < passocT < 3 GeV/c within the 220≤ Noffline
trk <260 multiplicity bin. The sharp near-side peak from jet correlations
is truncated to emphasize the structure outside that region.
To investigate the observed correlations in finer detail and to obtain a quantitative comparison of the structure in the pp, pPb, and PbPb systems, one-dimensional (1D) distributions in ∆φ are found by averaging the signal and background 2D distributions over|∆η| <1 (defined as the “short-range region”) and |∆η| > 2 (defined as the “long-range region”) respectively, as done in Refs. [33, 34, 38, 39]. The correlated portion of the associated yield is estimated using an implementation of the zero-yield-at-minimum (ZYAM) procedure [57]. In this procedure, the 1D∆φ correlation function is first fitted by a second-order polynomial in the region 0.1 < |∆φ| < 2. The minimum value of the polynomial, CZYAM, is then subtracted from the 1D∆φ
correlation function as a constant background (containing no information about correlations) such that its minimum is shifted to have zero associated yield. The statistical uncertainty in the minimum level obtained by the ZYAM procedure, combined with the deviations arising from the choice of fit range in |∆φ|, gives an absolute uncertainty of ±0.003 in the associated event-normalized yield that is independent of multiplicity and pT.
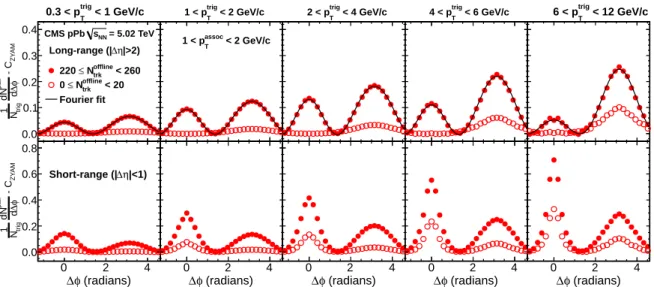
Figures 3 and 4 show the 1D ∆φ correlation functions, after applying the ZYAM procedure, for PbPb and pPb data, respectively, in the multiplicity range Ntrkoffline < 20 (open) and 220 ≤
Ntrkoffline <260 (filled). Various selections of ptrigT are shown for a fixed passocT range of 1–2 GeV/c in both the long-range (top) and short-range (bottom) regions, with pT increasing from left to
5.1 Correlation Functions 9 (radians) φ ∆ 0 2 4 Z Y A M - C φ∆ d pair dN trig N 1 0.0 0.1 0.2 0.3 0.4 = 2.76 TeV NN s CMS PbPb |>2) η ∆ Long-range (| < 1 GeV/c trig T 0.3 < p < 260 offline trk N ≤ 220 < 20 offline trk N ≤ 0 Fourier fit (radians) φ ∆ 0 2 4 Z Y A M - C φ∆ d pair dN trig N 1 0.0 0.2 0.4 0.6 0.8 |<1) η ∆ Short-range (| (radians) φ ∆ 0 2 4 Z Y A M - C φ∆ d pair dN trig N 1 0.0 0.1 0.2 0.3 0.4 < 2 GeV/c assoc T 1 < p < 2 GeV/c trig T 1 < p (radians) φ ∆ 0 2 4 Z Y A M - C φ∆ d pair dN trig N 1 0.0 0.2 0.4 0.6 0.8 (radians) φ ∆ 0 2 4 Z Y A M - C φ∆ d pair dN trig N 1 0.0 0.1 0.2 0.3 0.4 < 4 GeV/c trig T 2 < p (radians) φ ∆ 0 2 4 Z Y A M - C φ∆ d pair dN trig N 1 0.0 0.2 0.4 0.6 0.8 (radians) φ ∆ 0 2 4 Z Y A M - C φ∆ d pair dN trig N 1 0.0 0.1 0.2 0.3 0.4 < 6 GeV/c trig T 4 < p (radians) φ ∆ 0 2 4 Z Y A M - C φ∆ d pair dN trig N 1 0.0 0.2 0.4 0.6 0.8 (radians) φ ∆ 0 2 4 Z Y A M - C φ∆ d pair dN trig N 1 0.0 0.1 0.2 0.3 0.4 < 12 GeV/c trig T 6 < p (radians) φ ∆ 0 2 4 Z Y A M - C φ∆ d pair dN trig N 1 0.0 0.2 0.4 0.6 0.8
Figure 3: The 1D two-particle correlation functions for 2.76 TeV PbPb collisions within the multiplicity range 220 ≤ Noffline
trk < 260 (filled squares) and Ntrkoffline < 20 (open squares),
for pairs of charged particles with fixed passocT 1–2 GeV/c in five ptrigT ranges, in the long-range region (|∆η| > 2, top) and in the short-range region (|∆η| < 1, bottom). The curves on the top panels correspond to the Fourier fits from Eq. (4) including the first three terms.
(radians) φ ∆ 0 2 4 Z Y A M - C φ∆ d pair dN trig N 1 0.0 0.1 0.2 0.3 0.4 = 5.02 TeV NN s CMS pPb |>2) η ∆ Long-range (| < 1 GeV/c trig T 0.3 < p < 260 offline trk N ≤ 220 < 20 offline trk N ≤ 0 Fourier fit (radians) φ ∆ 0 2 4 Z Y A M - C φ∆ d pair dN trig N 1 0.0 0.2 0.4 0.6 0.8 |<1) η ∆ Short-range (| (radians) φ ∆ 0 2 4 Z Y A M - C φ∆ d pair dN trig N 1 0.0 0.1 0.2 0.3 0.4 < 2 GeV/c assoc T 1 < p < 2 GeV/c trig T 1 < p (radians) φ ∆ 0 2 4 Z Y A M - C φ∆ d pair dN trig N 1 0.0 0.2 0.4 0.6 0.8 (radians) φ ∆ 0 2 4 Z Y A M - C φ∆ d pair dN trig N 1 0.0 0.1 0.2 0.3 0.4 < 4 GeV/c trig T 2 < p (radians) φ ∆ 0 2 4 Z Y A M - C φ∆ d pair dN trig N 1 0.0 0.2 0.4 0.6 0.8 (radians) φ ∆ 0 2 4 Z Y A M - C φ∆ d pair dN trig N 1 0.0 0.1 0.2 0.3 0.4 < 6 GeV/c trig T 4 < p (radians) φ ∆ 0 2 4 Z Y A M - C φ∆ d pair dN trig N 1 0.0 0.2 0.4 0.6 0.8 (radians) φ ∆ 0 2 4 Z Y A M - C φ∆ d pair dN trig N 1 0.0 0.1 0.2 0.3 0.4 < 12 GeV/c trig T 6 < p (radians) φ ∆ 0 2 4 Z Y A M - C φ∆ d pair dN trig N 1 0.0 0.2 0.4 0.6 0.8
Figure 4: The 1D two-particle correlation functions for 5.02 TeV pPb collisions under the same conditions as in Fig. 3.
right. The curves show the Fourier fits from Eq. (4), which will be discussed in detail later. The pPb and PbPb yields show a similar correlation structure and a similar evolution of this structure with ptrigT over a wide range of ptrigT . As illustrated in Fig. 2, while the near-side long-range signal varies only by a small amount over almost 5 units in ∆η, the short-range region shows a strong ∆η dependence. Therefore, the ∆φ correlation functions in the short-range region of Figs. 3 and 4 reflect the contributions of both jet fragmentation and long-short-range correlations. For Ntrkoffline <20, no near-side correlations are observed in the long-range region of either pPb or PbPb data.
5.2 Integrated Associated Yields
The strength of the near-side correlations for short- and long-range regions can be further quan-tified by integrating the event-normalized associated yield from Figs. 3 and 4 over|∆φ| < 1.2. The resulting integrated yields are shown for pPb and PbPb in Fig. 5 as a function of ptrigT for 1 < passocT < 2 GeV/c and 220 ≤ Ntrkoffline < 260, and in Fig. 6 as a function of Ntrkofflinefor 1 < ptrigT < 2 GeV/c and 1 < passoc
T < 2 GeV/c together with the pp results from Ref. [38]. The
“jet yield” is extracted by subtracting the event-normalized integrated yield in the long-range region from that in the short-range region. The error bars correspond to statistical uncertainties, while the shaded boxes indicate the systematic uncertainties discussed in Section 4.3.
(GeV/c)
T trigp
0
5
10
A
s
s
o
c
ia
te
d
Y
ie
ld
/
(
G
e
V
/c
)
0 0.2 0.4 0.6CMS
|>2
η
∆
(a) |
220 ≤ Nofflinetrk < 260 < 2 GeV/c assoc T 1 < p = 2.76 TeV NN s PbPb = 5.02 TeV NN s pPb(GeV/c)
T trigp
0
5
10
A
s
s
o
c
ia
te
d
Y
ie
ld
/
(
G
e
V
/c
)
0 0.2 0.4 0.6|>2
η
∆
|<1 minus |
η
∆
(b) |
Figure 5: Associated event-normalized yield for the near-side correlation function integrated over the region|∆φ| < 1.2, averaged over the (a) long-range (|∆η| > 2) region and (b) short-range (|∆η| < 1) region, from which the event-normalized yield of the long-range region is subtracted. The results are shown as a function of ptrigT at 1 < passocT <2 GeV/c for events with
220 ≤ Ntrkoffline < 260 for 5.02 TeV pPb collisions (filled circles) and 2.76 TeV PbPb collisions
(filled squares). The error bars correspond to statistical uncertainties, while the shaded areas denote the systematic uncertainties.
The jet yield (Fig. 5b) increases with ptrigT in both pPb and PbPb as would be expected if higher-energy jets, which fragment into more final-state particles, are selected by requiring higher-ptrigT particles. In striking contrast to the jet yields, the ptrigT dependence of the long-range yields (Fig. 5a) show an initial rise, reaching a maximum at pT ≈2–3 GeV/c, followed by a falloff with
5.2 Integrated Associated Yields 11 offline trk
N
0
100
200
300
A
s
s
o
c
ia
te
d
Y
ie
ld
/
(
G
e
V
/c
)
0 0.2 0.4 0.6CMS
|>2
η
∆
(a) |
pPb CGC = 2.76 TeV NN s PbPb = 5.02 TeV, 2013 NN s pPb = 5.02 TeV, 2012 NN s pPb = 7 TeV s pp 2 (proton)=0.336 GeV 2 0 Q 2 (proton)=1.008 GeV 2 0 Q 2 (proton)=1.680 GeV 2 0 Q offline trkN
0
100
200
300
A
s
s
o
c
ia
te
d
Y
ie
ld
/
(
G
e
V
/c
)
0 0.2 0.4 0.6|>2
η
∆
|<1 minus |
η
∆
(b) |
< 2 GeV/c trig T 1 < p < 2 GeV/c assoc T 1 < pFigure 6: Associated event-normalized yields for the near-side correlation function as a func-tion of multiplicity Noffline
trk for 1 < p trig
T < 2 GeV/c and 1 < passocT < 2 GeV/c under the same
conditions as in Fig. 5. The results for 7 TeV pp collisions (open circles) [38] and 5.02 TeV pPb collisions from 2012 run (open squares) [34], as well as calculations from the Color Glass Con-densate (CGC) theory (curves) [58], are also shown.
The jet yield (shown in Fig. 6b) as a function of multiplicity increases by a factor of two as
Ntrkofflineincreases from 0 to 60. It then rises moderately by 20–30%, for 60≤ Ntrkoffline < 350, the
limit of this measurement. This demonstrates that by selecting high-track-multiplicity PbPb and pPb events, there is no significant bias to stronger jet-like correlations (at least for the pT
range of 1–2 GeV/c). It was previously observed in Ref. [39] that the long-range yield as a function of multiplicity only becomes significant at Ntrkoffline ∼ 40–50, followed by a monotonic rise with Ntrkoffline in pp and pPb collisions. In this paper, the measurement of the long-range yield (Fig. 6a) in pPb collisions is extended to a significantly wider multiplicity range. A direct comparison to the pp [38] and PbPb collision systems is also provided. The PbPb long-range yield is found to become significant for Ntrkoffline & 40–50, similar to the pp and pPb results. For both pPb and PbPb data, the long-range yields continue increasing with multiplicity up to
Ntrkoffline ∼ 350. The long-range yield in PbPb is about a factor of two larger than in pPb, and a
factor of eight larger than in pp at a given multiplicity and ptrigT value. In contrast to the weak multiplicity dependence of jet-like correlations shown in Fig. 6b at higher values of Ntrkoffline, a monotonic increase of the magnitude of the long-range yield with the overall event multiplicity is observed in all three collision systems.
In the framework of the color-glass condensate model, the long-range correlation structure in pPb collisions has been attributed to initial-state gluon correlations, where the contribution of collimated gluon emissions is significantly enhanced in the gluon saturation regime [44, 45, 58]. This model qualitatively describes the increase in the long-range yield for higher-multiplicity events as shown in Fig. 6a, where three different initial proton saturation scales are assumed for the pPb system. Since the calculations depend on saturation scales for both protons and lead nuclei, the data provide valuable constraints on the multiplicity dependence of these pa-rameters in the model.
5.3 Fourier Harmonics vn
Long-range correlations in pPb collisions have also been predicted in hydrodynamic mod-els [46] where a collective hydrodynamic expansion of the system with fluctuating initial condi-tions is assumed. To compare with hydrodynamic prediccondi-tions of the long-range correlacondi-tions in pPb collisions, the elliptic (v2) and triangular (v3) flow harmonics are extracted from a Fourier
decomposition of 1D ∆φ correlation functions, v2{2,|∆η| > 2}and v3{2,|∆η| > 2}, for the
long-range region (|∆η| > 2) as shown in Figs. 7 and 8, respectively. To further reduce the residual nonflow correlations on the away side, a four-particle cumulant analysis is also used to extract the elliptic flow, v2{4}, as shown in Fig. 7. As mentioned in Section 1, the multi-particle
correlation technique has the advantage of suppressing short-range jet-like correlations com-pared to two-particle correlations. It thus provides a cleaner measurement of the long-range correlations of collective nature involving many particles from the system.
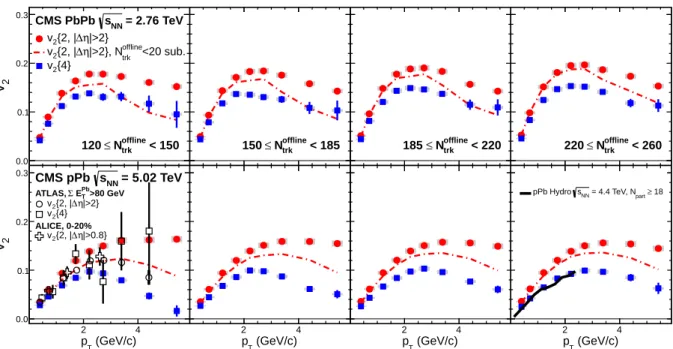
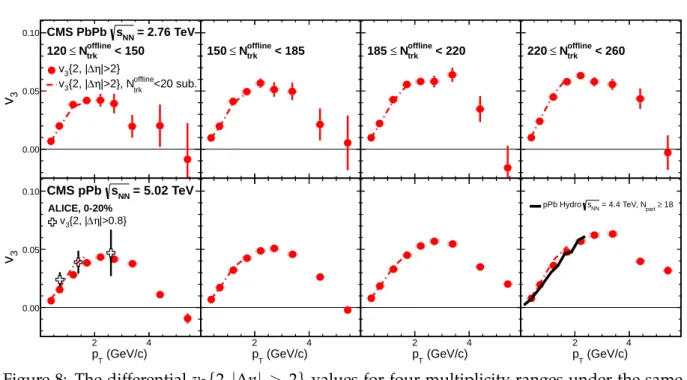
(GeV/c) T p 2 4 2 v 0.0 0.1 0.2 0.3 = 2.76 TeV NN s CMS PbPb < 150 trk offline N ≤ 120 |>2} η ∆ {2, | 2 v <20 sub. offline trk , N |>2} η ∆ {2, | 2 v {4} 2 v (GeV/c) T p 2 4 2 v 0.0 0.1 0.2 0.3 = 5.02 TeV NN s CMS pPb >80 GeV Pb T E Σ ATLAS, |>2} η ∆ {2, | 2 v {4} 2 v |>0.8} η ∆ {2, | 2 v ALICE, 0-20% (GeV/c) T p 2 4 2 v 0.0 0.1 0.2 0.3 < 185 trk offline N ≤ 150 (GeV/c) T p 2 4 2 v 0.0 0.1 0.2 0.3 (GeV/c) T p 2 4 2 v 0.0 0.1 0.2 0.3 < 220 trk offline N ≤ 185 (GeV/c) T p 2 4 2 v 0.0 0.1 0.2 0.3 (GeV/c) T p 2 4 2 v 0.0 0.1 0.2 0.3 < 260 trk offline N ≤ 220 (GeV/c) T p 2 4 2 v 0.0 0.1 0.2 0.3 18 ≥ part = 4.4 TeV, N NN s pPb Hydro
Figure 7: The differential v2{2,|∆η| > 2}(filled circles) and v2{4}(filled squares) values for
four multiplicity ranges obtained with |η| < 2.4 and a prefT range of 0.3–3 GeV/c. The results
are for 2.76 TeV PbPb collisions (top) and for 5.02 TeV pPb collisions (bottom). The error bars correspond to statistical uncertainties, while the shaded areas denote the systematic uncertain-ties. Results after subtracting the low-multiplicity data (Ntrkoffline < 20) as well as predictions from a hydrodynamic model are also shown (curves). The open markers show the results from ALICE [40] and ATLAS [49] using 2012 pPb data.
As seen in Fig. 7, the magnitude of the v2signal is found to be larger in PbPb than in pPb by
about 30% for pT < 2 GeV/c (the near-side long-range yield is related to v22 as suggested in
Eq. (4), and thus differs by a larger factor between the two systems as shown in Fig. 6). The difference between the v2{2,|∆η| >2}and v2{4}results could be, a consequence of
event-by-event fluctuations in the flow signal or nonflow correlations, as believed to be the case in PbPb collisions [59]. The v3{2,|∆η| > 2}component, shown in Fig. 8, reaches the same maximum
value for the two systems but has a much smaller magnitude than v2{2,|∆η| > 2} over the
entire pT range investigated here. The pT dependencies of both the v2 and v3 coefficients are
similar, with peak values at 2–3 GeV/c range for PbPb and slightly higher for pPb. The elliptic-and triangular-flow components predicted by the hydrodynamic calculation of Ref. [46] for pPb collisions at√sNN= 4.4 TeV and for pT <2.5 GeV/c are also shown, and compared to the
high-5.3 Fourier Harmonicsvn 13 (GeV/c) T p 2 4 3 v 0.00 0.05 0.10 CMS PbPb sNN = 2.76 TeV < 150 trk offline N ≤ 120 |>2} η ∆ {2, | 3 v <20 sub. offline trk , N |>2} η ∆ {2, | 3 v (GeV/c) T p 2 4 3 v 0.00 0.05 0.10 = 5.02 TeV NN s CMS pPb |>0.8} η ∆ {2, | 3 v ALICE, 0-20% (GeV/c) T p 2 4 3 v 0.00 0.05 0.10 < 185 trk offline N ≤ 150 (GeV/c) T p 2 4 3 v 0.00 0.05 0.10 (GeV/c) T p 2 4 3 v 0.00 0.05 0.10 < 220 trk offline N ≤ 185 (GeV/c) T p 2 4 3 v 0.00 0.05 0.10 (GeV/c) T p 2 4 3 v 0.00 0.05 0.10 < 260 trk offline N ≤ 220 (GeV/c) T p 2 4 3 v 0.00 0.05 0.10 18 ≥ part = 4.4 TeV, N NN s pPb Hydro
Figure 8: The differential v3{2,|∆η| > 2}values for four multiplicity ranges under the same
conditions as in Fig. 7.
multiplicity pPb data in Figs. 7 and 8. The calculations have little collision energy dependence, and assume the number of participating nucleons to be larger or equal to 18, approximately corresponding to the top 4% central pPb events. However, contributions from event-by-event fluctuations of the flow signal around its average value are not accounted for in the calculations. Therefore, the v2calculated in Ref. [46] is expected to lie between the values from the two- and
four-particle correlation methods [59]. Detailed studies of v2using various techniques in PbPb
collisions at√sNN = 2.76 TeV by CMS can be found in Ref. [9].
As mentioned above, the residual jet-like correlations on the away side of the two-particle cor-relation function could contribute to the extracted vn{2,|∆η| > 2}signal, and thus induce a
systematic uncertainty in the quantitative comparison to hydrodynamic calculations. Assum-ing that the jet-induced correlations are invariant with event multiplicity in pPb collisions, the ALICE [40] and ATLAS [41] experiments proposed to subtract the results of low-multiplicity events, where the long-range correlation signal is not present, from those of high-multiplicity events. While further justification of this assumption is still required, a similar procedure is applied in this paper for comparison purposes. The Fourier coefficients, Vn∆, extracted from
Eq. (4) for Ntrkoffline < 20 (corresponding to the 70–100% lowest-multiplicity events for pPb) are subtracted from the data in the higher-multiplicity region:
Vn∆sub =Vn∆−Vn∆(Ntrkoffline<20) × Nassoc(N offline trk <20) Nassoc × Yjet Yjet(Ntrkoffline<20) , (9)
where Yjet represents the near-side jet yield. The ratio, Yjet/Yjet(Ntrkoffline < 20), is introduced
to account for the enhanced jet correlations due to the selection of higher-multiplicity events seen in Fig. 6b. This procedure is tested using theHIJINGmodel, where there are no final-state interactions of jets in pPb collisions. The residual Vn∆subinHIJINGafter subtraction is found to be less than 5%. The low-multiplicity-subtracted v2{2,|∆η| > 2}and v3{2,|∆η| > 2}(limited to
pT <2 GeV/c for v3due to the low statistical precision of the low-multiplicity data) are shown
at low pT remain almost unchanged, while a reduction is seen in v2 for higher pT particles.
This is consistent with the observation of stronger jet-like correlations at higher pT in Fig. 5b.
The CMS data are compared to the measurement by the ATLAS experiment for an event mul-tiplicity class (selected based on the total transverse energy measured with 3.1 < η < 4.9 in
the direction of the Pb beam) comparable to 120 ≤ Noffline
trk < 150 used in the CMS analysis,
after subtracting the 50–100% lowest-multiplicity data. The v2{2}and v3{2}data measured by
the ALICE experiment for the 0–20% highest-multiplicity pPb collisions [40] are also shown in Figs. 7 and 8. Results from all three experiments are consistent within quoted uncertainties.
offline trk
N
0
100
200
300
2v
0.00 0.05 0.10= 2.76 TeV
NNs
(a) PbPb
< 3 GeV/c
T0.3 < p
|>2} η ∆ {2, | 2 v <20 sub. offline trk , N |>2} η ∆ {2, | 2 v {4} 2 v offline trkN
0
100
200
300
2v
0.00 0.05 0.10= 5.02 TeV
NNs
(b) pPb
offline trkN
0
100
200
300
0.2 0.4 0.6 0.84
2 2+v
2
2 2v
4
2 2-v
2
2 2v
offline trkN
0
100
200
300
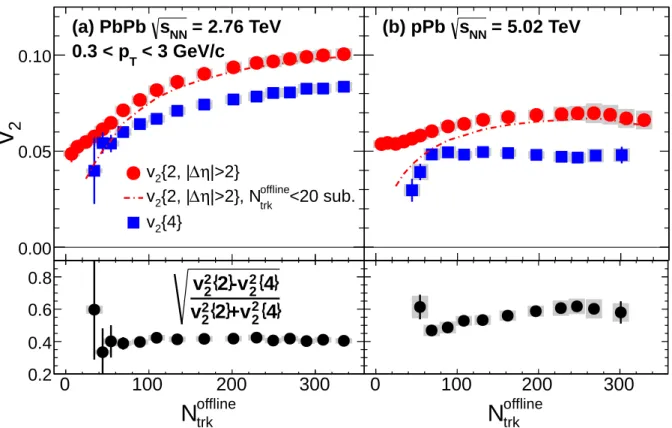
0.2 0.4 0.6 0.8Figure 9: Top: the v2{2,|∆η| > 2}(circles) and v2{4}(squares) values as a function of Ntrkoffline
for 0.3 < pT < 3 GeV/c, in 2.76 TeV PbPb collisions (left) and 5.02 TeV pPb collisions (right).
Bottom: upper limits on the relative v2fluctuations estimated from v2{2}and v2{4}in 2.76 TeV
PbPb collisions (left) and 5.02 TeV pPb collisions (right). The error bars correspond to statis-tical uncertainties, while the shaded areas denote the systematic uncertainties. Results after subtracting the low-multiplicity data (Ntrkoffline<20) are also shown (curves).
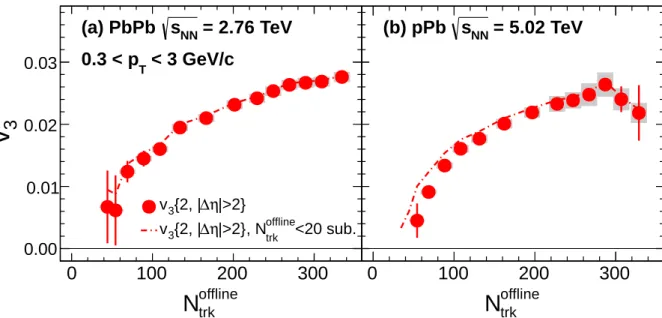
The multiplicity dependencies of v2 and v3 for PbPb and pPb collisions, averaged over the
pT range from 0.3 to 3 GeV/c, are shown in Figs. 9 and 10, respectively. The v2{2,|∆η| > 2}
and v2{4}values in PbPb collisions exhibit a moderate increase with Ntrkoffline, while these
co-efficients remain relatively constant as a function of multiplicity for pPb data at larger values
of Ntrkoffline. This is consistent with the monotonic rise of the associated yield as a function of
multiplicity shown in Fig. 6, which is mainly driven by the increase of total number of pairs per trigger particle, as indicated in Eq. (4). Similarly to Figs. 7 and 8, the PbPb data show a larger v2signal than observed for the pPb data over a wide multiplicity range, while the
mag-nitude of v3{2,|∆η| >2}is remarkably similar for both systems at the same event multiplicity.
This similarity of the triangular flow is not trivially expected within a hydrodynamic picture since the initial-state collision geometry is very different for the pPb and PbPb systems. Below an Ntrkoffline value of 40–50, neither v3{2,|∆η| > 2}nor v2{4}could be reliably extracted. The
5.3 Fourier Harmonicsvn 15 offline trk
N
0
100
200
300
3
v
0.00 0.01 0.02 0.03 |>2} η ∆ {2, | 3 v <20 sub. offline trk , N |>2} η ∆ {2, | 3 v= 2.76 TeV
NNs
(a) PbPb
< 3 GeV/c
T0.3 < p
offline trkN
0
100
200
300
3
v
0.00 0.01 0.02 0.03= 5.02 TeV
NNs
(b) pPb
Figure 10: The v3{2,|∆η| >2}values as a function of Ntrkofflinefor 0.3< pT <3 GeV/c, in 2.76 TeV
PbPb collisions (left) and 5.02 TeV pPb collisions (right). The error bars correspond to statistical uncertainties, while the shaded areas denote the systematic uncertainties.
loss of a v2{4}signal indicates either the absence of collective effects for very-low-multiplicity
collisions, or the breakdown of the four-particle cumulant technique in the limit of a small number of particles. The procedure of subtracting the low-multiplicity data to attempt to remove jet correlations is also performed here and shown as dash-dotted curves in Figs. 9 and 10. The v3{2,|∆η| > 2} values become larger after subtraction, especially for the
low-multiplicity region, due to the fact that V3∆extracted for Ntrkoffline<20 is negative. The resulting v2{2,|∆η| > 2}and v3{2,|∆η| > 2}are found to remain almost unchanged after subtraction
in the high-multiplicity region (i.e., for Ntrkoffline >200). This is expected since, for a given asso-ciated yield from jet correlations, the contribution to vn{2}is suppressed by 1/
√
Noffline trk as the
multiplicity increases, as indicated by Eq. (4). Therefore, the higher-multiplicity events provide a much cleaner environment for studying the long-range correlations.
Figure 11 shows the comparison of v2{2,|∆η| > 2}and v2{4}results as a function of
mul-tiplicity from CMS, averaged over 0.3 < pT < 3 GeV/c, with those obtained by the ATLAS
experiment, averaged over 0.3 < pT < 5 GeV/c with the data from the 2012 pPb run. The
AT-LAS v2{2,|∆η| > 2}values have the contribution from the 50–100% lowest multiplicity data
subtracted, while the corresponding CMS data, shown as a curve in Fig. 11, use the 70–100% lowest multiplicity events for the subtraction. The difference in the low-multiplicity events used for the subtraction could explain the slight discrepancy in the resulting v2{2,|∆η| > 2}
data from the two experiments. The v2{4}values from ATLAS are systematically higher than
the CMS data. This may be accounted for by the multiplicity fluctuation effect discussed pre-viously (e.g., Fig. 1), although the discrepancy is not large with respect to the uncertainties. Finally, the magnitude of event-by-event v2fluctuations is estimated from the difference in the
v2{2,|∆η| >2}and v2{4}results. If hydrodynamic flow is the dominant source of the
correla-tions, the relative v2fluctuations can be approximated by √
(v22{2} −v22{4})/(v22{2} +v22{4})[59]. The resulting flow fluctuation values calculated for pPb and PbPb collisions are shown in the bottom two panels of Fig. 9, with 40% v2 fluctuations observed in PbPb and 50–60%
offline trk
N
0 100 200 300 2v
0.00 0.05 0.10v
2{2, |
∆
η
|>2}
<20 sub.
offline trk, N
|>2}
η
∆
{2, |
2v
{4}
2v
= 5.02 TeV
NNs
CMS pPb
< 5 GeV/c
TATLAS, 0.3 < p
< 3 GeV/c
T0.3 < p
, 50-100% sub.
|>2}
η
∆
{2, |
2v
{4}
2v
Figure 11: The v2{2,|∆η| >2}and v2{4}values as a function of Ntrkofflinefor 0.3< pT<3 GeV/c,
measured by CMS in 5.02 TeV pPb collisions (filled). The dash-dotted curve shows the CMS v2{2,|∆η| > 2}values after subtracting the 70–100% lowest-multiplicity data, to be compared
with the ATLAS results subtracted by 50-100% lowest-multiplicity data (open) [49]. The er-ror bars correspond to statistical uncertainties, while the shaded areas denote the systematic uncertainties.
LHC is comparable to the value measured in 200 GeV AuAu collisions at RHIC [60]. As a con-sequence of possible residual nonflow correlations from back-to-back jets on the away side in the v2{2,|∆η| > 2}measurement, these results should be considered as upper limits on the
flow fluctuations.
6
Summary
Detailed studies of two- and four-particle azimuthal correlations have been performed in pPb collisions at √sNN = 5.02 TeV by the CMS experiment. The new measurements extend previ-ous CMS two-particle correlation analyses in pPb collisions to a significantly broader particle multiplicity range. A direct comparison of the correlation data between pPb and PbPb col-lisions was presented as a function of particle multiplicity and transverse momentum. The observed correlations were quantified in terms of the integrated near-side associated yields and azimuthal anisotropy Fourier harmonics (vn). For both pPb and PbPb collisions, elliptic
(v2) and triangular (v3) flow Fourier harmonics were extracted from long-range two-particle
correlations. Furthermore, the elliptic flow was studied with a four-particle cumulant analysis, where multi-particle correlations can be directly investigated.
For a fixed passocT range, the long-range yield and anisotropy harmonics show similar trends as a function of ptrigT , first increasing and then decreasing with a maximum at ptrigT ≈2–3 GeV/c in both pPb and PbPb collisions. For pPb collisions, the long-range associated yield rises
mono-References 17
tonically with particle multiplicity. Correspondingly, the v2harmonics obtained from the
two-and four-particle correlation analyses show only a weak multiplicity dependence. Compar-ing the pPb and PbPb systems at the same multiplicity and pT, the long-range yield and v2
signals are found to have a larger magnitude in PbPb than in pPb, while the v3 signal has a
remarkably similar magnitude in both systems. In addition, the long-range yield, v2 obtained
from the four-particle method, and v3all become apparent at about the same multiplicity. The
comprehensive correlation data presented in this paper, spanning a very wide range in particle multiplicity and transverse momentum, should provide significant insights into the origin of the azimuthal correlations in small collision systems, particularly in the context of the hydro-dynamic and color glass condensate models.
Acknowledgments
We congratulate our colleagues in the CERN accelerator departments for the excellent perfor-mance of the LHC and thank the technical and administrative staffs at CERN and at other CMS institutes for their contributions to the success of the CMS effort. In addition, we gratefully ac-knowledge the computing centres and personnel of the Worldwide LHC Computing Grid for delivering so effectively the computing infrastructure essential to our analyses. Finally, we ac-knowledge the enduring support for the construction and operation of the LHC and the CMS detector provided by the following funding agencies: BMWF and FWF (Austria); FNRS and FWO (Belgium); CNPq, CAPES, FAPERJ, and FAPESP (Brazil); MEYS (Bulgaria); CERN; CAS, MoST, and NSFC (China); COLCIENCIAS (Colombia); MSES (Croatia); RPF (Cyprus); MoER, SF0690030s09 and ERDF (Estonia); Academy of Finland, MEC, and HIP (Finland); CEA and CNRS/IN2P3 (France); BMBF, DFG, and HGF (Germany); GSRT (Greece); OTKA and NKTH (Hungary); DAE and DST (India); IPM (Iran); SFI (Ireland); INFN (Italy); NRF and WCU (Re-public of Korea); LAS (Lithuania); CINVESTAV, CONACYT, SEP, and UASLP-FAI (Mexico); MSI (New Zealand); PAEC (Pakistan); MSHE and NSC (Poland); FCT (Portugal); JINR (Arme-nia, Belarus, Georgia, Ukraine, Uzbekistan); MON, RosAtom, RAS and RFBR (Russia); MSTD (Serbia); SEIDI and CPAN (Spain); Swiss Funding Agencies (Switzerland); NSC (Taipei); ThEP-Center, IPST and NSTDA (Thailand); TUBITAK and TAEK (Turkey); NASU (Ukraine); STFC (United Kingdom); DOE and NSF (USA).
Individuals have received support from the Marie-Curie programme and the European Re-search Council and EPLANET (European Union); the Leventis Foundation; the A. P. Sloan Foundation; the Alexander von Humboldt Foundation; the Belgian Federal Science Policy Of-fice; the Fonds pour la Formation `a la Recherche dans l’Industrie et dans l’Agriculture (FRIA-Belgium); the Agentschap voor Innovatie door Wetenschap en Technologie (IWT-(FRIA-Belgium); the Ministry of Education, Youth and Sports (MEYS) of Czech Republic; the Council of Science and Industrial Research, India; the Compagnia di San Paolo (Torino); the HOMING PLUS pro-gramme of Foundation for Polish Science, cofinanced by EU, Regional Development Fund; and the Thalis and Aristeia programmes cofinanced by EU-ESF and the Greek NSRF.
References
[1] J.-Y. Ollitrault, “Anisotropy as a signature of transverse collective flow”, Phys. Rev. D 46 (1992) 229, doi:10.1103/PhysRevD.46.229.
[2] PHOBOS Collaboration, “System size dependence of cluster properties from two-particle angular correlations in Cu+Cu and Au+Au collisions at√sNN= 200 GeV”, Phys. Rev. C 81 (2010) 024904, doi:10.1103/PhysRevC.81.024904, arXiv:0812.1172.
[3] PHENIX Collaboration, “Formation of dense partonic matter in relativistic nucleus nucleus collisions at RHIC: Experimental evaluation by the PHENIX collaboration”, Nucl. Phys. A 757 (2005) 184, doi:10.1016/j.nuclphysa.2005.03.086, arXiv:nucl-ex/0410003.
[4] STAR Collaboration, “Experimental and theoretical challenges in the search for the quark gluon plasma: The STAR collaboration’s critical assessment of the evidence from RHIC collisions”, Nucl. Phys. A 757 (2005) 102,
doi:10.1016/j.nuclphysa.2005.03.085, arXiv:nucl-ex/0501009.
[5] B. B. Back et al., “The PHOBOS perspective on discoveries at RHIC”, Nucl. Phys. A 757 (2005) 28, doi:10.1016/j.nuclphysa.2005.03.084, arXiv:nucl-ex/0410022. [6] PHENIX Collaboration, “Saturation of azimuthal anisotropy in Au + Au collisions at√
sNN =62 GeV to 200 GeV”, Phys. Rev. Lett. 94 (2005) 232302,
doi:10.1103/PhysRevLett.94.232302.
[7] STAR Collaboration, “Directed and elliptic flow of charged particles in Cu+Cu collisions at√sNN =22.4 GeV”, Phys. Rev. C 85 (2012) 014901,
doi:10.1103/PhysRevC.85.014901.
[8] PHOBOS Collaboration, “System Size, Energy, Pseudorapidity, and Centrality Dependence of Elliptic Flow”, Phys. Rev. Lett. 98 (2007) 242302,
doi:10.1103/PhysRevLett.98.242302.
[9] CMS Collaboration, “Measurement of the elliptic anisotropy of charged particles
produced in PbPb collisions at nucleon-nucleon center-of-mass energy = 2.76 TeV”, Phys. Rev. C 87 (2013) 014902, doi:10.1103/PhysRevC.87.014902, arXiv:1204.1409. [10] ALICE Collaboration, “Elliptic Flow of Charged Particles in Pb-Pb Collisions at√
sNN =2.76 TeV”, Phys. Rev. Lett. 105 (2010) 252302,
doi:10.1103/PhysRevLett.105.252302.
[11] ATLAS Collaboration, “Measurement of the pseudorapidity and transverse momentum dependence of the elliptic flow of charged particles in lead-lead collisions at√sNN = 2.76 TeV with the ATLAS detector”, Phys. Lett. B 707 (2012) 330,
doi:10.1016/j.physletb.2011.12.056, arXiv:1108.6018.
[12] STAR Collaboration, “Distributions of charged hadrons associated with high transverse momentum particles in pp and Au + Au collisions at√sNN = 200 GeV”, Phys. Rev. Lett.
95(2005) 152301, doi:10.1103/PhysRevLett.95.152301, arXiv:nucl-ex/0501016.
[13] STAR Collaboration, “Long range rapidity correlations and jet production in high energy nuclear collisions”, Phys. Rev. C 80 (2009) 064912,
doi:10.1103/PhysRevC.80.064912, arXiv:0909.0191.
[14] PHOBOS Collaboration, “High transverse momentum triggered correlations over a large pseudorapidity acceptance in Au+Au collisions at√sNN= 200 GeV”, Phys. Rev. Lett. 104 (2010) 062301, doi:10.1103/PhysRevLett.104.062301, arXiv:0903.2811. [15] STAR Collaboration, “Three-particle coincidence of the long range pseudorapidity
correlation in high energy nucleus-nucleus collisions”, Phys. Rev. Lett. 105 (2010) 022301, doi:10.1103/PhysRevLett.105.022301, arXiv:0912.3977.
References 19
[16] N. Armesto, C. A. Salgado, and U. A. Wiedemann, “Measuring the collective flow with jets”, Phys. Rev. Lett. 93 (2004) 242301, doi:10.1103/PhysRevLett.93.242301, arXiv:hep-ph/0405301.
[17] A. Majumder, B. Muller, and S. A. Bass, “Longitudinal Broadening of Quenched Jets in Turbulent Color Fields”, Phys. Rev. Lett. 99 (2007) 042301,
doi:10.1103/PhysRevLett.99.042301, arXiv:hep-ph/0611135.
[18] C. B. Chiu and R. C. Hwa, “Pedestal and peak structure in jet correlation”, Phys. Rev. C
72(2005) 034903, doi:10.1103/PhysRevC.72.034903, arXiv:nucl-th/0505014.
[19] C.-Y. Wong, “Momentum kick model description of the near-side ridge and jet quenching”, Phys. Rev. C 78 (2008) 064905, doi:10.1103/PhysRevC.78.064905, arXiv:0806.2154.
[20] P. Romatschke, “Momentum broadening in an anisotropic plasma”, Phys. Rev. C 75 (2007) 014901, doi:10.1103/PhysRevC.75.014901, arXiv:hep-ph/0607327. [21] E. V. Shuryak, “On the origin of the “ridge” phenomenon induced by jets in heavy ion
collisions”, Phys. Rev. C 76 (2007) 047901, doi:10.1103/PhysRevC.76.047901, arXiv:0706.3531.
[22] S. A. Voloshin, “Two particle rapidity, transverse momentum, and azimuthal correlations in relativistic nuclear collisions and transverse radial expansion”, Nucl. Phys. A 749 (2005) 287, doi:10.1016/j.nuclphysa.2004.12.053,
arXiv:nucl-th/0410024.
[23] A. P. Mishra, R. K. Mohapatra, P. S. Saumia, and A. M. Srivastava, “Superhorizon
fluctuations and acoustic oscillations in relativistic heavy-ion collisions”, Phys. Rev. C 77 (2008) 064902, doi:10.1103/PhysRevC.77.064902, arXiv:0711.1323.
[24] J. Takahashi et al., “Topology studies of hydrodynamics using two particle correlation analysis”, Phys. Rev. Lett. 103 (2009) 242301,
doi:10.1103/PhysRevLett.103.242301, arXiv:0902.4870.
[25] B. Alver and G. Roland, “Collision geometry fluctuations and triangular flow in heavy-ion collisions”, Phys. Rev. C 81 (2010) 054905,
doi:10.1103/PhysRevC.81.054905, arXiv:1003.0194. Erratum: doi:10.1103/PhysRevC.82.039903.
[26] B. H. Alver, C. Gombeaud, M. Luzum, and J.-Y. Ollitrault, “Triangular flow in hydrodynamics and transport theory”, Phys. Rev. C 82 (2010) 034913,
doi:10.1103/PhysRevC.82.034913, arXiv:1007.5469.
[27] B. Schenke, S. Jeon, and C. Gale, “Elliptic and triangular flow in event-by-event D=3+1 viscous hydrodynamics”, Phys. Rev. Lett. 106 (2011) 042301,
doi:10.1103/PhysRevLett.106.042301, arXiv:1009.3244.
[28] H. Petersen, G.-Y. Qin, S. A. Bass, and B. M ¨uller, “Triangular flow in event-by-event ideal hydrodynamics in Au+Au collisions at√sNN = 200 GeV”, Phys. Rev. C 82 (2010) 041901, doi:10.1103/PhysRevC.82.041901, arXiv:1008.0625.
[29] J. Xu and C. M. Ko, “Effects of triangular flow on di-hadron azimuthal correlations in relativistic heavy ion collisions”, Phys. Rev. C 83 (2011) 021903,
doi:10.1103/PhysRevC.83.021903, arXiv:1011.3750.
[30] D. Teaney and L. Yan, “Triangularity and dipole asymmetry in heavy ion collisions”, Phys. Rev. C 83 (2011) 064904, doi:10.1103/PhysRevC.83.064904,
arXiv:1010.1876.
[31] S. Voloshin and Y. Zhang, “Flow study in relativistic nuclear collisions by Fourier expansion of azimuthal particle distributions”, Z. Phys. C 70 (1996) 665,
doi:10.1007/s002880050141, arXiv:hep-ph/9407282.
[32] Z. Qiu, C. Shen, and U. Heinz, “Hydrodynamic elliptic and triangular flow in Pb-Pb collisions at√sNN= 2.76 TeV”, Phys. Lett. B 707 (2012) 151,
doi:10.1016/j.physletb.2011.12.041, arXiv:1110.3033.
[33] CMS Collaboration, “Long-range and short-range dihadron angular correlations in central PbPb collisions at a nucleon-nucleon center of mass energy of 2.76 TeV”, JHEP 07 (2011) 076, doi:10.1007/JHEP07(2011)076, arXiv:1105.2438.
[34] CMS Collaboration, “Centrality dependence of dihadron correlations and azimuthal anisotropy harmonics in PbPb collisions at√sNN = 2.76 TeV”, Eur. Phys. J. C 72 (2012) 2012, doi:10.1140/epjc/s10052-012-2012-3, arXiv:1201.3158.
[35] ALICE Collaboration, “Higher harmonic anisotropic flow measurements of charged particles in Pb-Pb collisions at√sNN = 2.76 TeV”, Phys. Rev. Lett. 107 (2011) 032301, doi:10.1103/PhysRevLett.107.032301, arXiv:1105.3865.
[36] ALICE Collaboration, “Harmonic decomposition of two-particle angular correlations in Pb-Pb collisions at√sNN = 2.76 TeV”, Phys. Lett. B 708 (2012) 249,
doi:10.1016/j.physletb.2012.01.060, arXiv:1109.2501.
[37] ATLAS Collaboration, “Measurement of the azimuthal anisotropy for charged particle production in√sNN = 2.76 TeV lead-lead collisions with the ATLAS detector”, Phys. Rev. C 86 (2012) 014907, doi:10.1103/PhysRevC.86.014907, arXiv:1203.3087. [38] CMS Collaboration, “Observation of long-range near-side angular correlations in
proton-proton collisions at the LHC”, JHEP 09 (2010) 091, doi:10.1007/JHEP09(2010)091, arXiv:1009.4122.
[39] CMS Collaboration, “Observation of long-range near-side angular correlations in proton-lead collisions at the LHC”, Phys. Lett. B 718 (2013) 795,
doi:10.1016/j.physletb.2012.11.025, arXiv:1210.5482.
[40] ALICE Collaboration, “Long-range angular correlations on the near and away side in pPb collisions at√sNN = 5.02 TeV”, Phys. Lett. B 719 (2013) 29,
doi:10.1016/j.physletb.2013.01.012, arXiv:1212.2001.
[41] ATLAS Collaboration, “Observation of Associated Near-Side and Away-Side
Long-Range Correlations in√sNN = 5.02 TeV Proton-lead Collisions with the ATLAS Detector”, Phys. Rev. Lett. 110 (2013) 182302,