António Pedro Domingues Além
Licenciado em Engenharia de Materiais
Iontronics with cork
Dissertação para Obtenção do Grau de Mestre emEngenharia de Materiais
Orientador: Doutor Luís Miguel Nunes Pereira, Professor Associado do Departamento de Ciência dos Materiais, Faculdade de Ciências e Tecnologia da Universidade Nova de Lisboa
Co-orientador: Cristina Gaspar, investigadora no CENIMAT/I3N, Faculdade de Ciências e Tecnologia da
Universidade Nova de Lisboa
Júri
Presidente: Doutor Rodrigo Ferrão de Paiva Martins, Professor Catedrático do Departamento de Ciência dos Materiais, Faculdade de Ciências e Tecnologia da Universidade Nova de Lisboa
Arguentes: Doutora Ana Catarina Bernardino Baptista, investigadora no CENIMAT/I3N, Faculdade de Ciências e Tecnologia da Universidade Nova de Lisboa
Vogais: Doutor Luís Miguel Nunes Pereira, Professor Associado do Departamento de Ciência dos Materiais, Faculdade de Ciências e Tecnologia da Universidade Nova de Lisboa
v
Iontronics with cork
Copyright © António Pedro Domingues Além, Faculdade de Ciências e Tecnologia, Universidade Nova de Lisboa.
A Faculdade de Ciências e Tecnologia e a Universidade Nova de Lisboa têm o direito, perpétuo e sem limites geográficos, de arquivar e publicar esta dissertação através de exemplares impressos reproduzidos em papel ou de forma digital, ou por qualquer outro meio conhecido ou que venha a ser inventado, e de a divulgar através de repositórios científicos e de admitir a sua cópia e distribuição com objectivos educacionais ou de investigação, não comerciais, desde que seja dado crédito ao autor e editor.
vii
Acknowledgements
ix
Resumo
______________________________________________________________________ Este trabalho relata uma funcionalização sem precedentes de um dos materiais naturais mais únicos da Terra, a cortiça, no campo da eletrónica. Motivado pelo desperdício excessivo da indústria da cortiça e recorrendo a outros materiais naturais e abundantes na natureza, foi possível desenvolver com sucesso eletrólitos à base de cortiça capazes de equiparar-se aos mais avançados eletrólitos orgânicos desenvolvidos até à data.
Numa abordagem primária, várias etapas são consideradas e constantemente reavaliadas para produzir o primeiro eletrólito funcional à base de cortiça. Um sistema de solventes aquoso utilizando sais de lítio e ureia é essencial, assim como um agente ligante natural, aqui um derivado de celulose, e uma neutralização ácida. Seguidamente, estes novos eletrólitos à base de cortiça são testados como dielétrico de porta em EGTs com uma tinta semicondutora à base de celulose, e o seu desempenho elétrico é estudado. Os eletrólitos à base de cortiça apresentam propriedades interessantes para aplicações como supercapacitores, wearables eletrónicos ou mostradores electrocrómicos devido a seus valores de capacitância de dupla camada elétrica (CDL) superiores a 8 µF cm-2 e
condutividade iónica na ordem de 10−4 S cm − 1.
Os EGTs de carboximetilcelulose e óxido de zinco em substratos compósitos de cortiça com o material funcional de cortiça como o dielétrico de porta apresentam baixa tensão de trabalho (<2 V), Ion / Ioff de 103, um balanço sublimiar (SS) inferior a 0.3 Vdec−1
mobilidades de saturação (SAT) a 0,4 cm2V − 1s − 1 e transcondutância (gm) de 10−6 S.
Os transístores com porta eletrolítica em papel flexível baseados em cortiça também são demonstrados, operando em baixa tensão (Von<1V) e exibindo valores de
transcondutância (gm) de 10−4 S e mobilidades de saturação (SAT) superiores a 10
cm2V− 1s− 1.
Palavras-chave: Cortiça, eletrónica em cortiça, celulose, eletrónica em papel, eletrólitos,
transístores de porta eletrolítica.
xi
Abstract
______________________________________________________________________ This work reports an unprecedented functionalization of one of the most unique natural materials on Earth, cork, in the field of electronics. Motivated by the excessive waste of the cork industry and resorting to other natural and abundant materials in nature, it was possible to successfully develop electrolytes based on cork.
In a primary approach, there are several steps considered and constantly reevaluated in order to produce the first functional cork-based electrolyte. An aqueous lithium salts and urea solvent system is essential, as well as a natural binding agent, herein a cellulose derivative, and an acid neutralization. Secondly, these novel cork-based electrolytes are put to the test as the gate dielectric on EGTs with a cellulose based semiconducting ink, and their electrical performance is studied. The cork-based electrolytes show interesting properties for applications such as supercapacitors, electronic wearables or electrochromic displays due to their electrical double-layer capacitance (CDL) values of more than 8 µF cm−2 and ionic conductivity in the order of
10−4 S cm−1.
Carboxymethyl cellulose and zinc oxide EGTs on cork composite substrates with the functional cork material as the gate dielectric exhibit low working voltage (<2 V), Ion/Ioff ratios of 103, a subthreshold swing (SS) lower than 0.3 Vdec−1, low saturation
mobilities (SAT) at 0.4 cm2V−1s−1 and transconductance (gm) of 10−6 S. The flexible
cork-based electrolyte-gated transistors on paper are also demonstrated, operating at low voltage (Von <1V) and exhibiting transconductance (gm) values of 10−4 S and saturation
mobilities (SAT) higher than 10 cm2V−1s−1.
Keywords: Cork, cork electronics, cellulose, paper electronics, electrolytes,
electrolyte-gated transistors.
xiii
Table of Contents
Acknowledgements ... vii
Resumo ... ix
Abstract ... xi
Table of Contents ... xiii
List of Tables ... xv
List of Figures ... xvii
Acronyms ... xix
List of Symbols ... xxi
Chapter 1: Motivation and Objectives ... 1
Chapter 2: Introduction ... 3
2.1 Cork as a raw material ... 3
2.2 Electrolytes ... 5
2.3 Electrolyte-gated transistors ... 6
Chapter 3: Materials and Methods ... 9
3.1 Electrolyte Formulation ... 9
3.2 Characterization techniques ... 10
3.3 Fabrication of electrolyte-gated transistors ... 11
Chapter 4: Results and Discussion ... 13
4.1 Electrolyte formulation ... 13
4.2 Compositional analysis of the developed cork-based electrolytes ... 16
4.3 Structural analysis of the cork-based electrolytes ... 17
4.4 Electrochemical characterization of the cork-based electrolytes ... 18
4.5 Electrical characterization of the electrolyte-gated transistors ... 21
Chapter 5: Conclusions and Future Perspectives ... 25
5.1 Final Conclusions ... 25 5.2 Future Perspectives ... 25 Bibliography ... 27 Annexes ... 31 Annex A... 31 Annex B ... 33
xv
List of Tables
Table 1: Nomenclature of the developed cork-based electrolyte membranes. ... 10 Table 2: Parameter results from EIS measurements on cork-based electrolyte. ... 19 Table 3: Results of the electrical characterization of the cork-EGTs in comparison to
cellulose-EGTs, with specifications regarding the ETG's substrate and electrolyte used. ... 22 Table 4: Samples used for determination of the channels length (L) and width (W). ... 31
xvii
List of Figures
Figure 1: Obtained SEM image of untreated cork powder, and the harvesting of cork [22]. ... 4 Figure 2: Typical applications of cork from isolation, fabric textiles, bulletin boards,
automobile components and stoppers to heat-shields of spacecrafts [24]. ... 4 Figure 3: Schematic representation of a suberin molecule [28]. ... 5 Figure 4: Electrolyte-gated transistor schematic ... 6 Figure 5: SEM images of the honeycomb-like microstructure after the pre-treatment of
cork that stayed afloat (right) and cork that deposited at the bottom (left). ... 14 Figure 6: Samples of cork dissolution in lithium, urea and water solvent system. ... 14 Figure 7: Sample of cork-resin resulting from the dissolution and neutralization steps
without adding a binding agent. ... 15 Figure 8: Cork-based electrolytic membrane showing its elastic capabilities. ... 15 Figure 9: FTIR-ATR spectra of before and after the dissolution and centrifugation steps, showing the peaks associated with the main constituents of cork (Suberin, Lignin and Polysaccharides). ... 16 Figure 10: FTIR-ATR spectra of developed cork electrolyte membranes with 5 .wt%
CMC, using a solvent system of with LiOH, urea and water as solvents (without centrifugation -a, and with centrifugation -b) and just LiOH and water (without centrifugation -c , and with centrifugation -d). ... 17 Figure 11: XRD pattern of pre-treated cork powder and developed electrolyte
membrane samples. ... 17 Figure 12: a) Set up used for the EIS and cyclic voltammetry measurements. The
electrolyte is inserted between the two stainless steel discs with 1 cm2 b)
Illustration of the corresponding ECM suggested by Dasgupta et al. (adapted from [38]). ... 18 Figure 13: Capacitance (C) and phase angle () of cork-based electrolytes as a function
of the frequency. The symbols account for experimental values, whereas the dashed lines define the fitted data obtained through the ECM adapted from
Dasgupta et al. [38] ... 19 Figure 14: Nyquist plot of a cork-based electrolyte (4-C-LiU-C-56), with a fitting ECM adapted from Dasgupta et al. [38]. ... 20
xviii
Figure 15: CV measurements of the cork-based electrolytes using an applied potential from -2.5 to 2.5 V. The dashed lines correspond to a scan rate of 400 mVs−1 and the continuous lines to 50 mVs−1. ... 21 Figure 16: Schematic representation of the EGT printed on top of a cork surface. ... 22 Figure 17: Influence of the electrolyte used on the EGT and its substrate, on the transfer curve: cork-sheet on the left, office paper on the right. ... 23 Figure 18: Ampliation of an EGT device showing the length (L) and width (W) of the
channel. ... 32 Figure 19: Illustration of the nomenclature attributed to the transistor samples,
according to their line and column. ... 32 Figure 20: FTIR-ATR spectra of cork before and after the pre-treatment. Top - cork that stayed afloat. Bottom - cork that sank. ... 33 Figure 21: Schematic drawing of custom-made screen-printing system used at
CENIMAT|i3N and CEMOP [45]. ... 33 Figure 22: TG-DSC plots of a cork-based electrolyte membrane without urea (
top-right), a cork-based electrolyte membrane with urea(top-left), and the cork powder samples after the pre-treatment... 34
xix
Acronyms
a.u.
Arbitrary units
ATR-FTIR
Attenuated total reflection – Fourier-transform infrared
spectroscopy
CEMOP
Centro de Excelência de Microelectrónica, Optolectrónica
e Processos
CENIMAT|i3N Centro de Investigação de Materiais/ Instituto de
Nanoestruturas, Nanomodelação e Nanofabricação
CMC
Carboxymethyl cellulose
CMOS
Complementary metal oxide semiconductor
CPE
Constant phase element
CV
Cyclic voltammetry
ECM
Equivalent circuit model
ECT
Electrochemical transistor
EDL
Electrical double layer
EDLT
Electrical double layer transistor
EGT
Electrolyte gated transistor
EIS
Electrochemical impedance spectroscopy
EtOH
Ethanol
FET
Field-effect transistor
xx
IACS
Ionic alkaline cork solution
ICDD
International centre for diffraction data
LCDC
Liquid from cork dissolution centrifugation
LiOH
Lithium hydroxide
NP
Nano-particles
OFET
Organic field-effect transistor
OTFT
Organic thin-film transistor
R&D
Research and development
RH
Relative humidity
SEM
Scanning electron microscopy
TFT
Thin-film transistor
TG-DSC
Thermogravimetric and differential scanning calorimetry
XRD
X-ray diffraction
xxi
List of Symbols
µ
FETField-effect mobility
µ
SATSaturation mobility
C
DLCapacitance of electric double-layer
C
iCapacitance of the dielectric layer
g
mTransconductance
I
DSDrain current
I
GSGate leakage current
I
OffOff-state current
I
OnOn-state current
L
Channel length
𝒍
Thickness of the electrolyte membrane
n
0Free carrier’s density
q
Elementary electron charge
R
bElectrolyte bulk resistance
R
extContact resistance
SS
Subthreshold swing
xxii
V
fbFlat-band potential
V
GSVoltage from gate to source
V
OnTurn-on voltage
V
ThThreshold voltage
W
Channel width
Y
0Capacitance of a constant phase element
1
Chapter 1: Motivation and Objectives
We currently live in an Era of information and electronics strictly dependent on the assistance of modern technology advances. The outstanding technological accomplishments of our time are the result of the ongoing electronics revolutions where inorganic semiconductors such as silicon and gallium arsenide still play a fundamental role. With the increasing demand of the technological market, new and versatile offers arise, and so does the energy consumption expend in their production [1]. Also, beyond the environmental impact of our society’s demands and the excessive resource exploitation being carried out in order to indulge our society’s consumerist mentality, we are jeopardising the sustainable development required to ensure the needs of the present without compromising the ability of the future generations to meet their own needs [2]. In this sense, a paradigm shift in the way we control our resources and the electronics disposal is needed in order to minimize the negative impact of our present and future generations on the environment and to create a sustainable future.
Organic (carbon-based) technologies are being developed with the intuit of addressing the energy consumption and cost efficiency issues posed by their inorganic counterpart. Therefore, the strive for high-performance electronics applied to large area flexible substrates like plastic and cellulose-based substrates, such as paper, have driven the development of alternative advanced functional materials with tailored properties [3]. Over the last years, printed electronics have become a reliable manufacturing tool to satisfy the revolutionizing field of flexible sensors and electronics, providing cost-effective routes for processing diverse electronic materials at room temperature. The simplified processing steps, low wastage and reduced fabrication costs that have allowed the fabrication of electronics on even non-planar surfaces which would be extremely difficult to accomplish with conventional wafer-based techniques [4].
In this sense, this work has into consideration the use of abundant natural materials combined with low-cost and environmental responsible processes in pursuit of sustainability.
The cork industry generates a substantial amount of wastes and residues in the form of powder which has no commercial value, except to be burnt in order to produce
2
steam and heat for minor energy production. The cork powder wastes represent about 22% of the cork weight that is used for transformation (40,000 ton/year) [5].
At Centro de Investigação de Materiais/ Instituto de Nanoestruturas, Nanomodelação e Nanofabricação (CENIMAT|i3N), a great deal of research and development (R&D) has been done towards carbon-based electronics, focusing in cellulose, the most abundant biopolymer on Earth. Cellulose has been extensively explored and has assumed a key role in electronics, either as substrate to host devices and/or a dielectric and even as an efficient polymeric matrix to host functional materials [6], [7]. Remarkably, our research group have developed paper batteries [8], paper based field-effect transistors (FETs) [8]–[10], write-erase and read paper memory transistors [11] as well as paper-based CMOS inverters [12], [13], printable semiconducting cellulose composite inks compatible with screen-printing [6], [7], [14], [15]. However, cellulose-based paper still faces many challenges when we look for applications that demand for smooth interfaces, such as solar-cells and transistors, as it exhibits large surface roughness, high absorption and its properties are highly dependent on the environmental conditions [6].
Within this context, this master thesis focuses on giving a new life to cork waists with great potential through the development and study of the first flexible and highly conformable, cork-based electrolyte, bringing new insights to advanced functional materials based on cork. As a proof of concept, the developed cork-based electrolyte is successfully applied as a gate dielectric in low-voltage, flexible, printed, zinc-oxide (ZnO) semiconductor, electrolyte-gated transistors (EGTs) on office paper and cork composite substrates.
Throughout this work, several tasks were covered starting with the raw material towards its reengineering into an electrolyte, followed by its optimization, characterization and successful pioneer application in cork-based EGTs. The main tasks are the following:
• Fabrication of a cork-based electrolyte and optimization of its electrochemical properties.
• Characterization of the several steps and components of the electrolyte development, resorting to Attenuated Total Reflection – Fourier Transform Infrared (ATR-FTIR) spectroscopy, X-Ray Diffraction (XRD), Electrochemical Impedance Spectroscopy (EIS) adding to Scanning Electron Microscopy (SEM) and Thermogravimetric and Differential Scanning Calorimetry (TG-DSC) measurements.
• Application of the developed sticky and conformable cork-based electrolyte as gate dielectric in EGTs and subsequent electrical characterization.
3
Chapter 2: Introduction
In order to lay the grounds for the full understanding of this master’s thesis, a brief introduction of the most fundamental aspects and relevant topics will be given. Starting with the raw material under study, cork, and its current most common applications, to some fundamentals of the type of material aimed for, electrolytes, and the applications of the developed functional cork-based material and on to electrolyte-gated transistors and their mode of operation.
2.1 Cork as a raw material
Cork, a masterpiece of nature, is indelibly a factor of social and economic development for the Western Mediterranean countries. Portugal is the world leader in terms of production, transformation and commerce of cork, holding 730,000 hectares of cork forest (34% worldwide), producing 100,000 tonnes of cork per year (50% worldwide) and owns 63% of the world exportation of cork products, which accounts for 815.6 million euros [16]. The global cork business is estimated to employ over 100,000 workers and, the harvested cork trees are estimated to absorb 4 times more CO2 than
unharvested trees [17]. The actual extraction of cork helps removing and capturing carbon dioxide from the atmosphere, which demonstrated its positive impact on the environment. Cork oak is the only tree whose bark auto regenerates, acquiring a smoother texture after each extraction and allowing the extraction of cork for the first time after 25 years and every 9 years after the first, living on average 200 years [18]. Given that humanity has been using cork for so long, it’s no wonder that its chemical composition has been thoroughly studied, even the properties of cork from different regions [19].
Cork is the outer bark of the Quercus Suber L. tree. It is a natural, renewable and sustainable material that has been around for as long as people have drunk wine and was first observed in the microscope by Hooke in 1664. As shown in Figure 1 cork has a hollow honeycomb microstructure [20] ~20 µm wide and is mainly composed of suberin (~45 .wt%), lignin (~21 .wt%), polysaccharides (~20 .wt%) and cellulose (~9 .wt%) [21].
4
Figure 1: Obtained SEM image of untreated cork powder, and the harvesting of cork [22].
With an extraordinary set of properties such as impermeability to liquids and gases, its lightness (120 to 240 Kg m−3 [20]), elasticity and insulating capacity, as well as being fire retardant and hypoallergenic, cork is being used in the widest range of applications, from cork stoppers to thermal or acoustic insulation to a whole upcoming spectrum of composites [23]. Cork composites are one of the most promising fields of cork technology evolution [24].
Some of the most interesting and recent cork composites (Figure 2) are cork-plastic composites, densified insulation corkboard, automobile components, cork microparticles as reinforcement and filler agent, cement composites, etc. However, so far, never having been applied to electronics.
Figure 2: Typical applications of cork from isolation, fabric textiles, bulletin boards, automobile components and stoppers to heat-shields of spacecrafts [24].
Suberin, the main constituent of cork (~45wt%) [20], can be found throughout the vegetable realm being especially abundant in Quercus Suber L. Chemical studies have revealed that suberin is a natural polyester with aromatic and aliphatic monomers linked through ester bonds [23], as shown in Figure 3. Suberin plays an important role as a protective barrier for the plants against the surrounding environment and can be found mainly in cell walls [25]. It has aroused interest due to its heterogenous chemical composition and properties such as hydrophobicity and thermal resistance [26] and can be addressed as a potential property-enhancing additives [27].
5
Figure 3: Schematic representation of a suberin molecule [28].
Suberin’s main interest comes from its hydroxyfatty acids, dicarboxylic acids and mid-chain dihydroxy and epoxy derivatives that are rare in nature, apart from these sources. The most promising applications for suberin components are in medicine and in the synthesis of polymeric materials [25]. A major contemporary concern is the use of renewable raw materials and the search for implementing a eco-friendly polymer synthetic methods [29].So far, most of the methods to isolate suberin from cork consist of an alkaline methanolysis extraction using ethanol, water and dichloromethane follow by a subsequent method of isolation [20], [21], [28], [30]–[32]. However, these methods require toxic chemicals and are very time consuming. Other methods rely on ionic liquids that are less toxic and able to be recycled and reintroduced in the system. These methods allow the extraction of suberin with high yields. However, these ionic liquids take a lot of time to produce and are expensive [26], [27], [33].
2.2 Electrolytes
Although the first use of electrolytes in electronics dates to Brattain and fellow researchers in 1955 [34], new fast-response polymer electrolytes are expanding the potential applications of electrolyte-gated transistors (EGTs) in flexible displays, printed electric circuits and conformal bioelectronic sensors [3].
Electrolytes are ionic conductors, a class of functional materials with key roles in energy storage, solar energy conversion, sensors, and electronic devices [35]. Hydrogels containing electrolytes offer a unique combination of high stretchability, conformability, transparency and biocompatibility.
6
This work will focus towards developing cork-based electrolytes and applying these electrolytes to interface the gate and channel of TFTs, so called EGTs.
2.3 Electrolyte-gated transistors
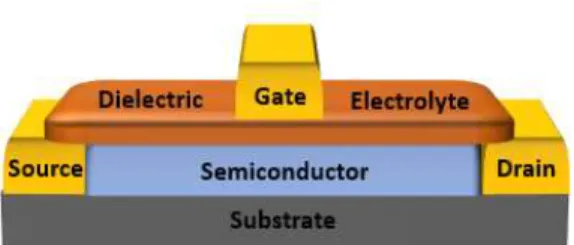
As illustrated in Figure 4, an EGT is a transistor in which an ion conducting, yet electron insulating electrolyte serves as a gate dielectric. The application of voltage at the gate electrode causes the migration and accumulation of ions at the gate/electrolyte and electrolyte/semiconductor interface, forming an electrical double layer (EDL) at each interface [29]. These EDL’s can be considered as nanometre-thick capacitors. An electrolyte enables holes and electrons to be induced at much lower operating voltages (<3V) due to its larger capacitance (1-10 μF cm-2) [30] when compared to conventional field-effect transistors (FETs) gated by oxide dielectrics (e.g. SiO2, TiO2 and Al2O3) that
exhibit a higher working voltage operation in the order of tens of volts. The principal benefit of a transistor having a highly capacitive electrolyte is that it allows the transistor to work and to operate at low voltages (<2V), as well as being compatible with printed techniques and allowing for creative designs [3].
Furthermore, contact resistance in EGTs has been shown to be orders of magnitude lower than conventional organic TFTs (OTFTs) [36] having neither the charge injection barrier at the metal/semiconductor interface nor the thickness of the layers an important influence on this parameter. However, EGTs can also suffer from high parasitic capacitances and large gate-source leak currents that lower the switching speeds and consume power [6].
Depending on the permeability of the semiconductor, two different classes of EGTs can be considered. EGTs with impermeable semiconductors have been referred to as electric double layer transistors (EDLTs), in which case the application of voltage to the gate electrode causes the accumulation of charges at the gate/electrolyte and electrolyte/semiconductor interfaces causing the formation of electrical double layers at both interfaces. On the other hand, EGTs that employ permeable semiconductors are referred to as electrochemical transistors (ECTs).
In this case, when voltage is applied to the gate, occurs the formation of an electrical double layer at the gate/electrolyte interface while at the electrolyte/semiconductor interface occurs the migration of ions into the semiconductor, due to its permeability. These ions compensate inducing charge carriers in a process called electrochemical doping [3].
7
Field-effect transistors (FET) have become one of the most appealed semiconductor devices in nearly every electronic product, used commonly for weak-signal amplification [6]. A FET in composed by 3 types of materials: the metal electrodes (gate, source and drain), the semiconductor channel between the source and the drain electrodes and the dielectric electrolyte connecting the gate electrode to the semiconductor channel [37]. When a gate voltage (VGS) is applied to the gate contact, it
induces the accumulation of charges at the dielectric/semiconductor interface that enables high current flow at the channel between the source and drain (IDS). A common model of
field-effect transistors gives the IDS in the linear regime, at low VDS, as:
𝐼𝐷𝑆,𝑙𝑖𝑛 = (𝑊/𝐿) µ𝐹𝐸𝑇𝐶𝑖(𝑉𝐺𝑆− 𝑉𝑡ℎ)𝑉𝐷𝑆 (1)
The IDS in the saturation regime (at high VDS) is:
𝐼𝐷𝑆,𝑠𝑎𝑡 = 𝑊/(2𝐿) µ𝐹𝐸𝑇𝐶𝑖(𝑉𝐺𝑆 − 𝑉𝑡ℎ)2 (2)
Where, in this model, 𝑊 and 𝐿 are the dimension of the channel (width and length, respectively). µ𝐹𝐸𝑇 is the field-effect mobility of the majority of charge carriers (ideally, µ𝐹𝐸𝑇 is the same in the linear (VDS<<VGS) and saturated regime), 𝐶𝑖 is the geometric
capacitance of the dielectric, 𝑉𝐺𝑆 is the voltage applied to the gate, 𝑉𝐷𝑆 is the applied voltage to the drain (both vs. the source, which is usually grounded) and 𝑉𝑡ℎ is the threshold voltage.
The subthreshold swing (𝑆𝑆) and saturation mobility (𝜇𝑆𝐴𝑇) where calculated using Equations (3) and (4), respectively:
𝑆𝑆 = (𝜕 log 𝐼𝐷𝑆 𝜕𝑉𝐺𝑆 | 𝑚𝑎𝑥 ) −1 (3) 𝜇𝑆𝐴𝑇 = (𝜕√𝐼𝐷𝑆 𝜕𝑉𝐺𝑆 ) 2 2𝐿 𝑊𝐶 (4)
Where, 𝐼𝐷𝑆 is the drain current, 𝑉𝐺𝑆 is the gate voltage, 𝐶 is the capacitance 𝐶𝐷𝐿 of the electrolyte and W and L are the width and length of the channel, respectively.
EGTs have many applications, ranging from textile electronics, biosensors, supercapacitors, circuits or electrochromic displays [14].
Herein, flexible electrolytes in the form of hydrogels are developed based on a cork matrix with incorporated lithium ions, making it more cost-efficient than most common dielectrics as well as being more rigid than liquid electrolytes that tend to be incompatible with most electronic devices.
Since the developed electrolytes will be assembled on EGTs in different substrates, the following section will shine some insights on this topic.
9
Chapter 3: Materials and Methods
This chapter aims to cover all the steps included in the development and characterization of the cork-based electrolyte membranes. Primarily, methods and reactants used to formulate the electrolytes will be laid out.
Secondly, the different characterization techniques used on the functional cork material to evaluate its behaviour, structure and stability will be listed. Also, the way in which the electrochemical characterisation was carried out will be shown.
Finally, techniques and steps taken into account for the fabrication of the cork-based EGTs will be displayed as well as the solvents present in each layer.
3.1 Electrolyte Formulation
All reagents were used as received, without further purification. Milipore (deionized) water was used throughout all the experiments.
Wine cork stoppers were obtained from different sources and used as raw material. The stoppers were grinded down to roughly 800nm thick powder, using a mechanical food processor with stainless steel blades, in order to increase the surface area of cork and reduce the duration of the dissolution. The cork powder was washed in several solvents (ethanol (96% vol. Aga NºCE: 200-578-6) and water) in order to remove its extractives and impurities.
The solvent system of lithium hydroxide (98%, pure, anhydrous, CAS 1310-65-2, Acros Organics), urea (99.5%, CAS: 57-13-6, Acros Organics) and water, with a weight ratio of 4.6:15:80.4, was prepared in accordance with that used by Cunha et al. [7], reported for the dissolution of cellulose, herein for the partial dissolution of cork. The dissolution environment is very alkaline due to the lithium ions (pH≥13). The dissolutions were performed at room temperature and at 5ºC in order to compare the influence of temperature in the duration of the dissolution.
10
Centrifugation was performed by a J.P. Selecta: CENTROFRIGER - BLT equipment, at 10000 rpm with a 2.5 minutes ramp for 30 minutes. The top liquid phase, henceforth named LCDC (liquid from cork dissolution centrifugation) was kept for the development of the electrolytes and the bottom solid insoluble phase was stored at room temperature for further and future research.
Sodium carboxymethyl cellulose (CMC, CAS: 9004-32-4, Aldrich) was added to the LCDC with different concentrations (4, 5 and 6 .wt%) before the regeneration step, with the aim of enhancing the mechanical properties of the electrolyte. Acetic acid (Merck, 99-100%) was used for a regeneration step.
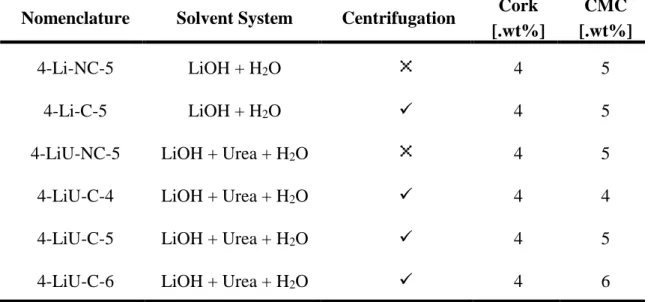
The nomenclature and compositions, as well as the steps present in the formulation of each sample are shown in Table 1.
Table 1: Nomenclature of the developed cork-based electrolyte membranes.
Nomenclature Solvent System Centrifugation Cork [.wt%]
CMC [.wt%]
4-Li-NC-5 LiOH + H2O 4 5
4-Li-C-5 LiOH + H2O ✓ 4 5
4-LiU-NC-5 LiOH + Urea + H2O 4 5
4-LiU-C-4 LiOH + Urea + H2O ✓ 4 4
4-LiU-C-5 LiOH + Urea + H2O ✓ 4 5
4-LiU-C-6 LiOH + Urea + H2O ✓ 4 6
3.2 Characterization techniques
The Attenuated Total Reflectance-Fourier Transform Infrared Spectroscopy (ATR-FTIR) of the different stages of the process were collected by a Nicolet 6700 FTIR Thermo Electron Corporation device, using a SMART iTR adapter. The samples were collected at room temperature using a range from 4500 – 525 cm-1 accumulating 32 scans with a resolution of 4 cm-1.
Herein, the structural analysis of the raw material and developed electrolytes are analysed through X-Ray Diffraction (XRD) via a PANalytical X’Pert Pro-x-ray diffractometer.
Electrochemical Impedance Spectroscopy (EIS) measurements were done using Gamry Instruments Reference 600 Potentiostat to determine the capacitance (C) and phase angle () as functions of frequency (ƒ) ranging from 0.1-106 Hz as well as the
11
respective Nyquist plots for the electrolyte membranes. For this, an additional equivalent circuit model (ECM) was required to analyse the EIS results. A model suggested by Dasgupta et al. [38] and Cunha et al.[7] was used for the data interpolation. The ECM enabled determination of 2 key parameters, namely the EDL capacitance (CDL) and the
ionic conductivity (σi).
The stability of the electrolyte membranes will also be evaluated through cyclic voltammetry (CV) from −2.5 to 2.5V, using different scan rates (50mV/s and 400mV/s) with steps size of 10 mV. All samples were cycled 5 times.
SEM images of the cork powder before and after washing are presented in order to observe the effect of said treatment in the condition of corks honeycomb microstructure. The results were obtained by a Carl Zeiss AURIGA CrossBeam workstation instrument.
Thermogravimetric and Differential Scanning Calorimetry (TG-DSC) measurements of the raw material and the resulting electrolyte membranes were performed using a Simultaneous Thermal Analyzer (TG-DSC – STA 449 F3 Jupiter), heating the samples on an aluminium crucible from room temperature to 550ºC under ambient atmosphere at a heating rate of 5 ºC min−1.
3.3 Fabrication of electrolyte-gated transistors
EGTs were fabricated through printing techniques as shown in Figure 21, present in Annex B, using conducting carbon ink (Carbon Conductive: BF02, Sun Chemical) for the source, gate and drain electrodes. The configuration of the EGT can be seen in Figure 18, present in Annex A. The carbon contacts were printed on top of the semiconducting ink. After being print, the contacts were immediately cured at 100ºC for 15 minutes in air.
A cellulose composite semiconducting ink was prepared based on previous research done at CENIMAT|i3N and CEMOP [6], using zinc oxide NPs (<100nm, CAS 1314-13-2, Aldrich) as 40 wt.% and 3.wt% CMC in water, with a weight ratio 40:60.
In this work, the performance of EGTs printed on cork-composite substrates will be tested, alongside EGTs printed on office paper. Paper has a more uniform surface than the cork-composite, however, paper is porous and absorbent [7]. Its permeability can sometimes represent a challenge in the design of the devices causing ink spreads that sometimes result in short-circuits. The electrolyte with the best electrochemical behaviour was selected and manually placed atop of the EGTs. The tests were performed on a Keysight Technologies equipment, at 22.8ºC with 44% RH.
13
Chapter 4: Results and Discussion
This section will be focused on the main results obtained from the developed cork-based electrolytes and their suitable application as gate dielectric in printed electrolyte-gated transistors (EGTs) fabricated on flexible substrates, such as office paper and cork composite sheets.
The first steps consist of figuring out exactly the effects of the key steps of centrifugation and solvent systems used on the final electrolytes in terms of constituents and crystallographic structures. Secondly, the electrochemical properties of the functional cork material will be studied, and the best performing device shall be identified. The influence of the cellulose derivative (CMC) and its abundance will also be included in this study.
Finally, the best performing electrolyte will be integrated in EGTs and the results will be compared against previously developed cellulose-based electrolytes, produced by Cunha et al.
4.1 Electrolyte formulation
4.1.1 Pre-treatment of the cork stoppers
Firstly, the cork powder was washed in an ethanol bath under vigorous stirring at 80ºC for 2 hours then for 1 hour, and subsequently washed under stir using only water at 100ºC for 30 minutes, then 30 minutes, then 15 minutes, filtering and changing the solvent between every washing. Ethanol is used to swell the cork cell walls which allow for the alkaline solution to dissociate the cork faster [39].
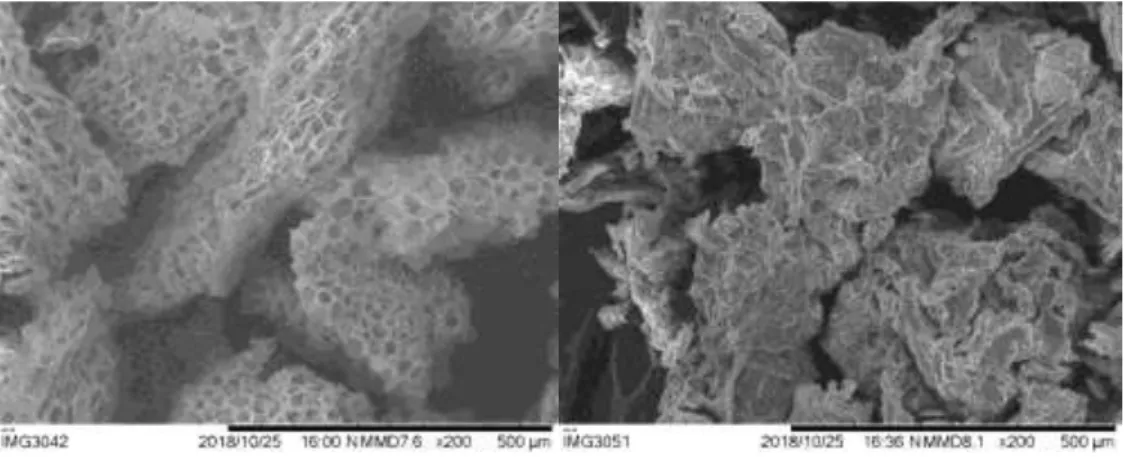
It was noticed that during the pre-treatment, part of the cork was deposited at the surface of the solvent and the rest at the bottom. The analysis of ATR-FTIR made in both types of sample proves that they are not different constituents as shown in Annex A. As shown in Figure 5, through SEM analysis it was possible to observe that the honeycomb microstructure in cork deposited in the bottom was less intact than the cork that stayed afloat.
14
Figure 5: SEM images of the honeycomb-like microstructure after the pre-treatment of cork that stayed afloat (right) and cork that deposited at the bottom (left).
4.1.2 Partial dissolution of the washed cork powder
At first the dissolutions were done at low temperatures in accordance to Cunha et al. and would take about 1 week to completely dissolve the cork powder. However, dissolutions made at room temperature reduced the dissolution time significantly to 2 to 3 days.
In Annex B are the TG-DSC graphics of the cork sample before the dissolution and after, regarding the presence of urea. There are 2 visible mechanisms of degradation in cork (one at ~210 ºC and the other ~320º). Figure 22, in Annex B, suggest that the presence of urea enhances the partial alkaline dissolution by breaking the cork monomers into smaller molecules, resulting in a more effective degradation between the 2 mechanisms when urea in present. Until the first degradation mechanism (~210 ºC), the weight loss is attributed to water content in the electrolyte membranes.
After the dissolution and centrifugation, the LCDC was drop-casted onto a glass substrate and left to dry at a closed environment at room temperature. The result was a very rigid and robust, wood-like membrane, presenting also some dendritic irregularities, as shown in Figure 6.
Figure 6: Samples of cork dissolution in lithium, urea and water solvent system.
In order to make the electrolyte membranes more malleable, a step of neutralization, regeneration and additional proton (H+) incorporation to the samples with
15
acetic acid was carried out in accordance to Cunha et al. for the development of cellulose based electrolytes. The acetic acid was added to the dissolution in an icy bath, drop by drop until pH≈6. The icy bath was used to prevent the samples from overheating, which would promote the reaction of the acid and urea, that in turn would result in the formation of undesired by-products such as acetamide and gases such as carbon dioxide and ammonia [7].
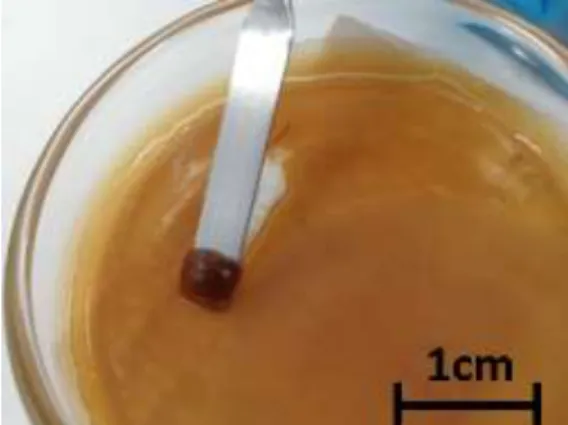
Once the neutralization step was concluded, the samples where again drop-casted onto glass substrates and left to dry at room temperature in a closed environment. The results show a very humid, gooey and sticky resin, as shown in Figure 7.
Figure 7: Sample of cork-resin resulting from the dissolution and neutralization steps without adding a binding agent.
Finally, in order to obtain an electrolytic membrane, a cellulose derivative, sodium carboxymethyl cellulose (CMC) was slowly added to the LCDC under vigorous stirring at room temperature, from 4 to 6 wt.%. CMC was chosen for its film forming ability, as well as its high mechanical strength and capability to form transparent films[7]. Afterwards, the samples this time were shear-casted on glass substrates with fixed speed and height (~250µm) and left to dry at a dark and closed environment at room temperature for approximately 24 hours. The result in Figure 8 shows a rigid, yet quite stretchable, flexible and almost transparent membrane.
16
4.2 Compositional analysis of the developed cork-based
electrolytes
ATR-FTIR was utilized in order to identify compounds throughout the development of the cork electrolyte. Figure 9 shows the ATR-FTIR spectra for the cork powder to be used after the EtOH/water treatment versus the insoluble solid material deposited after centrifugation of the cork alkaline partial dissolution and the soluble liquid that stayed afloat. The peaks at 2918, 2850, 1734, 1631, 1455, 1234, 1157 and 721 cm-1 indicate the presence of suberin’s aliphatic chains (2918 and 2850 cm-1), suberin ester groups (1734 cm-1), suberin’s R
1CH=CHR2 groups (1631 and 721 cm-1) and the presence
of lignin’s aromatic group (1508 cm-1) and lignin’s common fingerprint peak at 860 cm -1 as well as typical fingerprints of polysaccharides at 1157 and 1030 cm-1.
Figure 9: FTIR-ATR spectra of before and after the dissolution and centrifugation steps, showing the peaks associated with the main constituents of cork (Suberin, Lignin and
Polysaccharides).
The result of the alkaline dissolution is a monomer soup with insoluble components that can be separated with centrifugation. Figure 9 reveals a drop in the number of peaks after the dissolution. However, it is noticeable that apart from lignin, all main constituents of cork remain in both the solid and liquid phase of the centrifugation. The presence of lignin is only noticeable after the alkaline dissolution on the centrifugation solid phase due to its insolubility.
Figure 10 allows for the comparison of the influence of urea and centrifugation in the chemical structure of the electrolytic membranes. A peak at 872 cm-1, likely associated with lignin is visible on the membranes that were not centrifugated. It was previously noted that lignin is insoluble in the LiOH and urea solvent system, therefore the peak is absent on the samples that were centrifugated and had the insoluble phase removed. At 1615 and 1660 cm-1 there are peaks that only appear on the membranes developed with LiOH and urea, these peaks can be related to urea’s C=O and N-H stretching frequencies, respectively [40].
17
Figure 10: FTIR-ATR spectra of developed cork electrolyte membranes with 5 .wt% CMC, using a solvent system of with LiOH, urea and water as solvents (without centrifugation -a, and
with centrifugation -b) and just LiOH and water (without centrifugation -c , and with centrifugation -d).
4.3 Structural analysis of the cork-based electrolytes
X-Ray Diffraction (XRD) evidences a clear influence of the introduction of urea in the structure of the electrolyte membranes.
As shown in Figure 11, in the membrane samples with urea it is noticeable an amorphous halo pattern around 2 = 21º, this is characteristic to the presence of CMC [41]. However, the samples developed without urea in their solvent system develop a crystalline compound identified as lithium acetate dihydrate (C2H3LiO2•2H2O), with an
orthorhombic crystal system according to ICDD 00-023-1171.
Figure 11: XRD pattern of pre-treated cork powder and developed electrolyte membrane samples.
18
4.4 Electrochemical characterization of the cork-based
electrolytes
In this subchapter, the influence of the cork based-electrolyte’s formulation in the electrochemical properties of the resulting electrolyte membrane were tested taking into account the role of urea, CMC, and the influence of the centrifugation.
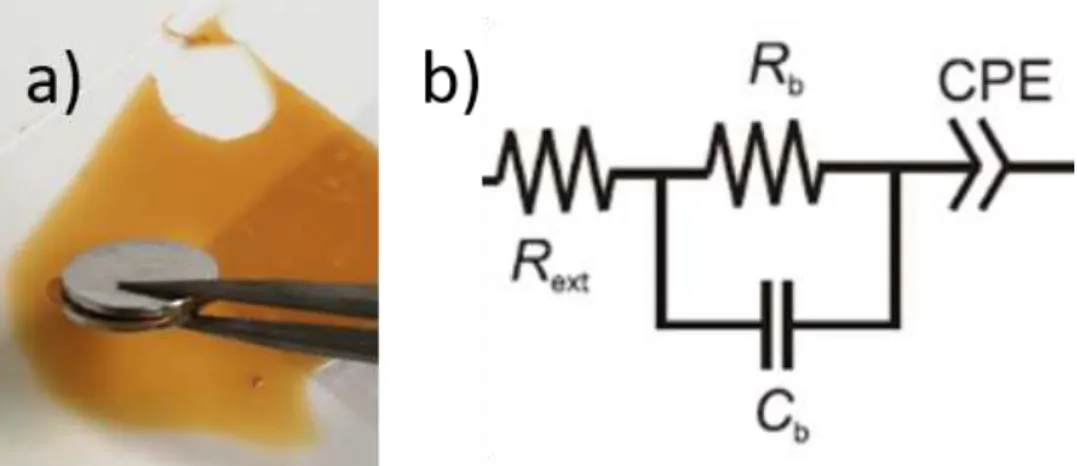
Figure 12: a) Set up used for the EIS and cyclic voltammetry measurements. The electrolyte is inserted between the two stainless steel discs with 1 cm2 b) Illustration of the corresponding
ECM suggested by Dasgupta et al. (adapted from [38]).
The electrolyte samples were inserted between stainless steel discs of 1cm2 as shown in Figure 12. The EDL capacitance and ionic conductivity parameters were calculated using the following Equations (5) and (6) [7], [42] and are listed in,Table 2
.
𝐶𝐷𝐿 = [𝑌0𝑅𝑒𝑥𝑡−(𝛼−1)]1/𝛼 (5) Where, 𝑌0 stands for the capacitance associated with the constant phase element
(CPE), 𝑅𝑒𝑥𝑡 is the contact resistance, and 𝛼 is a constant between 0 and 1 that represents
how well the capacitor behaves, 𝛼 = 1 stands for an ideal capacitor. 𝜎𝑖 =
𝑙
𝑅𝑏𝐴 (6)
Where 𝑙 represents the thickness of the electrolyte membrane, 𝑅𝑏 is the bulk
resistance of the electrolyte and 𝐴 is the surface area.
Figure 13 shows the capacitance (C) and phase angle () as a function of the frequency (ƒ) of the developed cork-based electrolytes. Table 2 contains the obtained parameters and represents the arithmetic mean of 4 runs per sample.
19
Figure 13: Capacitance (C) and phase angle () of cork-based electrolytes as a function of the frequency. The symbols account for experimental values, whereas the dashed lines define the
fitted data obtained through the ECM adapted from Dasgupta et al. [38]
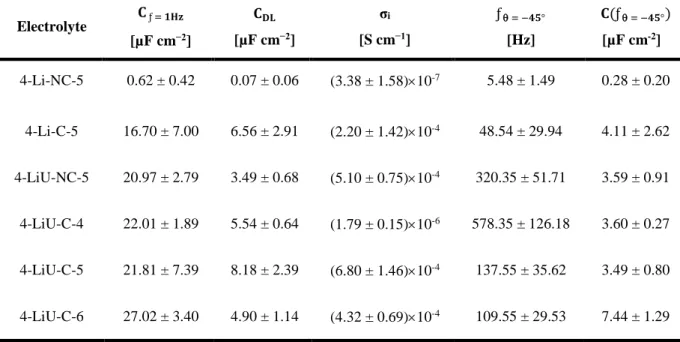
Table 2: Parameter results from EIS measurements on cork-based electrolyte.
Electrolyte 𝐂 ƒ = 𝟏𝐇𝐳 [µF cm−2] 𝐂𝐃𝐋 [µF cm−2] σi [S cm−1] ƒ = −𝟒𝟓° [Hz] 𝐂(ƒ = −𝟒𝟓°) [µF cm-2] 4-Li-NC-5 0.62 ± 0.42 0.07 ± 0.06 (3.38 ± 1.58)10-7 5.48 ± 1.49 0.28 ± 0.20 4-Li-C-5 16.70 ± 7.00 6.56 ± 2.91 (2.20 ± 1.42)10-4 48.54 ± 29.94 4.11 ± 2.62 4-LiU-NC-5 20.97 ± 2.79 3.49 ± 0.68 (5.10 ± 0.75)10-4 320.35 ± 51.71 3.59 ± 0.91 4-LiU-C-4 22.01 ± 1.89 5.54 ± 0.64 (1.79 ± 0.15)10-6 578.35 ± 126.18 3.60 ± 0.27 4-LiU-C-5 21.81 ± 7.39 8.18 ± 2.39 (6.80 ± 1.46)10-4 137.55 ± 35.62 3.49 ± 0.80 4-LiU-C-6 27.02 ± 3.40 4.90 ± 1.14 (4.32 ± 0.69)10-4 109.55 ± 29.53 7.44 ± 1.29
As presented in Figure 13 that illustrates the capacitive (< −45°) and resistive (> −45°) domains, the specific capacitances for = −45° associated with the frequency are very dissimilar among the different electrolytes revelling its dependency on the formulation. Besides, the phase angle seldom passed the -80º mark. The electrolytes without urea proved to be the less capacitive.
20
In Table 2 it is visible that 4-LiU-C-5 is the electrolyte that combines the highest ionic conductivity in the range of 10-4 S cm−1 and the highest CDL (8.18 ± 2.39 µF cm−2)
whereas the 4-Li-NC-5 electrolyte was shown to be the worst performing having a σi of
10-7 S cm−1 and CDL 0.07 ± 0.06 µF cm−2, this can possibly be explained by the presence
of a crystalline structure and insoluble compounds on the membrane that may impede the way for the motion of the ions. The specific capacitance were mostly in the 3-5 µF cm−2 range, having the 4-LiU-C-6 electrolyte (with the highest CMC .wt%) reached past the 7 µF cm−2 mark.
The chosen equivalent circuit model (ECM) was developed by Dasgupta et al. and as shown in Figure 14, the model fits the experimental data perfectly well through the entire frequency spectrum. Figure 12.b includes the resistance associated to the stainless-steel contacts (Rext), the bulk resistance (Rb) and capacitance (Cb) of the electrolyte [38].
The CPE symbolises the non-ideal capacitive behaviour due to interface inhomogeneities [14], which corresponds to the dome formed at lower angular frequencies for the Nyquist plot. An Ideal CPE would correspond to a vertical line from the first values of angular frequencies, meaning there is a perfect EDL formation without mass changes between the contacts.
Figure 14: Nyquist plot of a cork-based electrolyte (4-C-LiU-C-56), with a fitting ECM adapted from Dasgupta et al. [38].
Figure 15 shows the cyclic voltammogram of cork-based electrolytes, regarding their solvent system and whether they centrifugated, using different scan rates, performed in the ±2.5 V potential range. The increasing hysteresis for higher scan rates comes from the incomplete charging of the electrodes, as explained by Dasgupta et al. [38]. The presence of faradaic current is predominant as several peaks can be observed along the forward and backwards scans, which can be related to formation of crystalline structures.
21
The cork-based electrolytes developed with the lithium hydroxide and urea solvent system (LiU) exhibit larger current densities, in the order of 1.39 mAcm−2, for higher scan rates.
For these measurements, the same sample set up as in Figure 12.a was used.
Figure 15: CV measurements of the cork-based electrolytes using an applied potential from -2.5 to 2.5 V. The dashed lines correspond to a scan rate of 400 mVs−1 and the continuous lines to 50
mVs−1. The plots correspond to the fifth cycle of each measurement.
4.5 Electrical characterization of the electrolyte-gated
transistors
In this section, the proof of concept for the cork-based electrolytes will be carried out. Herein, the performance of the developed electrolytes applied to printed EGTs on a smooth cork surface will be studied, using a cellulose-based electrolyte developed by Cunha et al. and office paper as a means of comparison for assessing the electrical performance of the devices. All layers of these devices were deposited by screen-printing technique, apart from the electrolyte that was manually placed on top of the channel and gate electrode, as shown in Figure 16. The carbon contacts were deposited on top of the semiconductor layer.
The determined values for the with (W) and length (L) of the semiconductor channel are 890 ± 20.13 mm and 319 ± 27.42 mm on average, respectively. In Annex A is a figure with the geometry of the channel and a table with the considered number of samples for the determination of an average of L and W parameters.
22
Figure 16: Schematic representation of the EGT printed on top of a cork surface.
Table 3 shows a resume of the main electrical parameters obtained for the EGTs, including the turn-on voltage (𝑉𝑂𝑛), 𝐼𝑂𝑛/𝑂𝑓𝑓, transconductance (gm,(𝜕𝐼𝐷𝑆/𝜕𝑉𝐺𝑆)), subthreshold swing (𝑆𝑆) and saturation mobility( 𝜇𝑆𝐴𝑇). The electric measurements were
obtained in the forward sweep direction, from negative to positive gate voltage with VDS=
1.2 V and a scan rate of 50 mV s−1.
The specific 𝐶𝐷𝐿 of the electrolytes used is necessary to determine the saturation mobility. It was previously determined to be 8.18 µF cm−2 for the 4-LiU-C-5 electrolyte and 5 µF cm−2 for the cellulose (M4C4aa) electrolyte, determined by Cunha et al. [7].
Table 3: Results of the electrical characterization of the cork-EGTs in comparison to cellulose-EGTs, with specifications regarding the ETGs substrate and electrolyte used.
Cork smooth sheets have random irregularities and therefore are expected to be less efficient than other more uniform substrates. In this sense, office paper was used as substrate as well, providing a more uniform surface for the layers to be printed. Figure 17 shows 4th cycles off the transfer curves of the fabricated transistors on cork, using the developed cork-based electrolyte and the cellulose electrolyte developed by Cunha et al.
Substrate Electrolyte Von [V] Ion/Ioff VDS [V] gm [S] SS [Vdec−1] SAT [cm2V−1s−1]
cork sheet 4-LiU-C-56 1.0 1.41103 0.8 6.6610−6 0.27 0.41
cork sheet M4C4aa 1.2 9.52103 1.10 3.0310−5 0.09 2.23
office paper 4-LiU-C-56 0.9 4.47103 0.50 1.2010−4 0.31 10.18
office paper M4C4aa 1.2 1.20104 0.60 5.2010−5 0.11 2.51
23
Figure 17: Influence of the electrolyte used on the EGT and its substrate, on the transfer curve: cork-sheet on the left, office paper on the right.
The results in Table 3 and Figure 17 show the devices have a low operating voltage (<2.5 V) and a typical n-type behaviour. The Ion/Ioff ratio for the cork-based
electrolyte ranged to 3 orders of magnitude, whereas the cellulose-based electrolyte ranged a little higher, from 3 to 4 orders of magnitude. In terms of transconductance (gm), i.e. the output current change per unit of input voltage change (𝜕𝐼𝐷𝑆/𝜕𝑉𝐺𝑆), the cork-base electrolytes seem to behave rather better on a paper substrate than on cork. As for the cellulose devices, the transconductance remained almost the same for cork and paper substrates. High gm is desired for circuit design, allowing the maximum drain-source current to be achieved at lower operating voltages [6]. The devices exhibit a maximum gate leakage current in the range of 10−7 A.
Regarding the modulation of IDS with VGS it is observed that all devices present a
subthreshold swing (𝑆𝑆) inferior to 1 V dec−1, meaning the devices modulate more current with a lower VGS, reducing power consumption[6], [7], [14]. The cork-based
electrolytes vary between 0.27 and 0.31 V dec−1, and cellulose-based electrolytes between 0.09 and 0.11 V dec−1.
The saturation mobility of the cork-based electrolyte was significantly higher than that of the cellule-based electrolyte, having surpassed 10 cm2V−1s−1 when applied on paper EGTs. The low SAT values for the cork composite substrate is attributed to the
roughness of its surface and the challenges it presents to the printing technique adopted. The cork-devices show little hysteresis, which represents a fast response from the ions to the VGS. However there is still some noticeable hysteresis in all devices that can
be attributed to a combination of ion migration and charge trapping effects [43], [44]. Lower VGS scan rates give the ions enough time to diffuse into the semiconductor,
promoting electrochemical doping. Hysteresis can be observed as the difference in IDS
values for the forward and backward sweeps of the gate voltage (VGS) [44] and is
24
The biggest challenge faced during the fabrication of the EGTs was related to the screen-printing techniques used. The alignment of the semiconductor and contacts layers proved to be a difficult quest in the sense that to maximize the uniformity of the devices, it is not only required a steady and repetitive application of force and speed, but also precision of the eye to perfectly align the masks. Short-circuits were frequent in both cork and paper substrates. On paper, these short-cuts were mainly caused by the spreading of the ink through the fibres, whereas in the cork composite substrates, even though the surface is hydrophobic, it is also very irregular and defected. An automatic screen-printing station could be of use in the future for facilitating these hardships faced with manual screen-printing.
25
Chapter 5: Conclusions and Future
Perspectives
5.1 Final Conclusions
In this work the main objectives of giving a new life to the cork waste resulting from the cork’s transformation industry (20 .wt%) by functionalising the natural material into the electronics field, using mostly affordable and eco-friendly methods, as well as fabricating EGTs using cork composites as a flexible electric substrate and integrating the developed cork-based electrolyte were successfully achieved.
The functional cork material exhibited CDL values of more than 8 µF cm−2 and
ionic conductivity in the order of 10−4 S cm−1, just one order of magnitude shy of the cellulose-based electrolytes developed by Cunha et al. The fabricated EGTs worked successfully, staging Ion/Ioff ratios of 103, saturation mobilities (SAT) of more than 10
cm2V−1s−1 and transconductance (gm) of 10−4 S.
Using this unique material as a precursor, there were created flexible and stretchy electrolyte, still suitable for improvements.
5.2 Future Perspectives
Regarding cork and electronics, there is no publication available where the two subjects meet. So far, cork has been thoroughly studied, and already a few publications regarding “green” electronics and cost-effective production methods have been brought to light. Nevertheless, in this work it was possible to develop a cork-based electrolyte in the form of hydrogel. However, with the aim of improving the performance of the cork-electrolyte, their reliability and better understand their mode of operation, there are several aspects that come to mind and are worth considering for future work.
26
Since the cork-based electrolyte is the core of this work, its formulation deserves detailed attention. Starting with method for dissolving cork. Despite it being a rather pollutant method, other dissolutions relying on ionic liquids such as cholinium hexanoate, octanoate and decanoate, and 1-ethyl-3-methylimidazolium hexanoate have been carried out and have proven to be very effective at dismantling cork cells and isolating suberin molecules (58.3 .wt% suberin extraction yield). Even though the purpose of this work is to develop the electronic device with the most environmentally conscious drive possible, these methods can be more efficient, and the results in terms of constituent yields can be more precise. The compositional study of the monomer soup that results from the partial dissolution would also be of great interest.
Secondly, in order to obtain a solid electrolyte, the addition of a cross linking agent is necessary. Herein, a cellulose derivative (CMC) was used that provided mechanical properties such as stretchability, self-healing, stickiness and conformability. However, other polymer solutions are available. Either it be other cellulose derivatives or other synthetic polymers, different reagents with film forming properties can be utilised in order to amplify the desired mechanical properties of the electrolyte.
Also, the nature of the regeneration acid plays a vital role in the mechanical and chemical properties of the electrolyte. Already at Cenimat|i3E, different acids are being tested and the results can be distinguished as nearly different materials, changing in crystallinity, opacity, stiffness and stretchability, depending on the acid alone.
Atomic Force Microscopy could prove to be a viable technique to evaluate the roughness and homogeneity of the electrolytic membranes as well.
Finally, it would be pertinent to preform tensile test on the electrolytes in order to investigate the elastic behaviour of the device as well as to better understand the influence of the concentration of cork in the electrolyte’s elasticity. Another factor worth looking into is the influence of the concentration of cork in the transparency of the electrolytes, to which transmittance tests could provide some answers.
Regarding the fabricated EGTs, screen-printing proved once again to be a very reliable method to develop fully-printed contacts and semiconducting channels on EGTs, even though the permeability of the substrate and the rheological properties of the ink play a vital role in preventing short-circuits and ensuring a finely delineated device. Using an automatic screen-printing station would be very beneficial to the compliance and reproducibility of the fabricated EGTs, since the snap-off, shear rate, angle, geometry and squeegee pressure could be research and thus enabling an understanding of these factors on the device’s performance.
Other substrates could also allow the conformability of the electrolyte to be further investigated, as well as different geometries.
With the ensured electrochemical potential of these devices, the range of applications for which it would be suitable can go from energy storage devices, such as supercapacitors and batteries, to sensors in food packaging, electronic wearables, electrochromic displays and more.
27
Bibliography
[1] M. Irimia-Vladu, “‘Green’ electronics: Biodegradable and biocompatible
materials and devices for sustainable future,” Chem. Soc. Rev., vol. 43, no. 2, pp. 588–610, 2014.
[2] United Nations World Commission on Environment and Development, “Brundtland Report: Our Common Future,” United Nations, 1987. [3] S. H. Kim et al., “Electrolyte-gated transistors for organic and printed
electronics,” Adv. Mater., vol. 25, no. 13, pp. 1822–1846, 2013.
[4] S. Khan, L. Lorenzelli, and R. S. Dahiya, “Technologies for printing sensors and electronics over large flexible substrates: A review,” IEEE Sensors Journal, vol. 15, no. 6. pp. 3164–3185, 2015.
[5] L. Gil and I. P. R. Marques, “Cork wastes as energy sources.” 2013.
[6] S. J. Rubin, “Development of eco-friendly ZnO inks for paper-based printed electronics,” 2017.
[7] I. Cunha et al., “Reusable Cellulose-Based Hydrogel Sticker Film Applied as Gate Dielectric in Paper Electrolyte-Gated Transistors,” Adv. Funct. Mater., vol. 27, no. 16, 2017.
[8] R. Martins and and E. F. , I. Ferreira, “Electronics with and on paper,” vol. 335, pp. 332–335, 2011.
[9] M. H. G. and E. F. D Gaspar, S N Fernandes, A G de Oliveira, J G Fernandes, P Grey, R V Pontes, L Pereira, R Martins, “Nanocrystalline cellulose applied simultaneously as the gate dielectric and the substrate in flexible field effect transistors,” 2014.
[10] E. Fortunato, N. Correia, P. Barquinha, L. Pereira, G. Gonçalves, and R. Martins, “High-Performance Flexible Hybrid Field-Effect Transistors Based on Cellulose Fiber Paper,” vol. 29, no. 9, pp. 988–990, 2008.
[11] R. Martins et al., “Write-erase and read paper memory transistor,” pp. 2008– 2010, 2008.
[12] R. Martins et al., “Complementary Metal Oxide Semiconductor Technology With and On Paper,” pp. 4491–4496, 2011.
[13] R. F. P. Martins et al., “Recyclable , Flexible , Low-Power Oxide Electronics,” pp. 2153–2161, 2013.
28 73, 2015.
[15] J. Carvalho et al., “Fully Printed Zinc Oxide Electrolyte-Gated Transistors on Paper,” Nanomaterials, vol. 9, no. 2, p. 169, 2019.
[16] Associação Portuguesa da Cortiça, “APCOR – Social e Económica.” [Online]. Available: http://www.apcor.pt/montado/sustentabilidade/sustentabilidade-social-e-economica/. [Accessed: 08-Jan-2019].
[17] corkleathercompany.com, “Harvested Cork Removes Additional Carbon Dioxide – Cork Leather Company.” [Online]. Available:
https://www.corkleathercompany.com/blogs/blog/harvested-cork-removes-additional-carbon-dioxide. [Accessed: 28-Jan-2019].
[18] Corticeira Amorim, “O que é, A Cortiça - Corticeira Amorim, Líder Mundial Setor Cortiça.” [Online]. Available: https://www.amorim.com/a-cortica/o-que-e/. [Accessed: 07-Jan-2019].
[19] M. H. Lopes, A. S. Barros, C. Pascoal Neto, D. Rutledge, I. Delgadillo, and A. M. Gil, “Variability of cork from portuguese quercus suber studied by solid-state13C-NMR and FTIR spectroscopies,” Biopolym. - Biospectroscopy Sect., vol. 62, no. 5, pp. 268–277, 2001.
[20] S. P. Silva, M. A. Sabino, E. M. Fernandes, V. M. Correlo, L. F. Boesel, and R. L. Reis, “Cork: properties, capabilities and applications,” Int. Mater. Rev., vol. 53, no. 4, pp. 256–256, 2008.
[21] H. Pereira, “Chemical composition and variability of cork from Quercus suber L.,” Wood Sci. Technol., vol. 22, no. 3, pp. 211–218, 1988.
[22] “Cork Forest Conservation Alliance | Harvesting the Cork Oak.” [Online]. Available: http://www.corkforest.org/harvesting-the-cork-oak/. [Accessed: 22-Apr-2019].
[23] H. De Oliveira, B. Yoon, V. Michaud, J. Do Nam, and J. Suhr, “All natural cork composites with suberin-based polyester and lignocellulosic residue,” Ind. Crops
Prod., vol. 109, no. September, pp. 843–849, 2017.
[24] L. Gil, “New cork-based materials and applications,” Materials (Basel)., vol. 8, no. 2, pp. 625–637, 2015.
[25] P. C. R. O. Pinto et al., “Quercus suber and Betula pendula outer barks as renewable sources of oleochemicals: A comparative study,” Ind. Crops Prod., vol. 29, no. 1, pp. 126–132, 2009.
[26] H. Garcia, “Development of suberin films driven by an ionic liquid-based depolymerisation process,” 2013.
[27] R. Ferreira et al., “Suberin isolation from cork using ionic liquids:
Characterisation of ensuing products,” New J. Chem., vol. 36, no. 10, pp. 2014– 2024, 2012.
[28] N. Cordeiro, M. N. Belgacem, A. J. D. Silvestre, C. Pascoal Neto, and A. Gandini, “Cork suberin as a new source of chemicals. 1. Isolation and chemical characterization of its composition,” Int. J. Biol. Macromol., vol. 22, no. 2, pp. 71–80, 1998.
[29] A. F. SOUSA et al., “Novel Suberin-Based Biopolyesters: From Synthesis to Properties,” 2011.
[30] M. H. Lopes, C. Pascoal Neto, A. S. Barros, D. Rutledge, I. Delgadillo, and A. M. Gil, “Quantitation of aliphatic suberin in Quercus suber L. Cork by FTIR spectroscopy and solid-state13C-NMR spectroscopy,” Biopolym. -
![Figure 1: Obtained SEM image of untreated cork powder, and the harvesting of cork [22]](https://thumb-eu.123doks.com/thumbv2/123dok_br/15207688.1019012/24.892.136.761.127.350/figure-obtained-sem-image-untreated-cork-powder-harvesting.webp)
![Figure 3: Schematic representation of a suberin molecule [28].](https://thumb-eu.123doks.com/thumbv2/123dok_br/15207688.1019012/25.892.307.585.124.493/figure-schematic-representation-of-a-suberin-molecule.webp)