Equity Research
Inapa – Investimentos, Participações e
Gestão, S.A.
Bárbara Beleza Barreto
Student 152110318
Dissertation submitted in partial fulfillment of requirements for the degree of MSc in Business Administration, at the Universidade Católica Portuguesa, June 2012
2
F
Analyst: Bárbara Barreto
Source: Bloomberg
A mature company with a highly leveraged
story
Inapa is one of the largest paper distributors in Europe, assuming a leading position in terms of market share in several European markets. Following the industry trend, Inapa engaged in a consolidation process through acquisitions in order to reach new geographies and complementary businesses. Moreover, the considerable debt level drives financial costs up and eats up the end result. This does not allow the company to distribute dividends and thus contributes for the low attractiveness of this stock to investors.
Operations capitalized: In October of the last year the
company raised 54m€ of capital by issuing 300m preferred shares. Inapa’s weak operating performance has been affected by the increasing competition, low volumes and stumpy margins.
Feeble cash flow generation: Even though according to
forecasts, Inapa’s operating performance will improve due to the growth of complementary businesses and to the operating efficiency program took by the company, the cash flow generation is still weak.
Stock’s underperformance: Persisting with the obstacle of
stock liquidity, the stock presented a decrease of 63% in stock price during the year of 2011.
Inapa
Paper
Sell
June 2012
Portugal
Inapa vs. BenchmarkRecommendation: Sell
Share price: EUR 0,17
Closing price as 22-04-2012
Target price: EUR 0,11
Closing price as YE12
Market Cap (m€): 25,5
Outstanding shares (m): 150
52 Week range: 0,12-0,34
3
i.
Preface
This dissertation symbolizes the end of a hard working period in which I was challenged to apply my knowledge in Equity Valuation and encouraged to search for a greater and deeper understanding on this subject. I had the fortune to have people who throughout this process were always available and glad to help me clarify my doubts. To those people I would like to express my gratitude: to Professor José Tudela Martins for the support orientation, for the helpful feedback, for his constant availability to schedule meetings and for motivate me to always give a further step; to Dr. Hugo Rua, Inapa’s Investor Relations Officer, for all data and information provided, for his kindness when answering my infinite number of emails and for the relevant comments; to Professor José Filipe Correa Guedes for its availability and promptitude to help; to my colleagues of the major in Finance for the productive and constructive discussions; and to my family and friends for all the support given.
4
ii.
Contents
i. Preface ... 3 1. Introduction ... 6 2. Literature Review ... 6 2.1. Valuation ... 61.2. Key valuation models ... 7
1.2.1. Asset-Based Valuation ... 8
1.2.2. Discounted Cash Flow Models ... 9
1.2.3. Relative Valuation ... 20
1.2.4. Contingent Claim Models ... 22
1.3. The Model Choice ... 22
2. Company presentation ... 23 2.1. Business areas ... 24 2.1.1. Paper ... 24 2.1.2. Complementary businesses... 24 2.2. Shareholder structure ... 26 2.3. Performance indicators ... 26
2.4. Stock market performance ... 27
2.5. Risk factors ... 28
3. Industry overview ... 28
3.1. Paper and packaging segment ... 28
3.1.1. Production ... 28
3.1.2. Consumption ... 29
3.1.3. Prices ... 30
3.1.4. Competition ... 31
3.2. Visual communication segment ... 32
4. Valuation Methodology... 32
5. Valuation assumptions ... 33
5.1. Discount rates ... 33
5.2. Cash flow drivers ... 35
5.3. Operations, sales and costs ... 35
5
5.3.2. Provision of services and other income ... 36
5.3.3. Operational costs ... 37
5.4. EBITDA ... 39
5.5. Working capital ... 40
5.6. Investment policy ... 40
5.7. Taxes ... 42
5.8. Free cash flow projections ... 43
5.9. Debt analysis ... 44
5.10. Other balance sheet items ... 46
5.11. Tax shields... 47
5.12. Bankruptcy costs ... 48
6. Relative valuation ... 49
7. Small cap discount ... 52
8. Share price ... 52 9. Sensitivity analysis ... 53 10. Valuation comparison ... 55 11. Conclusion ... 57 12. References ... 58 13. Appendixes ... 62
6
1. Introduction
The purpose of this dissertation is to evaluate Inapa – Investimentos, Participações e Gestão, S.A., which is a Portuguese listed company. This evaluation will be translated into a buy or sell recommendation based on the market value of the shares.
The structure of the dissertation addresses the most relevant points in equity research and it comprises four main chapters: Literature Review, company and industry overview, equity valuation and valuation comparison.
In the Literature Review the main studies and publications on the business valuation models field will be presented, highlighting the main differences among methods and doing a deeper exposition of the methodologies used in Inapa’s valuation.
Then, there will be a company and industry’s analysis, in order to provide a deeper learning on the Inapa’s evolution, strategy, stock market performance and ownership as well as its operational performance. Moreover, industry and macroeconomic projections were also covered.
Afterward, a financial-economic model based on the Adjusted Present Value will be developed, explanations about the model choice will be given and assumptions will be clarified.
Finally, Inapa’s valuation will be compared with a recognized investment bank, which in this case will be BPI (Banco Português de Investimento). This comparison analysis’ objective is to understand the different sources of value and respective assumptions that can lead to different target values.
2. Literature Review
2.1. Valuation
Valuation is often entitled as the “heart of finance” (Damodaran, 2006). Its main purpose is to compare the value achieved with the stock market price so that analysts are capable of giving recommendations of whether investors must hold, buy or sell shares (Fernández, 2007).
Therefore, value and price must be understand as two different concepts, where the price represents the market price originated by demand and supply forces, and the intrinsic value, also called fundamental value, corresponds to the value that an analyst
7
with access to all information reaches when using a perfect valuation model. However, due to future uncertainty that can be perceived in the forecasted factors that compose the future cash flows, it is difficult to reach a single and true intrinsic value (Damodaran, 2006).
The demand for accounting research in investment decisions is directly affected by the degree of market efficiency investors believe being facing i.e. degree varies between strong, semi-strong and weak form according to the speed of price adjustment to news (Lee, 2001). (Lee, 2001) also affirms that prices adjust to the intrinsic value through a process rather than instantly – “Market efficiency is a journey, not a destination”.
Moreover, if strong market efficiency is assumed, valuation stops having a purpose. Over the last years, a vast number of valuation approaches have been developed, which lead analysts to a valuation overload problem. A solution purposed by (Young, Sullivan, Nokhasten, & Holt, 1999) is to understand that most valuation techniques end up by being mathematically equivalent. In addition, (Damodaran, 2006) recognizes that, even though valuation models may range from the simple to complex and different assumptions may be made, they do have several characteristics in common.
1.2. Key valuation models
As research in valuation is enormous, (Damodaran, 2002) and (Fernández, 2007) purpose a segmentation of the main valuation models into four groups with similar characteristics.
The Asset-Based Valuation computes the value of the firm’s assets using their current accounting estimates. The Discounted Cash Flow (DCF) estimates the value of an asset by discounting the asset’s future cash flows at the appropriate discount rate. The
Relative Valuation uses comparable firms’ common variables for instance, earnings,
sales or cash flows, in order to measure the value of an asset. And finally, the
Contingent Claim Models takes into consideration option pricing models to value
assets that contain option characteristics.
Furthermore, the distinction between enterprise and equity value models is addressed by (Young, Sullivan, Nokhasten, & Holt, 1999) .
8
Table 1: Key Valuation Models
Asset-Based Valuation
Discounted Cash Flow Models Relative Valuation
Contingent Claim Models Equity Valuation Firm Valuation Equity Valuation Firm Valuation
Liquidatio n value Book Value Adjusted Book Value Substantia l Value Dividends (DDM) Free Cash Flow to the Equity (FCFE) Free Cash Flow to the Firm (FCFF) Capital Cash Flow (CCF) APV Excess Return Models Free Cash Flow Yield EV/EBITDA EV/EBIT EV/Sales Dividend Yield Price to Earnings Ratio (PER) Price to Book Value Price to Cash Flow Ratio Black Scholes Investment option Expand the project Delay the investment Alternative uses
Source: Damodaran (2002) and Fernández (2007)
1.2.1. Asset-Based Valuation
As the name indicates this method seeks to determine the value of the firm’s stocks through the value of its assets. The idea is to focus mainly on assets in place and to value them separately in order to add its values in the end to reach the firm’s value (Damodaran, 2006).
1.2.1.1. Book Value
The company’s book value is characterized by the sum of capital and reserves, which is referred as the shareholders’ equity (Fernández, 2007).
The use of this approach avoids doing forecasts about the future which may be “shaky”. However, whenever we are facing a company with potential excess returns and growth opportunities this valuation may result in an underestimation of value (Fernández, 2007).
In addition, attempts to reach a fair value and to include future prospects have been done for instance, by including expected earnings in the book value calculation (Damodaran, 2006).
9
1.2.1.2. Liquidation Value
The liquidation valuation is often used in a particular situation in which the company is going to be liquidated immediately, its assets sold and its debt paid-off. Its value is reached by taking the expenses inherent to this process from the adjusted book-value (Fernández, 2007). Even though, theoretically this value should reach the same result of a DCF approach, the urgency associated to it may lead to a discount in value (Damodaran, 2006).
1.2.1.3. Substantial Value
On the opposite side, we have the substantial value that assumes the company continues to operate by valuing its assets’ replacement value. Thus, it can also be classified as the potential investment needed to build a company with identical conditions to the one being valued (Fernández, 2007).
1.2.2. Discounted Cash Flow Models
The DCF models seek to establish the value of the company by doing forecasts of its future cash flows and discounting them at the rate that properly reflects the cash flow riskiness.
Therefore, the value of the firm cannot be derived directly from financial statements but from expectations that can be interpreted as the future cash flows (Vélez-Pareja & Tham). In order to reflect this concept (Fernández, 2007) derived the following formula:
Where: = Cash flow generated by the company in the period i = Appropriate discount rate for the cash flows’ risk = Residual value of the company in year n
= Expected cash flows growth rate at the post-horizon period
The residual value, often called terminal value, can only be computed when the company reaches a steady state. In other words, a state where the growth is considered
10
to be stable and where the firm characteristics match this requirement. This fulfillment depends for instance, of the reinvestment rate used to compute the cash flows. In addition we will be facing a constant cost of capital and consequent constant debt ratio. Furthermore, (Damodaran, 2006) states that the growth rate applied in the model has to be lower than or equal to the economy growth rate.
To understand the exact point when this steady state is reached is a really important task so that an accurate estimation of the terminal value can be done since it has a big weight in the company’s total enterprise value. (Young, Sullivan, Nokhasten, & Holt, 1999), found that its importance in the total value varies from 75% to 99% depending on the number of explicit period years and cost of capital used.
The enterprise-value formula, described above, embodies the basis for all discounted-cash flow approaches since they differ in the discounted-cash flow level of risk and thus a different discount rate has to be applied.
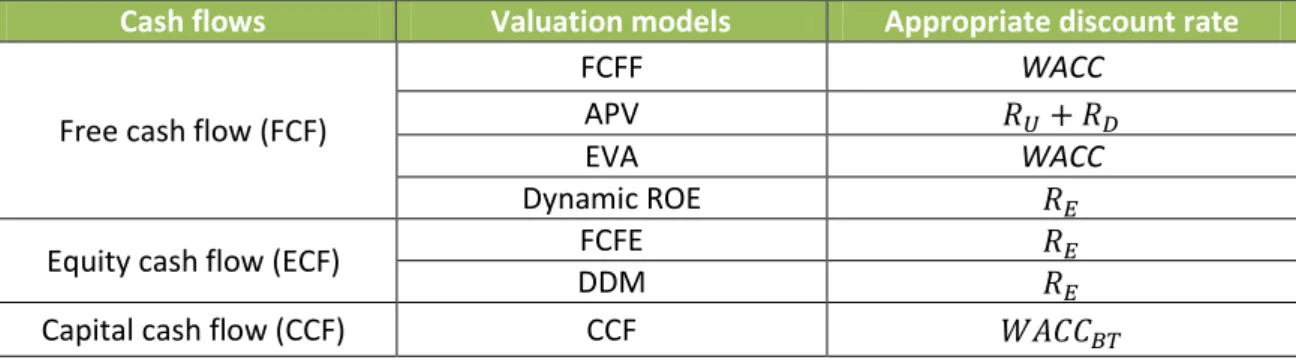
Table 2: DCF models' discount rate
Cash flows Valuation models Appropriate discount rate
Free cash flow (FCF)
FCFF WACC
APV
EVA WACC
Dynamic ROE Equity cash flow (ECF) FCFE
DDM
Capital cash flow (CCF) CCF
1.2.2.1. Firm DCF Models
The Firm DCF models value the whole business considering both assets in place and growth assets, which provide investment return and the FCFF, the APV and the Excess Return models will be further developed.
1.2.2.1.1. FCFF – Free Cash Flow to the Firm
The FCFF model discounts the cash flows available to all investors – cash flow before debt repayments and reinvestment needs – at the discount rate that reflects the equity and debt side of financing, which is the cost of capital (WACC). Thus it is independent of capital structure.
In addition the FCFF is computed in the following way:
11
Where: t = tax rate
Capital expenditures
Moreover, the tax benefits of debt are being integrated in two different ways. Initially when using the after-tax cost of debt to the cost of capital computation. Moreover, it is also reflected in the cost of equity, since whenever higher debt levels are considered equity holders demand higher rates of return in order to reward the lack of priority in cash flow claims in relation to the debt holders.
Even though this model returns the enterprise value, it is also possible to get the equity value through the process of incorporating the value of non-operating assets – assets which earnings are not included in the net income such as cash, marketable securities and minority interests - and subtracting the value of all non-equity claims. Besides all debt, these non-equity claims contain, the capitalized leases, unfunded pension plans as well as health care obligations.
1.2.2.1.1.1. The cost of capital
The cost of capital is no more than the weighted average of all the financing components used by the firm that can include debt, equity and hybrid securities. The computation of the WACC requires the values for the risk-free rate, equity risk premium and levered beta. Therefore, the famous risk-return model– CAPM - that defines the expected return to equity holders based on the non-diversifiable risk (beta) can be used. The formula that links the CAPM to the “real world” is given by the single index model in the form of:
Where: = Cost of equity = Risk-free rate = Tax rate
(Modigliani & Miller, 1963) assume that the firm keeps its debt-to-value ratio constant and that the WACC can be computed in the following way:
12
Where: = Cost of debt
The WACC-based models face an obstacle of implementation when the firm’s debt-to-value ratio varies. With the aim of overcoming this barrier, two different assumptions were developed: Milles & Ezzel focused on the fixed-market value debt ratio; while Harris & Pringle on the case where the company adjusts its debt ratio continuously. However I will not focus on these ideas and I will follow the recommendations from (Koller, Goedhart, & Wessels) to use the APV in such cases – which I will approach in the next section of this dissertation.
1.2.2.1.1.2. The Beta
The beta estimation is the biggest obstacle in the use of the CAPM model. The beta itself represents the level of exposure to systematic risk, i.e. the one that is not possible to diversify.
Furthermore, it is also a measure of relative risk since it expresses the exposure to non-diversifiable risk in relation to all market securities. However, as it is not possible to find an efficient portfolio (with no diversifiable risk) that represents the market as a whole, the use of “market proxies” as solution appeared. The most common market proxy used is the S&P500, the question lies on whether the S&P500-related beta is bigger or smaller than the “real” beta. (MacQueen) argue that the error estimation is not enough to be materialized and that without the presence of a reasonable alternative there is no point for not using market proxies as our benchmark.
On the other hand, (Rosenberg & Rudd) point out the importance of non-traded assets, for instance projects, bonds, real estate and human capital whose are not reflected in the S&P500 index.
Regarding the beta measurement, it has been estimated by using a regression of the historical stock prices of the company with the market returns movements of the market proxy. As only the already publicly-traded companies have access to historical prices, the private companies will have to use the average beta of 1.0., i.e. investors expect the average return.
(Rosenberg & Rudd) propose that the beta movements are correlated mainly with four factors described in the table above:
13
Table 3: Predictors' correlation with beta
Predictors Correlation with beta
Growth +
Earnings Variability +
Financial Leverage +
Size -
Source: Rosenberg and Rudd
In addition, there are considerable differences in betas between industries. Analysts usually argue that these differences lie on the balance sheet characteristics and thus on the company capital structure. However (Rosenberg & Rudd) state that it is only related to the business risk. Furthermore, Damodaran made use of these differences to assign a level of risk to each different industry.
1.2.2.1.1.3. The Equity Risk Premium (ERP)
The return a company may expect to receive from another investment with the same level of risk is called, the opportunity cost, which entails two different components: time value and risk premium. The risk premium is the excess return of a diversified portfolio that can be earned by bearing a certain level of risk (Luehrman, 1997). In addition it can be determined by the “investor risk aversion, information uncertainty and perceptions of macroeconomic risk” (Damodaran, 2012).
The most used approach of estimating ERP is the use of average historical returns. Though, (Damodaran, 2012) found some limitations concerning countries with no historical data available, which is the case of emerging markets. As a solution the author developed two approaches, the survey approach, where it is asked directly to managers and investors their perceptions about the ERP value and the implied approach from where one can take the current equity prices to do the estimation. (Fernández, Aguierramalloa, & Correa, 2011) ran a survey with 6.014 answers on required equity risk premium perceptions about 54 countries. The answers were provided by professors, analysts and managers.
In practice, the ERP used ranges between 3.5 and 10 percent (Fernández, 2006). However, the use of historical data as a predictor generates a 6 percent ERP (Rosenberg & Rudd). Moreover, the country risk premium is many times added to the equity risk premium estimation as a way of reflecting the risk inherent in having the companies’ operations in a certain country.
14
1.2.2.1.1.4. The Risk-free Rate
The risk-free rate is the time value component of the opportunity cost referred above. Moreover in a risk-free investment, the actual return is always equivalent to the expected return. The importance of the risk-free rate in valuation lies on the cost of equity and cost of debt estimation.
In order to do a correct assessment of this rate two basic conditions must be fulfilled: there can be neither a default risk nor a reinvestment risk (Damodaran, 2008). The compliance with these criteria leads to the use of government zero-coupon bond rates as risk-free rate.
The decision of whether to use short or long term government bonds depends on the duration of the cash flows under valuation and usually a match of both is done. Thus, when perpetuity is beneath observation, the use of 10-year government bonds is suggested.
Furthermore, whenever long-term government bonds are not traded or when it had some default risk associates, problems in the risk-free estimation arise. Hence (Damodaran, 2008) proposes in the first case exchanging the currency into one that does not face this problem or the usage of forward market and fundamentals. In the second case the suggestion is to deduct the default spread from the risk free rate - value that can be found in default spread’s table developed by credit rating agencies, i.e. Moody’s, Standard&Poor’s.
1.2.2.1.1.5. The Cost of Debt
The cost of debt is one of the WACC’s building blocks and little research had been done on this topic. Usually this building block is addressed by taking the promised yield on the newest debt issued and using it as the cost of debt. However this approach may be overestimating both the WACC and the cost of debt whenever the debt repayment is not free of risk, with the exception for highly graded companies. In this way, the cost of debt should be discounted of any “expected default loss”, which depends directly of the firm’s probability of default (Cooper & Davydenko, 2007).
15
Cost of debt = Promised yield – Yield equivalent of expected default loss
Moreover, (Cooper & Davydenko, 2007) add that this method may lead to biased results due to its disability of capture specific information from the firm and market.
1.2.2.1.2. APV – Adjusted Present Value
As it is accepted by a vast majority of authors, the adjusted present value comes as a solution to the weaknesses associated to the use of simply accounting criteria in valuation (Fernández, 2007).
The idea behind this discounted cash flow method is to evaluate separately the cash flows from debt financing and from the operating assets, rather than include the leverage effects directly in the cost of capital value.
APV = Present Value of Total Free Cash Flows + Present Value of Financial Costs and Benefits
Every time a company decides to fund its operations with debt it is appropriating a tax benefit associated to the tax deductibility of interest expenses. However, on the down side, as the level of debt increases the risk of bankruptcy also does.
Moreover the APV is characterized for being a very versatile method that helps managers to explore the origin of the values by discriminating its components separately – “the APV is exceptionally transparent” (Luerhman, 1997).
In order to perform this analysis one can start by valuing the company as it was all equity-financed by taking the free cash flow to the firm and discounting it at the unlevered cost of equity. The second step is known by having a big source of controversy, which is the tax shields estimation. Finally the probability of bankruptcy and cost of financial distress are estimated (Damodaran, 2006).
1.2.2.1.2.1. Tax shields
The source of debate appears at the time of defining the discount of rate of the tax shields. (Modigliani & Miller, 1963) were the first authors taking into account this benefit from debt financing and they propose to discount the tax savings at the risk-free rate whenever the requirement of no growth is fulfilled.
16
In addition, Harris and Pringle recommend the use of the unlevered cost of equity (Ru) as discount rate since they state that the interest tax shields have the same systematic risk as the firm’s underlying cash flows.
Later on, Myres, (Luerhman, 1997), (Damodaran, 2006) offered a different perspective of assessing the risk of the tax saving cash flows has as risky as debt and so discounting it at the cost of debt. However, (Luerhman, 1997) says that tax shields are a somewhat more uncertain than interest payments and principal, which leads to the suggestion that the discount rate used should be higher than the cost of debt.
Moreover, Miles and Ezzell (1980, 1985) suggest the use of two different discount rates, the cost of debt for the first year and the unlevered cost of equity for the following years.
While all these authors focused either on a fixed market-value leverage ratio or on a continuously-adjusted leverage ratio, (Fernandez, 2007) suggests that firms define as a target a fixed book-value leverage ratio. This approach is supported by the following facts: the company is more valuable; book-value ratios are the main hub of credit rating agencies; debt level is independent of stock market movements and it is easier to follow companies that are not quoted in the stock exchange market. Under this approach the use of cost of equity as discount rate is proposed.
In summary, the tax shields estimation depends on the debt policy adopted by the firm.
1.2.2.1.2.2. Bankruptcy costs
(Damodaran, 2006) was the first to propose the deduction of the expected bankruptcy costs in the value of the firm. These costs represent from 10% to 25% of the firm value and can be classified either as direct or indirect. The direct costs are associated to the lawyers’, auditors’ fees, while the indirect costs can appear due to higher costs of financing or even as a result of bad reputation that can lead stakeholders – customers, employees, suppliers and lenders - to be resilient in not doing business with the company. However, the appearance of collateral helped minimizing the problem of credit rationing for companies with high probability of costly bankruptcy (Wang, 2000). The problem of the estimation of these bankruptcy costs appear through the difficulty of knowing the cost itself and its probability of occurrence since the following equation is true:
17
PV (Expected Bankruptcy Cost) = (Probability of Bankruptcy).(PV Bankruptcy cost) One of the approaches suggested by (Damodaran, 2006) in order to reach the probability of bankruptcy is to “estimate a bond rating, at each level of debt and use the empirical estimates of default probabilities for each rating”. This bond rating is estimated according to the interest coverage ratio. However, (Hilscher & Wilsony, 2012) believe credit ratings by themselves are not capable of assessing the default risk. They state that credit ratings are a systematic risk measure which is “economically distinct from long-run idiosyncratic default risk”
Moreover, several authors tried to estimate the costs associated to the default occurrence. (Lewis, 2008) said that these costs represent 15,6% of the firm value in an ex-post view and 1,4% in a ex-ante approach.
(Korteweg, 2007) purposes a more customized analysis of the bankruptcy costs by the type of industry and associates different costs for different capital structures.
1.2.2.1.2.3. APV vs. WACC
One of the most discussed themes in valuation is whether to use the APV or the FCFF. APV is characterized by (Luerhman, 1997) as being a less restraining model than the FCFF since it works every time the FCFF does and even when it does not, more precisely in variable capital structure situations. In addition, the managerial instrument that comes associated to this method, due to the understanding of the value sources, is seen as a plus point.
Moreover, when high leverage transactions, i.e. leverage buy-outs, recapitalizations, are being evaluated, the APV is also considered to be the best approach (Arzac, 1996). (Sabal, 2007) added that the APV must be used when tax legislations include high taxes for non-corporate profits and whenever emergent markets are being considered due to the opportunistic feature of leverage in these countries.
Regarding the present value of the tax shields computed in the APV approach, there is no need to chose a single and constant tax rate, as in the WACC approach, since the tax shields are obtained period-by-period which can be seen as more realistic (Sabal, 2007). Supporting the WACC-based models side, it is still the most convenient method for discounting the perpetuity and when a target capital structure for the long term is defined. Furthermore, the APV faces other limitations such as not being the most
18
appropriate method for project valuations (Damodaran, 2006). Another situation where the APV may introduce some bias in the analysis is when there is income from stocks, since they can be taxed at the different rate if the investor records it as a personal tax return, overestimating the net advantage of borrowing.
However the results from the two methodologies can converge in a situation where the cash flows are perpetuities, a single and constant tax rate is applied and where a fixed debt-to-value ratio is found (Sabal, 2007).
1.2.2.1.3. Excess Return Models
Excess return models basic feature is the separation of returns into normal and the ones that exceed or beneath the cost of capital. This characteristic allows analysts to know whether the company is creating or destroying value.
Moreover, these models are capable of reaching similar values of the discounted cash flow model if similar assumptions about growth and reinvestment are done (Damodaran, 2002).
1.2.2.1.3.1. EVA – Economic Value Added
The Economic Value Added measures the excess return generated by an investment or by a set of investments. In addition, the building blocks needed for its computation are the return on capital, the cost of capital and the capital invested, all on the investments that are being analyzed (Damodaran, 2002).
EVA = (Return on Capital Invested – Cost of Capital) (Capital Invested) = After-tax operating income – (Cost of Capital) (Capital Invested)
In this way, it is simple to understand that the economic value added is a simple expansion of the net present value method.
1.2.2.1.3.2. Dynamic ROE
The dynamic ROE follows the same principles as the EVA with the difference that is focused on equity values, allowing to know whether the company is creating value for shareholders (Damodaran, 2002).
19
1.2.2.2. Equity DCF Models
The equity discounted cash flow models have the advantage of valuing directly the firm’s equity value without having to do adjustments for “non-operating assets, debt or capitalized operating leases” (Koller, Goedhart, & Wessels).
1.2.2.2.1. FCFE – Free Cash Flow to the Equity
The Free Cash Flow to the Equity model discounts the cash flows from assets after debt repayments and reinvestment needs at the cost of equity, instead of using the weighted average cost of capital.
FCFE = Net Income + Depreciation - Capital Expenditures – Change in non-cash - Working Capital – (New Debt Issued – Debt repayments)
Moreover in order to use the FCFE model to value a listed company, strong corporate governance is required due to the fact that stockholders will be more aware about the cash available for dividends and may put pressure under management.
The obstacle in the use of this method appears when debt levels are expected to change over time since the estimation of debt repayments and new debt issues may become difficult. Thus, in these cases (Damodaran, 2006) recommends the use of the FCFF model where these issues do not exist as it is a pre-debt cash flow.
1.2.2.2.2. DDM- Dividend Discount Model
The Dividend Discount Model computes the value of the company by discounting the value of expected dividends at the cost of equity. In order to find the value for expected dividends a big concern has to be addressed, which is to delineate the assumptions about payout ratios and earnings’ future growth rates (Damodaran, 2006).
This method is frequently seen as attractive to investors due to the high tangibility of dividends when compared to other type of cash flows. Another important point in this valuation technique is the fact that dividends present a positive correlation with stock market movements (Pourheydari, Aflatooni, & Nikbakhat, 2008).
However, this approach may reach to overestimated results in situations where companies decide to hold cash that was available for stockholders or even in the reverse
20
circumstance where companies fund themselves to distribute dividends (Damodaran, 2006)
1.2.3. Relative Valuation
Relative valuation is a very popular and simple method in equity valuation. Under this approach one can value an asset based on the essential concept in economics where perfect substitutes should be sold for the same price (Baker & S.Ruback, 1999).
Even though (Young, Sullivan, Nokhasten, & Holt, 1999) describe it more as a guide to investor’s short-term willingness to pay, the authors recognize it can be used as a highly regarded valuation approach. Furthermore, this method is often seen as a complement of the discounted cash flow technique with the purpose of improving the level of accuracy in the DCF forecasts (Goedhart, Koller, & Wessels, 2005).
Moreover, when used separately, the discounted cash flow and the relative valuations results may converge if the market is correct. Thus, when using multiples one is relying on the markets to estimate the intrinsic value and the difference between the two methods comes from the level of market efficiency (Damodaran, 2006).
However, as any valuation approach, it presents three main implementation challenges according to (Baker & S.Ruback, 1999): determining the basis of substitutability i.e. value drivers; measuring the multiple and choosing a set of comparable companies. Different value drivers yield different performance levels. (Liu, Nissim, & Thomas, 2007), (Lie & Lie, 2002) and (Goedhart, Koller, & Wessels, 2005) had been studying whether PER multiple outperforms enterprise-value multiples, although no consensus had been reached.
Moreover when forecasting is taken into account, it is widely reported that performance improves, meaning that forward multiples outperform trailing multiples. (Kim & Ritter, 1999) obtained more accurate valuations in IPOs processes when using PER multiples based on forecasted earnings than when using trailing earnings multiples.
Furthermore, whenever analysts want to compare companies in different markets, the PEG ratio is usually applied, where the PER is divided by the expected growth rate in earnings per share (Damodaran, 2006).
Whenever the industry average is used to estimate multiples, the fact that companies present different prospects for growth, for returns on invested capital and capital structure is being disregarded (Goedhart, Koller, & Wessels, 2005). As a solution,
21
(Baker & S.Ruback, 1999) purpose the use of a harmonic mean, as a way of fighting the overestimation in value caused by the simple mean.
The choice upon the peer group should be based on finding companies with similar cash flows, growth expectations and risk, that may belong or not to the industry where the company fits (Damodaran, 2006). However, (Alford, 1992) observed that comparable firms chosen on an industry basis have smallest estimation errors when using the P/E multiple.
In the end of the screening process, it is possible to reach a peer group as small as one (Goedhart, Koller, & Wessels, 2005).
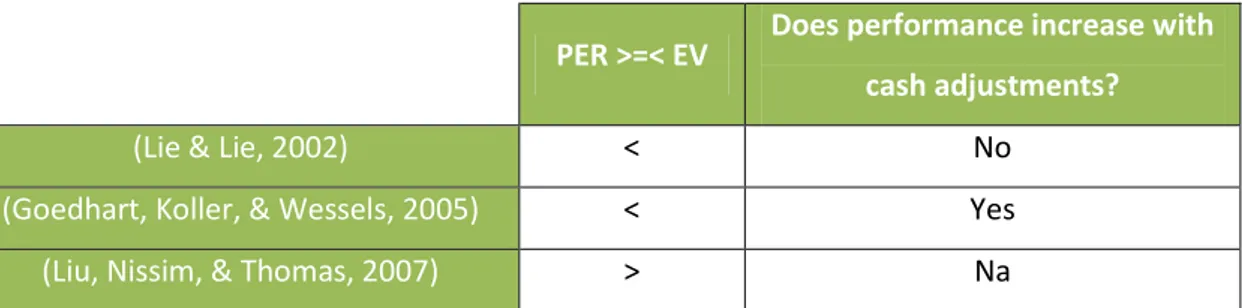
1.2.3.1. PER vs. Enterprise-Value Multiples
As it was referred above, the comparison between PER and enterprise-value multiples’ performance had been target of discussion among several authors and a summary of the conclusions can be seen below:
Table 4: PER and EV performance conclusions
PER >=< EV Does performance increase with cash adjustments?
(Lie & Lie, 2002) < No
(Goedhart, Koller, & Wessels, 2005) < Yes
(Liu, Nissim, & Thomas, 2007) > Na
Source: Lie & Lie (2002), Goedhart, Koller & Wessels (2006) and Liu, Nissim & Thomas (2007)
(Lie & Lie, 2002) and (Goedhart, Koller, & Wessels, 2005) concluded that asset based multiples usually produce more accurate and less biased estimates than sales and earnings multiples. The authors argue that multiples based on earnings, as it is the case of the PER, are easily manipulated due to changes in capital structure.
In addition earnings may include non-operating items, for instance write-offs and one-time events, which can lead to ambiguous conclusions if no adjustments are done. The superiority of enterprise-value multiples is claimed due to the fact that both equity and debt are valued and thus are less vulnerable to changes in capital structure. However, (Goedhart, Koller, & Wessels, 2005) still purposed the adjustment of these multiples for excess cash and other non-operating items, operating leases, employee stock options and pensions. (Lie & Lie, 2002) do not share the same opinion since the
22
authors argue that there are no improvements in the value estimates resulting from an adjustment of companies’ cash levels.
On the other hand, (Liu, Nissim, & Thomas, 2007) defend a completely different position from the previous authors, stating that multiples based on forecasted earnings outperform multiples based on EBITDA and book values. Moreover, the authors analyzed the effects of adding depreciations and amortizations to earnings, resulting in an operating cash flow value driver, and concluded that performance diminishes when comparing with EBITDA. EBITDA limitations of not considering working capital requirements or capital expenditures can help understanding this position.
1.2.4. Contingent Claim Models
The contingent claim valuation allows to take into account flexibility and it is especially important for projects that have a high level of uncertainty and opportunities associated (Copeland & Keenan, 1998).
This tool is also an important component in the business decision-making, since it is used to decide whether and how to explore an opportunity, for instance, in R&D investments decisions (Luehrman, 1997).
(Copeland & Keenan, 1998) define a number of situations that are capable of generating real options in order to help analysts recognizing them. Even though the pulp and paper sector is included in this list this method will be not used to value Inapa since the “timing of forest harvesting” does not have a big impact in a paper distributor as Inapa.
1.3. The Model Choice
Empirical evidence shows that financial analysts choose their valuation methodologies according to: industry characteristics, familiarity with a valuation model and its acceptability to clients. Moreover, the choice usually lies between the PER multiple, which is broadly used, and an explicit multiperiod DCF method. However, there are still analysts who select the comparative valuation model as their favorite model (Demirakos, Strong, & Walker, 2004). Furthermore, the decisions upon the valuation models selected to evaluate Inapa’s share price, and the assumptions inherent on it will be explained along the dissertation.
23
2. Company presentation
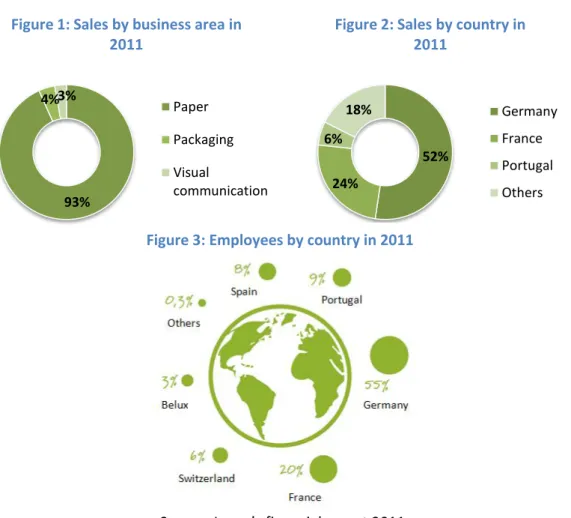
Inapa - Investimentos, Participações e Gestão, S.A is a company whose operations are driven by the paper sector. Its core business is paper distribution, a market in which it is the fourth biggest European player. Although the company was founded in 1965 as a paper producer, since 2000 it has focused only on the distribution activity, letting companies like Sappi, Storaenso, Portucel/Soporcel, M-Real, Lecta, Burgo, and UPM be responsible for the production. In 2007 the company decided to expand its business to the areas of packaging and visual communication, which implementation could take advantage of synergies and complement the offer of the company by turning it into a “full service provider”. Even though these are recent areas, they are already contributing to the company’s results and a big future growth is expected.
Moreover, Inapa’s profile is characterized by the large amount of acquisitions it pursued since the 1970’s, which led the company to a top position in the European market. The company operates in Portugal, Spain, Germany, France, Switzerland, Luxembourg, Belgium and Angola, although only the first five countries are considered to be the core markets (see appendix 1).
93% 4% 3%
Figure 1: Sales by business area in 2011 Paper Packaging Visual communication 52% 24% 6% 18%
Figure 2: Sales by country in 2011
Germany France Portugal Others
Figure 3: Employees by country in 2011
24
2.1. Business areas
2.1.1. Paper
Inapa’s core business is the sale and distribution of paper products to the graphic industry, editors, enterprises and offices. The company offers 12.000 paper references and its paper type assortment is mainly divided into: coated, offset, cutsize, digital, cardboard and carbonless. With almost one million tons sold every year, the company presents a 50% share in the Portuguese market. In Spain, it recently became the third player in the market with the acquisition of EBIX, holding now 20% market share. In what concerns the countries with the biggest weight in the company’s sales composition - France and Germany - Inapa lines the second and third place, respectively. Moreover, Inapa has 300 trucks in circulation per day and a 180 thousand square meters storage area that allows the company to do more than 5000 deliveries a day in less than 24 hours.
The acquisition processes pursued by the company led it to enjoy even bigger economies of scale and thus take advantage of a higher bargaining power over producers, which is important due to the big impact producers’ prices can have on its margins. In addition, the important role that Inapa played in the consolidation of the European paper merchant market took the company to the top three largest players among its five core markets.
The group is seen as a reference service provider to the graphic segment due to its deep knowledge of the paper industry and expertise in logistics. Inapa increased its product range outside the paper category through the offer of graphics supplies like paints, cleaners, additives, printing blankets, sheets and coatings, among others. These new offers, combined with the technical advice provided by the company as a service to its 70.000 clients, contribute to the “full service provided” status owned by the enterprise.
2.1.2. Complementary businesses
The analysis of the complementary businesses as a whole informs that one of the main reasons this segment plays such an important role in the company is the fact that they enclose higher margins than the paper segment and thus will have a positive impact in the company’s profitability.
25
2.1.2.1. Packaging
The packaging segment enjoys of a logistic model that is very similar to the one found in Inapa’s core business. In addition it offers the supply and distribution of solutions and packaging materials. Inapa not only added to its product range boxes, movies, braces, fillings, ribbons, bags, stickers and machinery, but it went further by including a customized packaging service as well as fulfillment and logistic services.
Moreover, it is the complementary business that is contributing the most to the company’s results, representing 5,1% of EBIT. This area already counts with 90 workers and the sales have registered a double-digit growth over the last years.
The sector’s growth potential is characterized by the high fragmentation and increasing need for “safe and versatile packaging”. Despite the area’s potential, the packaging segment is only present in Germany, France and Portugal.
However, in 2011 the company took advantage of the highly fragmented market and engaged in the acquisition of 100% of Semaq, which is a French company based on the packaging business that presents an increase in sales potential of 10,9 Million Euros.
2.1.2.2. Visual Communication
The Visual Communication, also known as Viscom, distributes a full range of products and services to one of the most dynamic markets in the printing industry. Its offers go from the large format digital printing to the flatbed printing so that the company is capable to reach different publicity segments (e.g. outdoor) inside visual communication. Moreover, the company goes beyond the materials that are printed by also selling printers, inks, toners, software and their technical support. This segment has 57 employees, contributed to 4,5% of EBIT in 2011 and its sales are growing 9% a year. In addition, the increasing weight in the company’s EBIT results from the low market coverage since this segment is only present in Germany.
26
2.2. Shareholder structure
Inapa’s ordinary shares with voting rights are entitled of 52,96% of the share capital that is divided according to the figure on the side, which means that the company’s free float represents 47,04% of the share capital.
Source: Inapa’s financial report 2011
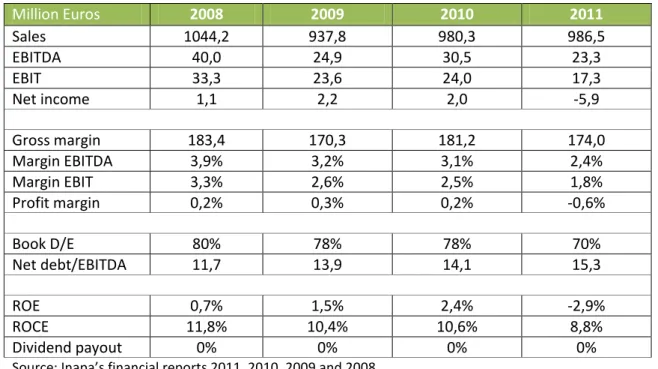
2.3. Performance indicators
Table 5: Performance indicators
Million Euros 2008 2009 2010 2011 Sales 1044,2 937,8 980,3 986,5 EBITDA 40,0 24,9 30,5 23,3 EBIT 33,3 23,6 24,0 17,3 Net income 1,1 2,2 2,0 -5,9 Gross margin 183,4 170,3 181,2 174,0 Margin EBITDA 3,9% 3,2% 3,1% 2,4% Margin EBIT 3,3% 2,6% 2,5% 1,8% Profit margin 0,2% 0,3% 0,2% -0,6% Book D/E 80% 78% 78% 70% Net debt/EBITDA 11,7 13,9 14,1 15,3 ROE 0,7% 1,5% 2,4% -2,9% ROCE 11,8% 10,4% 10,6% 8,8% Dividend payout 0% 0% 0% 0%
Source: Inapa’s financial reports 2011, 2010, 2009 and 2008
For a better understanding of the company’s performance over the years, the table above is presented with the main indicators. The year of 2011 registered the worst profitability and debt levels of the last four years.
The increasing contribution of the complementary businesses to the company portfolio is reflected on the increasing sales level. However this improvement came with an increase in the operational costs which were not managed in the most efficient way.
93% 4%
3%
Figure 4: Shareholder structure
Parpública – Participações Públicas SGPS, SA
Millennium BCP
27
Despite the effort done by the company to decrease its financial costs until 2010, in the year of 2011 there was an increase of 9% in this item, which led to a negative net income in this year. The decrease in the debt ratio was caused by a capital increase done by the company for this effect, but further information will be given on this topic in other section of the dissertation. In addition, the company presents alarming net debt/EBITDA levels, which are above the industry average. This may suggest that the company may not be able to service its debt. Moreover, the company had not been paying any dividends and it expects to keep this policy until have its financial structure stabilized.
2.4. Stock market performance
Inapa entered PSI 20 Index in 2010, although it only stood there for one year since it left the index in 2011. The fall in the number of shares traded in 2011 was a consequence of this fact, given that the company’s exposure in the market diminished.
The outstanding shares prices registered a
fall of 63% in 2011 when compared with 2010, from 0,375 Euros to 0,14 Euros.
Source: Bloomberg 185.503 349.400 78.439 26.932 2008 2009 2010 2011
Figure 5: Outstanding shares traded (Thousand shares)
Figure 6: Inapa’s prices evolution
28
2.5. Risk factors
Inapa is exposed to the risks associated to the activity sector where it operates, namely paper prices fluctuations, mismatches of demand and supply, changes of consumption patterns and the way the economy behaves. The most relevant risks for Inapa in the last period were the lack of power to reflect the increasing producers’ prices in the final price and the increasing transportation costs derived from the rise in fuel prices.
Moreover, despite the fact that Inapa is present in several countries, its exposition to exchange rate risk is limited since the aggregated value of sales in a currency different from the Euro (Swiss Franc, Dollar, Kwanza) only accounts for 7,2% of the group’s total sales.
3. Industry overview
3.1. Paper and packaging segment
An overview of the most important facts in the paper industry will be done by focusing on the variables that drive production and consumption, and consequently prices and quantities.
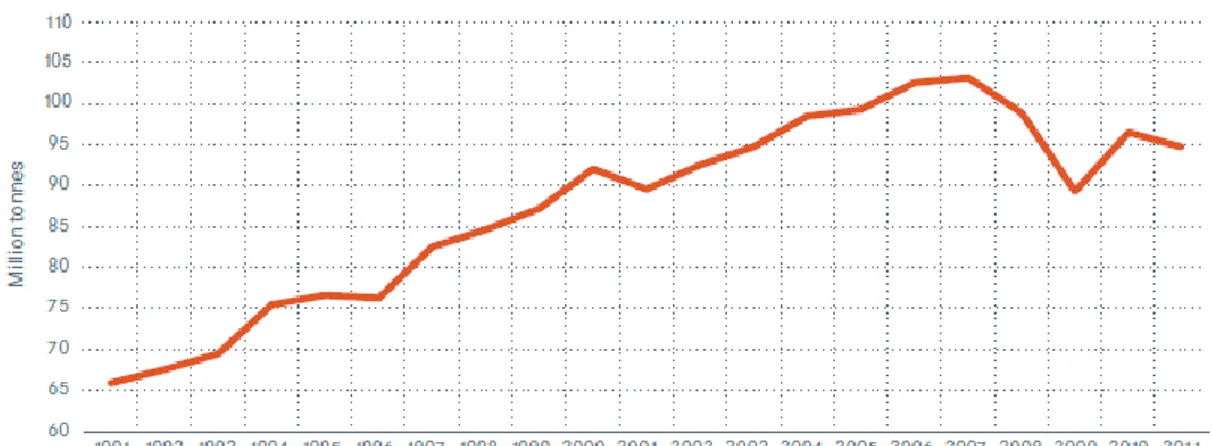
3.1.1. Production
The economic recession in Europe caused paper and board production in the CEPI countries (Confederation of European Paper Industries) to decline by 2% in 2011. Despite the decrease in production, the European tons produced are similar to the majority of the paper production countries, with the exception of South Korea and China. In fact, it was estimated that the world paper production in 2011 only grew 0,5% in comparison to the previous year1.
29
Figure 7: Production of paper and paper board in CEPI countries
The increasing levels of production in China led it to be the number one in the market in what concerns to paper and paperboard exportations. In contrast to European countries and to North America where demand exceeded the production capacity, China still has forests in the Western side of the country, which capacity is not fully exploited. Moreover, the high inventory coming from China can be explained by the fact that the Chinese market is really fragmented, with only 20% of the domestic capacity coming from the ten largest producers.
Therefore, small producers are operating to cover their fixed costs2. Regarding the packaging segment, it represents 43,1% of the paper and board production in CEPI countries in 2011, which may explain the high growth rates associated to this segment. The newsprint represents only 10,2%, which matches the consumption levels that will be explained below3.
3.1.2. Consumption
Paper consumption has followed different patterns across paper segments (see appendix 2), even though overall it was reported to be linked to the growth of Real GDP (see appendix 3). The technological advance felt in the last years caused the newsprint paper
2
Deloitte Compass 2011, Global forest, Paper and Packaging Sector Outlook
3 CEPI Preliminary Statistics 2011, European Pulp and Paper Industry
Figure 8: Production of paper and paper board by grade in CEPI countries in 2011
30
consumption to decline drastically and to become a risky area for companies operating within this segment. On the other hand, concerning the market for paper and paperboard, the consumption is still globally strong, with China and India contributing to this fact. These emergent countries have increasing needs and consumption levels that are rising at exponential rates. Moreover, the appearance of China as a consumer and producer of paper products is starting to have a substantial impact in the industry’s structure.
In Europe the demand for 2012 is expected to decrease, and according to Moody’s Investors Service there will be a decline of 5% in European paper volumes and a 2% fall in the European paper-based packaging volumes. The decreasing consumption levels are easily explained by the European economic situation, with the Real GDP growth rate decreasing and the ratings of several European countries being downgraded. According to Inapa’s presentation, the packaging segment presents a growth trend driven by changes in consumption patterns, with a potential increase of 2% until 2014 (see appendix 3).
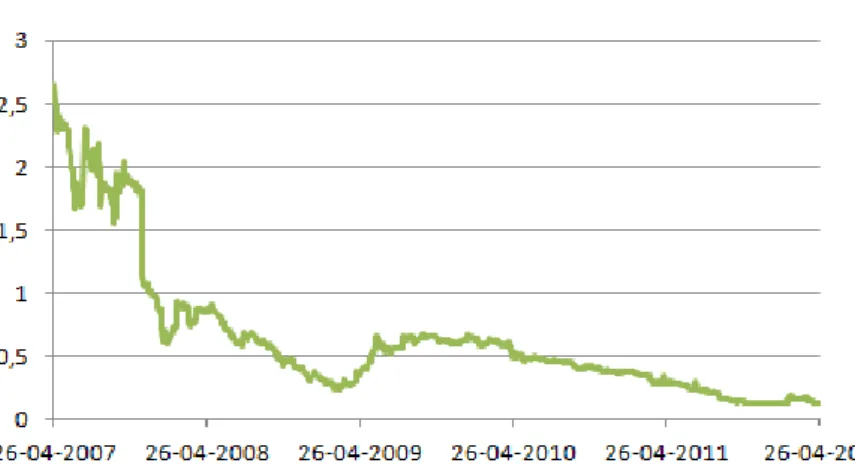
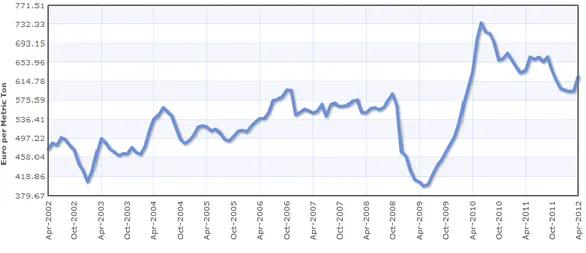
3.1.3. Prices
Being Inapa a paper distributor company it is positioned in the end of the chain. Thus, the paper prices that Inapa practices are dependent of the prices practiced by paper producers and thus of the evolution of pulp prices. The table above presents the pulp prices in a ten years range (2002-2012) measured in Euros per metric ton.
Figure 9: Pulp prices evolution
Source: World Bank
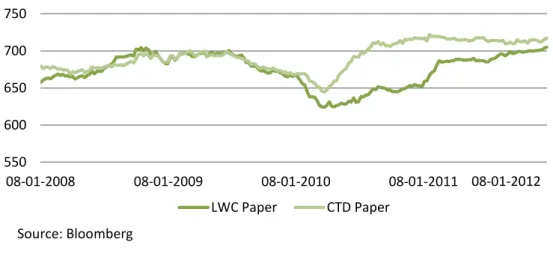
Concerning the final paper prices, Moody’s research anticipates a 3% and a 5% decline in packaging prices across Europe.Moreover the historical evolution of LWC paper and
31
CTD paper prices, which are coated paper types, are presented bellow in Euros per metric ton:
3.1.4. Competition
The distribution sector had been object of increasing competition among market players. This can be seen as a reflection of the decrease in consumption levels as well as of the growing diversification of competitors, and so producers are now expanding their activities into the distribution segment. However, big distributors like Inapa were able to reinforce their position in the market and there is still space to grow through acquisitions.
3.1.5. Consolidation
Consolidation in Europe is unavoidable and studies reveal that it will be done by companies themselves instead of having private equity investors unrolling this process4. In addition the packaging segment also owns a fragmented
4 Deloitte Compass 2011, Global forest, Paper and Packaging Sector Outlook
550 600 650 700 750 08-01-2008 08-01-2009 08-01-2010 08-01-2011
Figure 10: Paper prices evolution
LWC Paper CTD Paper
08-01-2012
Figure 11:Market Share Distributors
Figure 12:Market fragmentation
Source: Bloomberg
Source: Inapa’s results presentation
32
structure. Moreover, Inapa is already following this market trend and the consolidation potential of the countries where the company operates in the paper segment is underlined in green in the image above.
3.2. Visual communication segment
The visual communication segment is the one that presents the highest growth rate in the graphic industry, since it includes not only the printing materials but also the consumables, the sale of the actual printing machinery, and the software and their maintenance.
4. Valuation Methodology
In order to determine Inapa’s equity value two different methods were used: the Adjusted Present Value (APV) and the Multiples. The high leverage problem that characterizes Inapa was a decisive factor when choosing the APV since the company went through a deleverage process and its debt-to-enterprise value reduced from 78% to 70% in 2011 and it is still expected to diminish to 68%. Moreover, this is the Discounted Cash Flow method that better accesses debt effects, such as taxation and bankruptcy costs, by evaluating them separately instead of including them on the discount rate. As these factors can have a considerable impact on the company’s value, I chose to proceed with a more accurate valuation like the APV.
The relative valuation will be used as a support tool in order to have some comparison base and to understand how comparable companies are being quoted in the market. The explicit period choice has to take into account the steady state characteristics, although never forgetting that the higher the number of years, the more the assumptions that have to be made and the larger the probability of being far from reality. Therefore, the explicit period chosen for the valuation was 5 years, meaning that I will project Inapa’s cash flows from 2012 to 2016. In the case of Inapa, the factor that has the biggest weight in the cruise year definition is its capital structure, which according to my analysis will already be stable by then since it will be within the industry’s range of values. In addition, its capital expenditures will also equal its depreciation levels and its growth rate will not be higher than the sum of GDP growth and inflation.
33
5. Valuation assumptions
5.1. Discount rates
Table 6: Cost of equity
Risk free rate 1,72%
Equity risk premium 6,5%
Levered beta 1,22
Cost of equity 8,72%
The risk free rate considered was the 10 years Germany Treasury Bonds. The choice upon European government bonds was based on the fact that Inapa’s operations are majorly concentrated in Europe and thus its revenues’ currency is the Euro. Moreover, the Germany’s government bonds are the only ones considered to be default free in this market.
The equity risk premium used was 6,5%, which is based on the survey ran by (Fernández, Aguierramalloa, & Correa, 2011). As Inapa’s investors are in their majority of Portuguese nationality, the equity risk premium chosen was the one that represents the required rate of return for Portuguese investors. In this case, the lack of historical data was not considered to be a problem due to the few years of existence the Portuguese Stock Index (PSI 20), when compared to other countries.
Moreover, as according to Damodaran the country risk premium for Germany and France, countries where operations predominate, are 0%, meaning that the risk associated to the company’s operations is automatically reflected on the equity risk premium.
The levered beta estimation was done by an elimination process until reaching the solution that gives the best indication of the company’s undiversified risk. With this purpose, three different betas were considered: Industry beta, peer group beta and regression beta.
I started by computing a regression with the returns of the MSCI Europe Index as the independent variable, since Inapa has a large presence in seven European countries, and Inapa’s returns as the dependent variable. The data used was taken from Bloomberg and daily returns from 26/04/2007 until 25/04/2012 were used.
34
However, due to the Inapa’s low number of stock exchange transactions, the regression beta reached was 0,27, which is considerably low when compared to the following methods and thus it will not be used.
According to Damodaran estimates, the average beta for the Paper and Forest products is 1,36. Even though this estimation was done with a sample of 32 companies inserted in Inapa’s core business sector, its sample is based on USA companies and thus by itself it is not a good predictor.
In order to estimate the peer group beta, I used Sequana and Paperlinx as comparable companies since they operate in the same industry of Inapa and follow similar business models in what concerns to their business areas (further explanations about the peer group choice will be given in the Relative Valuation section).
Despite being a highly recognized beta estimation method, it is highly affected by the different capital structures assumed by the companies. In this way, adjustments of deleveraging and leveraging the betas were done so that different capital structures did not affect the risk level, reaching a levered beta of 1,1.
Table 7: Peer group beta adjustments
Peer group
Levered
beta Tax rate D/E
Unlevered beta Inapa’s levered beta Sequana 1,28 30% 3,05 0,41 1,077 Paperlinx 0,87 30% 1,87 0,38
Weighted average Beta (variable: market capitalization)
1,08 0,4
Moreover, for valuation purposes an average between the peer group beta and the industry was done so that the closest peers of Inapa can be taken into account, reaching a final beta of 1,22.
Table 8: Cost of debt
2011 E2012 E2013 E2014 E2015 E2016
Interest coverage ratio 0,834 1,332 1,148 1,094 1,094 1,099
Rating CCC B- CCC CCC CCC CCC
Spread 8,8% 6,8% 8,8% 6,8% 3,8% 1,3%
Cost of debt 10,47% 8,47% 10,47% 10,47% 10,47% 10,47%
Regarding the company spreads, the Damodaran’s table that links interest coverage ratio to ratings was used (see appendix 5). The cost of debt was obtained by adding the risk free rate to the spread of each year.
35
5.2. Cash flow drivers
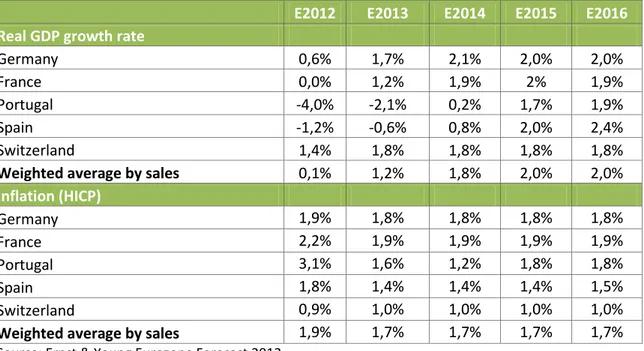
Table 9: Macroeconomic forecasts
E2012 E2013 E2014 E2015 E2016
Real GDP growth rate
Germany 0,6% 1,7% 2,1% 2,0% 2,0%
France 0,0% 1,2% 1,9% 2% 1,9%
Portugal -4,0% -2,1% 0,2% 1,7% 1,9%
Spain -1,2% -0,6% 0,8% 2,0% 2,4%
Switzerland 1,4% 1,8% 1,8% 1,8% 1,8%
Weighted average by sales 0,1% 1,2% 1,8% 2,0% 2,0%
Inflation (HICP) Germany 1,9% 1,8% 1,8% 1,8% 1,8% France 2,2% 1,9% 1,9% 1,9% 1,9% Portugal 3,1% 1,6% 1,2% 1,8% 1,8% Spain 1,8% 1,4% 1,4% 1,4% 1,5% Switzerland 0,9% 1,0% 1,0% 1,0% 1,0%
Weighted average by sales 1,9% 1,7% 1,7% 1,7% 1,7%
Source: Ernst & Young Eurozone Forecast 2012
This data was taken from Ernst & Young Eurozone Forecast – Spring Edition March 2012 and the weighted average was computed by taking the proportion of sales per country as a constant (see appendix 6). Luxembourg, Belgium and Angola did not enter in this analysis as result of their low relevance in total sales.
5.3. Operations, sales and costs
5.3.1. Sales
Inapa’s sales are driven by the tons sold and the prices practiced. However, due to information constraints, I will only be able to forecast the sales as a whole, since price information was not provided. Moreover, the sales evolution does not follow the same path across business areas, the complementary businesses are increasing their weight in Inapa’s total sales and therefore these differences will be taken into consideration. According to information provided by the company, a variation of 10% in paper prices will have an impact between 2% and 3% in the final price of the product.
36
Table 10: Sales by business area
Million Euros 2010 2011 E2012 E2013 E2014 E2015 E2016
Paper 924,7 924,4 925,4 936,3 953,2 971,9 991,3
Packaging 31,9 36.8 47,9 54,2 70,5 76,9 83,8
Viscom 23,2 25,1 26,9 28,8 30,8 32,6 33,2
Other activities 0,281 0,029 0 0 0 0 0
Total 980,2 986,4 1.000,3 1.019,4 1.054,6 1.081,5 1.108,4
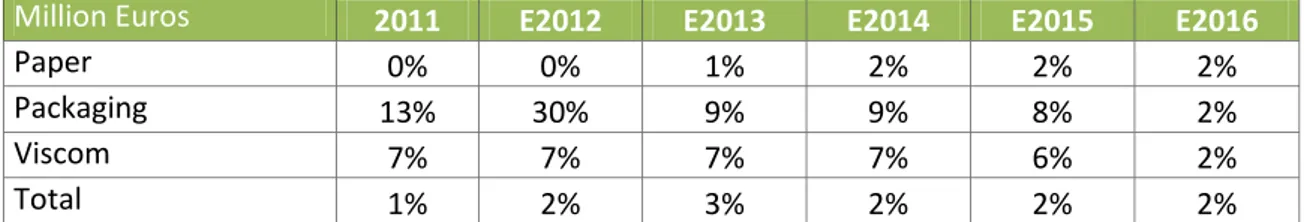
Table 11: Sales growth by business area
Million Euros 2011 E2012 E2013 E2014 E2015 E2016
Paper 0% 0% 1% 2% 2% 2%
Packaging 13% 30% 9% 9% 8% 2%
Viscom 7% 7% 7% 7% 6% 2%
Total 1% 2% 3% 2% 2% 2%
It is observable that paper consumption is highly correlated with the country GDP and for these reasons sales are growing according to the Real GDP growth rate weighted by the sales per country (see appendix 3).
The young nature of the complementary businesses inside the company explains the high growth rates of sales since it still has market potential to explore. The 30% growth in packaging is due to the incorporation of 10,9 Million Euros from the acquisition of a French packaging company - Semaq.
Table 12: Business areas weight in total sales
According to my analysis and to the table above, the company will be capable of pursuing with its strategy of increasing the weight of the complementary businesses in its portfolio.
5.3.2. Provision of services and other income
Table 13: Provision of services and other income
Million Euros 2010 2011 E2012 E2013 E2014 E2015 E2016
Provision of services 11,3 11,6 11,6 11,7 12,0 12,2 12,4
Other income 25,8 27,3 27,3 27,6 28,1 28,7 29,3
2011 E2012 E2013 E2014 E2015 E2016
Paper 95% 93% 92% 90% 90% 89%
Packaging 4% 5% 5% 7% 7% 8%
37
The services’ provision and other income that came mainly from prompt payment discounts are considered to be linked with inflation and so their growth is attached to this variable growth.
5.3.3. Operational costs
5.3.3.1. Cost of sales
Inapa’s cost of sales structure had been fairly rigid over the years, representing between 82% and 83% of sales. It is the operational cost that has the biggest weight in the company’s profit and loss statement and so an analysis by business area will be performed.
The company’s gross margins differ between business areas due to the diverse stages in the business life-cycle. Being an already mature business, the paper distribution’s gross margins present lower levels than in the complementary businesses case.
Moreover, Inapa is exposed to the price movements practiced by the manufactures. In 2011, the company’s gross margins reached minimum historical levels because they were not able to pass the producers’ price increase to the consumers’ final price. However, this situation is not expected to persist and so an average of the last 3 years was considered, and gross margins are expected to remain constant.
Table 14: Gross margin by business area
2009 2010 2011 E2012 E2013 E2014 E2015 E2016
Paper 17,0% 17,3% 16,7% 17,0% 17,0% 16,9% 17,0% 17,0% Packaging 26,7% 30,0% 26,5% 27,7% 28,1% 27,4% 27,7% 27,8% Viscom 26,1% 25,0% 22,9% 24,7% 24,2% 23,9% 24,3% 24,1%
Table 15: Cost of sales by business area
Million Euros E2012 E2013 E2014 E2015 E2016
Paper 768,7 777,8 791,8 807,4 823,4
Packaging 35,9 40,5 52,3 56,9 61,9
Viscom 22,6 24,0 25,6 27,0 27,5