The role of lease financing
Author: Rodrigo de Pinto Mendes Supervisor: Diana Bonfim
Abstract
Leasing has become, throughout recent years, an increasingly important financing source for companies’ operational activities and has deserved some attention in the corporate finance literature. Understanding the leasing decision, through a comparison with other external financing options and an evaluation of its overall fit with firms’ specific characteristics has been the focus of existing investigations and it is the goal of this study. Our analysis is focused on the relationship between lease and debt financing and on an examination of firms’ leasing propensity, taking into account their particular features. With the adoption of three different, but complementary methodologies, we find that leasing propensity is greater for smaller firms, with more investment opportunities, in a worst financial condition, with relatively fewer specific assets and with lower availability of collateral. In addition, results suggest that lease and debt financing are seen as substitutes, as higher relative amounts of debt are associated with lower leasing intensity.
Dissertation submitted in partial fulfillment of requirements for the degree of MSc in Business Administration, at Universidade Católica Portuguesa, January 2015.
ii
Acknowledgements
This thesis was elaborated under the supervision of Professor Diana Bonfim. Her guidance and contribution were of utmost importance for the progress and conclusion of this study. I certainly appreciate the opportunity to work under her direction and am thankful for her support.
I’m also grateful to Católica-Lisbon School of Business & Economics as it allowed me to get the information and data necessary for the development of this dissertation.
Last but not least, I would like to thank my parents for the opportunity they gave me to follow my academic objectives and to do it with a constant support and understanding and to my brother, for his counseling and guidance in my academic journey.
iii
CONTENTS
I - INTRODUCTION ... 1
I.1 - Lease definition ... 2
II - LITERATURE REVIEW ... 4
II.1 - Leasing and firm’s characteristics ... 4
II.1.1 - Investment opportunity set ... 4
II.1.2 - Financial condition ... 5
II.1.3 - Asset Specificity ... 5
II.1.4 - Size ... 6
II.1.5 - Availability of collateral... 6
II.1.6 - Other reasons ... 7
II.2 - Leasing vs. debt ... 7
II.2.1 - Substitutability ... 7
II.2.2 - Complementarity ... 8
III - HYPOTHESES & QUESTIONS ... 9
III.1 – Hypotheses ... 9
III.1.1- Leasing & Firms’ size ... 9
III.1.2- Leasing & Firms’ investment opportunity set ... 10
III.1.3- Leasing & Firms’ financial condition ... 10
III.1.4- Leasing & Firms’ asset specificity ... 10
III.1.5- Leasing & Firms’ availability of collateral ... 10
III.2 - Questions ... 11
III.2.1 - Leasing vs. debt ... 11
IV - DATA & METHODOLOGY ... 11
IV.1 - Sample & Information ... 11
IV.2 - Methodological approach ... 15
V - EMPIRICAL ANALYSIS & RESULTS ... 17
V.1 - Descriptive Statistics ... 17
V.2 - Leasing & years ... 18
V.3 - Leasing & industries ... 21
V.4 - Leasing & countries ... 22
V.5 - Correlations ... 23
V.6 - Methodology I ... 24
iv
V.8 - Methodology III ... 28
V.9 - Robustness tests ... 31
VI - DISCUSSION & CONCLUSIONS ... 35
References ... 38
INDEX OF TABLES Table 1 - Accounting treatment of leases ... 3
Table 2 - Description of the variables ... 15
Table 3 - Methodological summary... 16
Table 4 - Descriptive Statistics ... 17
Table 5 - Correlation coefficients ... 23
Table 6 - Correlation coefficients (cont.) ... 24
Table 7 - Methodology I – results ... 25
Table 8 - Methodology II – results ... 26
Table 9 - Methodology III – results ... 29
Table 10 - Robustness test I – results ... 32
Table 11 - Robustness test II – results ... 33
Table 12 - Robustness test III – results ... 34
INDEX OF FIGURES Figure 1 - Countries represented ... 12
Figure 2 - Sectors (GICS) represented ... 12
Figure 3 - Firms reporting leases, by year ... 18
Figure 4 – Average firms’ ratios of debt-to-assets, by year ... 19
Figure 5 – Average firms’ ratios of capital leases to assets, by year ... 20
Figure 6 – Average firms’ ratios of long-term debt (excluding capital leases) to assets, by year ... 20
Figure 7 - Firms reporting capital leases, by sector ... 21
1
I - INTRODUCTION
The study of lease financing has deserved some attention and discussion in the corporate finance literature over the last several years. The major focus of these studies has been on firms’ decision to acquire assets’ through a lease contract or through an acquisition, as in “Lease or buy” (Levy and Sarnat, 1979) or “Leasing vs. Buy-and-Borrow” (Brealey and Young, 1980).
The first and extensively studied reason for companies to use lease financing is tax related. Actually, tax incentives have received the most attention by the early finance literature, when studying firms’ decision to lease or buy/borrow (Brealey and Young, 1980; Franks and Hodges, 1978; Levy and Sarnat, 1979; Myers et al., 1976). Despite recognizing that tax considerations are, indeed, a very important factor to be taken into consideration in the leasing decision, other studies, more recently, have added other non-tax arguments and motives that could also play a relevant part in this matter (Eisfeldt and Rampini, 2009; Krishnan and Moyer, 1994; Mehran et al., 1999)
When approaching the ‘lease vs buy/borrow’ dilemma, one should pay attention to, not only a firm’s characteristics and how these same characteristics might indicate a good fit between the company and the use of lease financing, but also to benchmark this analysis with other types of external funding, such as debt. In other words, one should analyze two related aspects of the ‘lease vs. buy’ decision: i) the firm’s financing alternatives available in the market (leases, ordinary debt, secured debt…), taking into consideration the pros’ and cons’ of each one and; ii) which alternative is the most beneficial to the firm, given its particular features. In fact, the majority of the research literature in this area comprises both of these aspects due to their inherent interdependence, even if it focuses more in one than the other. For instance, Lewis and Schallheim (1992); Marston and Harris (1988) and Yan (2006) focus on the interaction between leases and debt whereas Finucane (1988), Sharpe and Nguyen (1995) and Smith and Wakeman (1985) pay specific attention to firms’ leasing propensity in relation to firm-specific characteristics.
In this study, these two variants are analyzed with the goal of addressing a simple and specific question: “Why do firms use lease financing?”. This research intends to understand the relationship between leases and other types of debt, the similarities and the differences between them, as well as measuring firms’ leasing propensity over several firm-specific characteristics. Particularly, it is proposed that the
2
size of a firm, its investment opportunity set, its financial state (profitability, cash-flows, bankruptcy potential, ability to meet fixed claims’ obligations), the specificity of its assets and the amount of fixed assets that can be used as collateral have an effect on that firm’s propensity to use lease financing. It is also questioned if leases and debt have a complementary or substitutability relationship, that is, if firms see lease financing as an alternative or as a complement to debt financing.
The results suggest that leasing propensity is negatively related with firms’ size, profitability and financial health, availability of collateral and asset specificity, whereas a positive association is found with firms’ investment opportunity set. Regarding the comparison between leases and debt, a substitutability relationship is achieved, as higher levels of firms’ overall debt are associated with lower levels of leasing activity.
This study’s following pages are organized as follows: Section I.1 defines leases; Section II summarizes previous findings on the topics in question; Section III presents the questions and hypotheses of this investigation; Section IV describes the data gathered and the methodology adopted; Section V provides the empirical analysis and interpretation of results; finally, Section VI presents some discussion of the results and summarizes this study’s main conclusions.
I.1 - Lease definition
In a lease contract, one party (lessee) acquires the right to use an asset in exchange for a sequence of regular payments to that asset’s owner (lessor). The amount and schedule of the lease payments and the time period of the lease contract are discussed and agreed between the two parties and this procedure is valid for all leases, independently of the classification or form they may take (Brealey, 2006.). According to IAS 171, a lease can be considered either as an operating lease or as a capital/finance lease. In a capital lease, the risks and rewards associated with the ownership of the asset are substantially transferred from lessor to lessee. Among the most common indicators of a capital lease, there are: the ownership of the asset is transferred to the lessee by the end of the contract; the lessee has the option to buy the asset from the lessor at an expected price; the lease term takes the majority of the economic life of the asset; if there is the option to prematurely terminate the contract, the lessor’s costs associated with it are borne by the lessee.
1
3
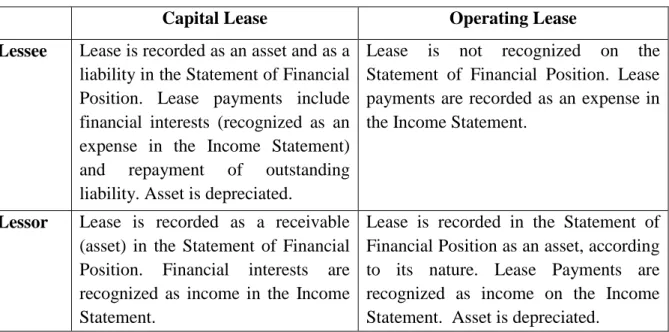
Operating leases include all other lease contracts that do not meet any of the requirements of a capital lease, as the risks and rewards inherent to the asset are kept by the lessor. The accounting treatment of each type of lease is different, both for lessors and for lessees. Table 1 explains these accounting differences:
Table 1 - Accounting treatment of leases
Capital Lease Operating Lease
Lessee Lease is recorded as an asset and as a liability in the Statement of Financial Position. Lease payments include financial interests (recognized as an expense in the Income Statement) and repayment of outstanding liability. Asset is depreciated.
Lease is not recognized on the Statement of Financial Position. Lease payments are recorded as an expense in the Income Statement.
Lessor Lease is recorded as a receivable (asset) in the Statement of Financial Position. Financial interests are recognized as income in the Income Statement.
Lease is recorded in the Statement of Financial Position as an asset, according to its nature. Lease Payments are recognized as income on the Income Statement. Asset is depreciated.
This study focus its analysis on capital leases, rather than in operating leases, for several reasons: First, it allows for an investigation where tax incentives or tax-related arguments for firms to use lease financing are left out of the equation. This is because, contrary to capital leases, operating leases allow the lessor to depreciate the asset and, therefore, the lessee can exchange the associated tax shields for lower lease payments. This is especially true if the lessor faces a higher tax burden than the lessee. Several studies (Barclay and Smith, 1995; Sharpe and Nguyen, 1995) have confirmed this rationale by showing that firms facing lower marginal tax rates display greater lease ratios than firms facing higher marginal tax rates. Second, operating leases are considered off-balance-sheet financing, as, contrary to capital leases, they are not recognized as an asset or as a liability. As a result, focusing on capital leases allows for a more correct comparison between leases and debt, as the accounting treatments for both of them are quite similar. A third reason is the fact that tax-incentives to use lease financing have already deserved great attention in finance literature, as it was previously mentioned.
Against this background, from hereafter, the hypotheses, questions, interpretations and conclusions taken are exclusively related to capital leases.
4
II - LITERATURE REVIEW
II.1 - Leasing and firm’s characteristics
In the finance literature, it is generally agreed that companies’ levels of lease financing or their propensity to use it are influenced by several firm-specific characteristics. In addition to tax incentives, as one of these influential characteristics, several other non-tax reasons were consistently identified as specific motivators for the use of leases. In the paragraphs below, we summarize some of the main arguments debated.
II.1.1 - Investment opportunity set
Financial reasons prevail as the most important motivators to use lease financing. For instance, the problems of asset substitution (Jensen and Meckling, 1976), and of underinvestment (Myers, 1977) can be controlled with the use of leases. Before developing these two arguments, one shall take into account that the type of debt most similar to a lease is secured debt, as they are both asset-backed financing instruments and have similar consequences on a company. Issuing secured debt can be seen as a mean for debt holders to control for potential incentives the borrower might have to incur in asset substitution. Since the claim is referent to a particular asset, its value is not affected by stockholders/managers decisions to invest in bad or risky projects. This, as a result, lowers the borrowing and contracting costs of secured debt, making it advantageous for both the debt holder and the borrower (Smith Jr. and Warner, 1979). Another benefit of using secured debt is that it allows the borrower to decrease his exposure to potential underinvestment problems. When financing a new project with secured debt, a firm is more likely to invest in potentially good ventures with positive net present values because it can separate the claim of the debt holder from the project’s returns, whereas, if unsecured debt was used, the returns on the investment could be claimed by the already existing debt holders, if necessary. This is particularly true if the firm’s existing debt shows some level of riskiness (Stulz and Johnson, 1985).
To conclude, it was argued that lease financing would have the same role as secured debt as a possible financing instrument that could mitigate the underinvestment and asset substitution problems (Smith and Wakeman, 1985). Actually, it has been argued that lease financing allows firms to grow and develop faster (Rampini and Viswanathan, 2013).
5
II.1.2 - Financial condition
Another commonly mentioned argument in favor of lease financing in the existing literature is that it allows the lessor to minimize the costs he would face in a potential situation of bankruptcy of the lessee. Indeed, among the most common types of corporate liabilities, leases have one of the highest priorities of claim. Therefore, in case of default on a lease payment or in a situation where the lessee files for bankruptcy, the financial interests of the lessor are considerably protected. If the lessee defaults on a lease payment, the lessor has the right to repossess the leased asset. This repossession can be restrained if, in case of bankruptcy, the asset is proved to be essential to the lessee’s operations. However, in this situation, the lessee has to fulfil the lease contract and keep on paying the lease fees to the lessor throughout the bankruptcy process, as these payments are then considered administrative expenses. On the other hand, the financial claims of debtholders are more diluted and are not met until the bankruptcy process is terminated (Barclay and Smith, 1995; Sharpe and Nguyen, 1995). Actually, in a bankruptcy situation, leasing even appears to be a safer choice for financiers than is secured lending, due to the easier repossession of the asset by the lessor than the recover on the collateral by the secured lender (Eisfeldt and Rampini, 2009; Krishnan and Moyer, 1994). As a result, firms facing a situation of financial distress or potentially bankruptcy may see leases as a more accessible financing source.
II.1.3 - Asset Specificity
The characteristics of the firms’ assets and their degree of specificity, which might vary from industry to industry, also affect the decision to use lease financing. In case of a very specialized asset, which is only used by a very restricted type of firms or by a very specific industry, the lessor’s concerns are much higher than if the asset in question was commonly used across different industries or different sorts of companies. First, the alternative use value of a specialized asset is much lower than the one of a non-specialized asset; for instance, structures (e.g. office facilities) may be used for several purposes and across different types of firms, whereas equipment (e.g. production machinery) may not (Smith and Wakeman, 1985). Second, firm-specific assets generally depreciate faster than non-specific assets which in turn decreases the benefits of repossession by the lessor (Eisfeldt and Rampini, 2009). Finally, widely used assets can more easily be transferred from one entity to another without major requirements or modifications (Krishnan and Moyer, 1994; Williamson, 1988). These facts may result in higher risks for the lessor, as he would be more exposed to the lessee’s actions. This, in
6
turn, generates possible high moral hazard costs and therefore increases the costs of a lease contract (negotiation, enforcement, etc…). As a result, these contracting problems arising from leasing a firm-specific asset emphasize the advantages of, alternatively, purchasing the asset (Benjamin Klein et al., 1978).
II.1.4 - Size
The use of lease financing has also been shown to vary according to firms’ size. More explicitly, it has been argued that smaller firms have constantly presented higher values of lease financing relative to bigger companies. Several reasons have been pointed out for this negative correlation. First, the asymmetry of information argument, explaining that a firm’s size is positively related with the availability and quality of outside information about that firm’s present and future operations and, as consequence, negatively associated with risk (Schallheim et al., 1987). Therefore, leasing could represent a more accessible financing alternative in terms of contracting costs, for smaller/less transparent firms, due to a more safeguarded financial position of the lessor. Second, larger firms are more likely to find alternative uses for a particular asset than smaller firms, when it is no longer needed for its original motive and may also be more effective on reselling the asset. This translates into a higher incentive for smaller companies to use lease financing, relative to bigger companies (Sharpe and Nguyen, 1995). Another reason for this difference is that larger firms have a comparative advantage in relation to smaller firms, on issuing publicly traded securities, due to the inherent high fixed costs and potential scale economies. Therefore, they would prefer types of financing instruments that are publicly issued, which is not the case of leases (Barclay and Smith, 1995). In addition, it can also be argued that larger companies are usually more diversified and, as a consequence, achieve more constant and stable cash-flows. This, once more, allows for the use of debt financing with lower costs, when compared to smaller firms (Graham et al., 1998).
II.1.5 - Availability of collateral
The availability of fixed assets (collateral) has been proved to be a determinant of firms’ capital structure (Rampini and Viswanathan, 2013) and might be related to their levels of lease financing. Intuitively, companies that use more fixed assets in their operations are expected to show higher leasing intensity, since this financing instrument is mainly characterized by being linked to a specific fixed asset (Graham et al., 1998). However, other authors have considered lease financing and relationship lending as the best and less risky financing alternatives for more opaque firms with fewer or even no
7
collaterals to offer, due to a less risky position of the financiers (Beck and Demirguc-Kunt, 2006).
II.1.6 - Other reasons
Several other reasons are also mentioned to influence a firm’s decision to lease an asset and shall be important to refer. It is argued that assets whose values are more sensitive to maintenance decisions, this is, assets that can rapidly wear out or deteriorate if not carefully preserved, are more likely to be purchased, because of the separation between ownership and control and the agency costs inherent to a lease contract (Smith and Wakeman, 1985) . Leasing is more likely to happen when the company intends to use the asset for a shorter period than the asset’s useful life, as otherwise the ownership transfer costs would be higher (Smith and Wakeman, 1985). Leases, and mainly short-term leases, reduce the need of the lessee to spend more time and resources on gathering information about the asset’s condition and quality, when compared to an asset purchase situation (Flath, 1980). Finally, the ownership structure of a firm has been argued, as well, to be one of the influential factors on a company’s decision to use lease financing, especially in the case of operating leases. Leases allow CEOs and managers with a large stake of the firm’s ownership to reduce their exposure to asset-specific risks, such as the risk of obsolescence (Mehran et al., 1999).
II.2 - Leasing vs. debt
The relationship between leases and debt is not linear, apparently, as several
studies have reached different conclusions regarding the
substitutability/complementarity link between these two financing options. Their research goal, as one might see in Bowman (1980), is to understand if leases are perceived to be a form of debt financing, or not.
II.2.1 - Substitutability
The original assumption is that, since both leases and debt commit the firm to the payment of fixed obligations, they reduce a firm’s overall borrowing capacity. As a result, they should be seen as substitutes, as higher levels of debt are associated with lower levels of leases and vice-versa (trade-off interaction). This substitutability result can be reached if, instead of comparing levels of leases and debt, one compares changes in their amounts. In fact, even though firms with greater debt may use more leases than lower-debt firms, this has a consequence of lowering their capacity to contract new
8
debt. Putting it in another way, firms reduce their potential debt levels with increases in their leasing levels (Marston and Harris, 1988). Furthermore, surveys showed that, in the managers’ perspectives, leases are seen as substitutes for and the most important reason for this view is the fact that companies’ borrowing capacity was determined by its ability to commit to fixed payments, a characteristic of both leases and debt financing (Mukherjee, 1991). This is, once again, the original assumption of the substitutability principle.
When taxes are left out of the decision process of which financing instrument to use, debt and leases are shown to be alternatives for each other (Deloof and Verschueren, 1999). In addition, the substitutability result could be achieved and reinforced when operating leases are considered, in addition to finance leases, on the comparison between leases and debt (Beattie et al., 2000). Another argument for the negative relationship between lease and debt financing is the fact that greater amounts of leases imply a higher cost of contracting debt and vice-versa and that the degree of this substitutability is determined by specific characteristics of the firms (Yan, 2006).
II.2.2 - Complementarity
On the other side of the discussion, several studies have reached the opposite conclusion, as results indicate that debt and leases are complements, rather than substitutes. In other words, higher levels of debt are associated with higher levels of lease financing and vice-versa. Some reasons have been pointed out for this complementarity between these two financing options: the market for debt and leases could be inefficient; differences between the tax rates of leasing and non-leasing firms2; differences in the quality of the debt issued by leasing and non-leasing companies and the possible existence of an optimal capital structure, for instance, the non-existence of a debt limit for a particular company (Ang and Peterson, 1984). Another argument for this complementarity is the fact that companies may present specific characteristics, for instance, regarding their investment opportunity set, that allow them to contract greater amounts of both debt and leases (Smith and Wakeman, 1985). Further studies reached the same positive relationship result, supporting the argument of the quality difference between the debt issued by firms that lease and firms that do not lease. For instance, companies employing a higher variety of debt securities in their capital structure may be more motivated to adopt other sources of financing such as leases (Finucane, 1988).
9
Others defend the complementarity theory by supporting the argument of different tax brackets between leasing and non-leasing firms. Firms that contract lease financing (operating leases in this case) can increase the levels of debt in their capital structure because leasing allows them to sell tax shields to the lessor, in exchange for lower lease payments and consequent preservation of borrowing capacity (Lewis and Schallheim, 1992). Further studies have also reached the conclusion that leasing firms consistently present higher debt levels than non-leasing firms, supporting the complementarity proposition (Krishnan and Moyer, 1994).
III - HYPOTHESES & QUESTIONS
III.1 – Hypotheses
Several firm-specific characteristics have been shown, theoretically and empirically, to influence a firm’s propensity to use leases rather than debt or other sources of external financing. Having presented some of these characteristics and the arguments behind them, one may, by now, formulate several hypotheses that will serve as the basis for this investigation. Most of them are centered on two main facts: lease claims have one of the highest priorities among corporate liabilities and lessors’ positions are considerably safeguarded, in a lease contract. Therefore, leasing may be a more favorable and accessible financing option in environments of risk and insecurity.
III.1.1-
Leasing & Firms’ sizeSmaller firms are expected to use more lease financing, in relative terms, than larger firms. Larger firms have access to more diverse and flexible sources of financing; have a comparative advantage in issuing public securities, due to economies of scale; are more transparent to all stakeholders, due to a higher availability of information; are usually more diversified and stable; can more easily find alternatives of use for the leased asset. The link between a firms’ size and lease ratios has been regularly analyzed in several studies, as one might see in Barclay and Smith (1995) and in Mehran et al. (1999), for instance.
10
III.1.2-
Leasing & Firms’ investment opportunity setCompanies with more investment opportunities are expected to use more lease financing, in relative terms, than more mature firms. The instability and unpredictability of a growing firm affect its ability to efficiently use other sources of financing. Growing firms are more likely to incur in practices of asset substitution and are more exposed to the underinvestment problem. The link between a firm’s investment set and its lease levels has been frequently studied, as one might see in Barclay and Smith (1995) and in Krishnan and Moyer (1994), for example.
III.1.3-
Leasing & Firms’ financial conditionFirms financially constricted, or potentially bankrupted, are expected to use more lease financing, in relative terms, than more profitable firms. Profitable firms have a higher availability of internal funds and have access to more diverse and flexible sources of external financing. The link between a firm’s financial condition and its lease ratios can be observed in some studies, such as in Sharpe and Nguyen (1995) and in Graham et al. (1998), for instance.
III.1.4-
Leasing & Firms’ asset specificityCompanies utilizing more firm-specific assets are expected to use less lease financing, in relative terms, than others. Leasing more common or generalized assets is easier for the lessor, as there are more alternatives of use for them, they are usually easier to transport and modify and have, generally, a higher benefit of repossession. Hence, potential moral hazard problems between lessor and lessee are smaller and less likely to occur. The link between a firm’s assets’ specificity and its lease ratios has deserved some attention, as one might see in Krishnan and Moyer (1994) and in Eisfeldt and Rampini (2009), for example.
III.1.5-
Leasing & Firms’ availability of collateralFirms with higher availability of collateral are expected to use less lease financing, in relative terms, than others. Companies with more fixed assets can offer more collateral to financiers and are more valuable in case of liquidation, which allows them an easier access to a wider variety of debt financing instruments. On the other hand, companies employing more fixed assets on its operations, more capital intensive, shall, understandably, use more leases, as it is a financing instrument tied to a specific fixed asset. As a result, one may also expect a positive relationship between firms’
11
leasing propensity and the availability of collateral. The link between a firm’s availability of collateral and its lease ratios has been analyzed in several studies, as one might see in Graham et al. (1998) and in Beck and Demirguc-Kunt (2006), for instance.
III.2 - Questions
Furthermore, this study also intends to find what the relationship between lease and debt financing is. As stated before, this interaction is not linear, as several studies reach different conclusions regarding this matter and valid arguments are pointed out from both sides, as one might observe in Lewis and Schallheim (1992) and in Yan (2006). Therefore, the analysis presented in the next pages will, possibly, shed some light on this question:
III.2.1 - Leasing vs. debt
What is the relationship between lease and debt financing? Are they considered to be substitutes or complements? How does a firm’s overall debt level affect its leasing intensity?
IV - DATA & METHODOLOGY
IV.1 - Sample & Information
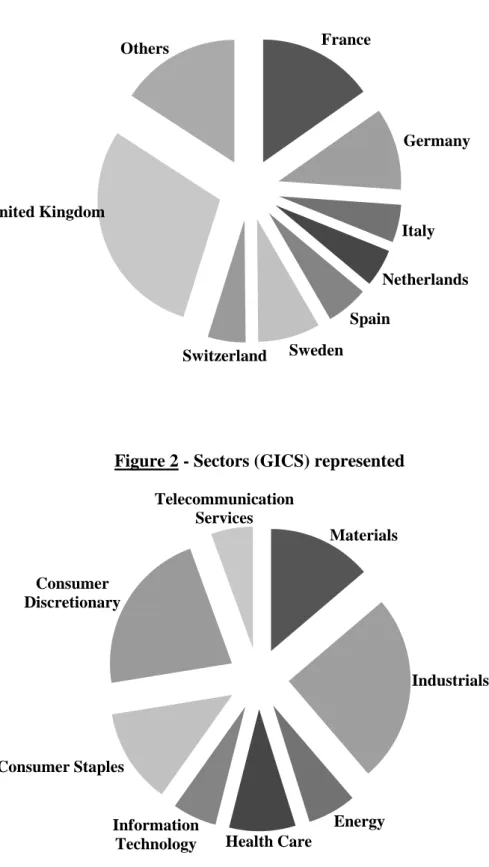
The sample collected consists on companies listed on the Bloomberg European 500 index. Financial annual data was gathered for each company for a time period of 14 years (2000-2013) and observations with unavailable data were excluded. Within this sample, several European countries are represented, as well as different industries, according to the Global Industry Classification Standard (GICS). Companies operating in the “Financials” and “Utilities” sectors were excluded, in order to avoid regulation implications and achieve a more homogenous collection of firms. This resulted in a total of 341 companies and 4489 firm-year observations, but not all of them completed with all the necessary information. A more thorough description of the firms represented in the sample is presented in Figures 1 and 2.
12
Figure 1 - Countries represented3
Figure 2 - Sectors (GICS) represented
This heterogeneity of the sample will contribute for a more generalized and appropriate set of results and subsequent conclusions, regarding the topic being
3
Others (representativeness below 5%): Austria, Belgium, Denmark, Finland, Greece, Ireland, Norway and Portugal. France Germany Italy Netherlands Spain Sweden Switzerland United Kingdom Others Materials Industrials Energy Health Care Information Technology Consumer Staples Consumer Discretionary Telecommunication Services
13
investigated. The following indicators were retrieved for each company and for each year.
Leasing propensity
To measure the propensity of a firm to use capital leases, the ratio of capital leases to property, plant & equipment was calculated, or, in other words, the portion of fixed assets financed through capital leases. It is therefore assumed that firms with higher ratios for this measure are more prone to use lease financing. This measure has been used before in other studies, such as Sharpe and Nguyen (1995). An alternative indicator would be the ratio of capital leases to assets, which shall be later used in a robustness test. However, one may argue that the first variable measures firms’ leasing propensity better, due to the direct link between leases and fixed assets.
Debt
To measure the debt levels of a firm two indicators were gathered: Total debt to assets ratio and the long-term debt (net of capital leases) to assets ratio. The first one will be utilized as a measure of the leverage level of a firm and the second will be employed in a comparison with the leasing propensity measure, as capital leases are considered long-term liabilities.
Size
To gauge a firms’ size, the natural log of assets is utilized. This indicator has been commonly used in the literature referred, as it shall best reflect a firm’s production and operations magnitude. Other indicators, such as Sales and Market Value are also commonly adopted. However, one may argue that the value of sales is highly influenced by the firm’s performance and seasonality and its market value can be highly volatile.
Growth Opportunities
To estimate a firm’s growth potential, the market-to-book value of equity is utilized. This metric is the most chosen in the finance literature, as the market value of a company shall take into account future strategic moves or decisions regarding its set of investments opportunities.
Profitability
To measure a firm’s profitability, it is considered the ratio of Earnings before Interest and Taxes (EBIT) to Assets .This metric reflects the operating efficiency of a firm and is highly adopted as a return-on-assets indicator.
14
Financial Distress
The Altman Z-score is used to evaluate a firm’s financial distress level or its closeness to a bankruptcy situation. Other metrics are also taken into account, like the ratio of EBIT to interest expenses, as a measure of the firm’s ability to meet its debt obligations and the ratio of free cash-flow to assets, as an indicator of a firm’s capacity to generate cash.
Availability of Collateral
A firm’s level of collateral is measured by the relative amount of fixed assets displayed on its Statement of Financial Position. Therefore, the ratio of property plant and equipment to assets is utilized to measure firms’ collateral availability.
Asset Specificity
To gauge the specificity level of a firm’s assets it is assumed the ratio of research and development expenditures (R&D) to sales. The reasoning behind this option is the fact that the objective of R&D activities is to develop assets (e.g. technologies, equipment, products…) that are not available in the market and are, hence, unique to the firm. This indicator has been used before in other studies, as one may observe in Krishnan and Moyer (1994) and in Eisfeldt and Rampini (2009), to measure asset specify.
Control Variables
Other variables will be used in order to control for differences firms may display between each other, in addition to the explanatory variables already identified. First, this analysis controls for industry differences in the leverage ratios and for this purpose, dummy variables for each sector a firm is operating in (mentioned before) are utilized. Second, time differences, relating to, for instance, the macroeconomic situation and financial conditions, are also taken into account. This control is especially important, since the time period of the data collected includes the global financial crisis of 2007-2008. Therefore, dummy variables representing each year of the analysis time window are adopted. Third, this investigation also controls for firms’ country of domicile, through the utilization of dummy variables for each nation represented. The leverage ratios of a company might be influenced by its home market competitive environment, regarding the offer and availability of credit, as well as by potential cultural differences. Table 2 summarizes the variables utilized in the analysis and their respective designation from hereafter.
15
Table 2 - Description of the variables
Measure Variable Designation
Leasing Propensity Capital Leases to Property Plant and Equipment ratio
CL/PPE
Debt Ratios of Debt to Assets and of (Long-Term debt – Capital Leases) to Assets
D/A and LTd/A
Size Logarithm of Assets Log(A)
Growth Opportunities Market-to-Book ratio of Equity M-to-B
Profitability EBIT to Assets ratio EBIT/A
Financial Distress Altman Z-Score4, ratios of EBIT to interest expenses and Free Cash-Flow to assets
Z-score, EBIT/ie and
FCF/A
Availability of Collateral Property, Plant & Equipment to Assets ratio
PPE/A
Asset Specificity R&D expenditures to sales ratio R&D/s
Industry differences Dummy Industry
Temporal differences Dummy Year
Country differences Dummy Country
IV.2 - Methodological approach
The empirical approach, consisting on testing the hypothesis already stated and analyzing the relationship between lease financing and debt will include three different moments.
First, an analysis is made by splitting the sample into two reasonably equal groups for each explanatory variable, one for the variable’s low values (below median) and other for the variable’s high values (above median). Afterwards, the average values of CL/PPE (lease propensity) are calculated for each group, for the different variables. This analysis shall allow for an initial understanding of the interaction between a firm’s leasing propensity and its characteristics, including its long-term debt levels.
In a second approach, different regressions, one with capital leases as the dependent variable (CL/PPE) and other with long-term debt as the dependent variable (LTd/A) will be compared. The set of explanatory variables will be the same in the two equations, being based on the existing literature. This analysis allows for a direct estimation of the effects and interactions between the explanatory variables and the
4 (1.2 x working capital total assets + 1.4 x retained earnings total assets + 3.3 x EBIT total assets + 0.6 x
Equity (market value) total liabilities + 1.0 x
𝑅𝑒𝑣𝑒𝑛𝑢𝑒 total assets)
16
levels of leases and long-term debt and may shed some light of the relationship between these two financing options. A similar methodological approach can be seen in Graham et al. (1998).
A third methodology involves the estimation of the overall debt capacity of a firm (D/A), based on its characteristics and, afterwards, the estimated value will be included as an explanatory variable in a regression with leasing propensity as the dependent variable (CL/PPE). This third approach shall, therefore, allow for a corroboration or solidification of the results and findings achieved in the first two approaches, regarding firms’ propensity to lease, as well as for a direct estimation of the impact of a firm’s overall debt levels on its lease ratios. The rationale behind this method is that companies chose their leasing levels, only after determining their overall capacity to accommodate fixed claims. In other words, the choice between using lease and debt financing is not considered to be simultaneous, as it is assumed in some methodologies such as the ones adopted in Ang and Peterson (1984) and in Finucane (1988), because a company’s lease intensity shall depend on its overall leverage. One could see a similar procedure in Mehran et al. (1999).
The main goal of adopting these three different but complementary methodologies is to observe if the results and conclusions obtained in each section are coherent and consistent.
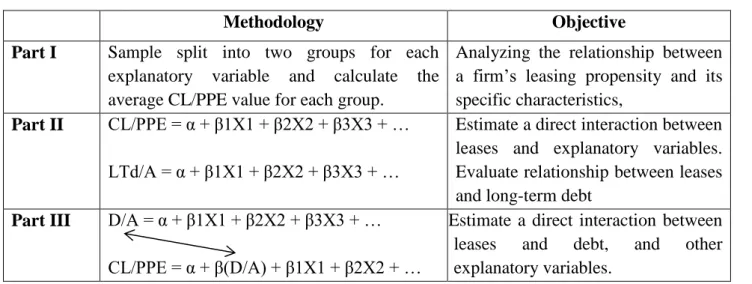
Table 3 summarizes the three methodologies adopted in this study:
Table 3 - Methodological summary
Methodology Objective
Part I Sample split into two groups for each explanatory variable and calculate the average CL/PPE value for each group.
Analyzing the relationship between a firm’s leasing propensity and its specific characteristics,
Part II CL/PPE = α + β1X1 + β2X2 + β3X3 + …
LTd/A = α + β1X1 + β2X2 + β3X3 + …
Estimate a direct interaction between leases and explanatory variables. Evaluate relationship between leases and long-term debt
Part III D/A = α + β1X1 + β2X2 + β3X3 + …
CL/PPE = α + β(D/A) + β1X1 + β2X2 + …
Estimate a direct interaction between leases and debt, and other explanatory variables.
17
V - EMPIRICAL ANALYSIS & RESULTS
This section is dedicated to the analysis and statistical treatment of the sample and data gathered. The objective is to formulate a possible answer to the question proposed and to test the formulated hypothesis, based on the results attained and associated interpretations.
V.1 - Descriptive Statistics
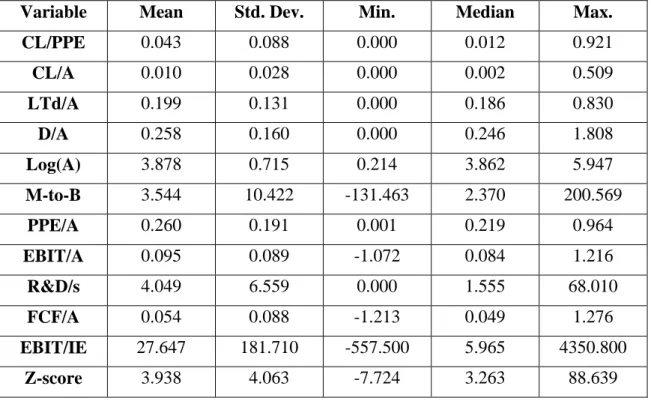
Table 4 presents a summary of some statistical indicators for the variables.
Table 4 - Descriptive Statistics (refer to Table 4 for the description of the variables)
Variable Mean Std. Dev. Min. Median Max.
CL/PPE 0.043 0.088 0.000 0.012 0.921 CL/A 0.010 0.028 0.000 0.002 0.509 LTd/A 0.199 0.131 0.000 0.186 0.830 D/A 0.258 0.160 0.000 0.246 1.808 Log(A) 3.878 0.715 0.214 3.862 5.947 M-to-B 3.544 10.422 -131.463 2.370 200.569 PPE/A 0.260 0.191 0.001 0.219 0.964 EBIT/A 0.095 0.089 -1.072 0.084 1.216 R&D/s 4.049 6.559 0.000 1.555 68.010 FCF/A 0.054 0.088 -1.213 0.049 1.276 EBIT/IE 27.647 181.710 -557.500 5.965 4350.800 Z-score 3.938 4.063 -7.724 3.263 88.639
It can be observed that the existing sample is well diversified in terms of the indicators collected. There are small and large firms (the average value of total assets is around 7.5US$million), growing and mature firms (some might be in a bankruptcy situation) and firms in very different financial states (high and low-leveraged firms, high and low-profit firms, etc…). This shall allow for a good representativeness of the results obtained. The average level of capital leases is 1% of assets and the average value of long-term debt (net of capital leases) is around 20% of assets. Even though lease financing can be used to overcome a lot of problems and situations that may arise in a credit contract between lender and borrower, other types of long-term debt are more important financing sources. Possibly the best explanation for this fact is the higher flexibility that debt offers to the borrower, since the financing amount can be used for
18
multiple purposes as it is not tied to a specific asset. It is also perceived that about half of the observations show levels of capital leases below 1.2% of Property, Plant & Equipment, which indicates that this source of financing is not the main one used for funding the fixed assets of a firm, even though it is specifically utilized for that purpose.
V.2 - Leasing & years
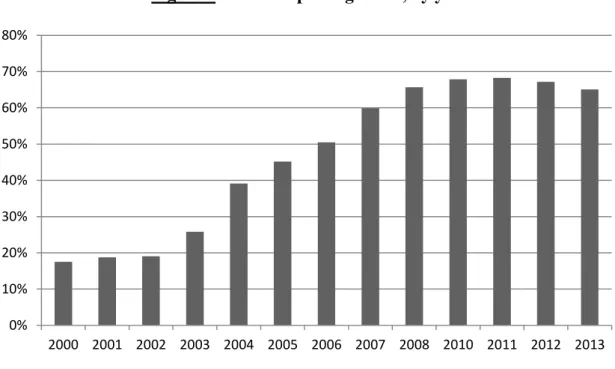
An interesting factor to take into account is the number of companies, included in the sample, that report leases each year. Lease financing is relatively more recent and innovative than other debt instruments and it has been gaining relevance in the last several years. For instance, according to data from ‘Associação Portuguesa de Leasing, Factoring e Renting’, the total leasing volume in Portugal has been constantly increasing between the years of 2002 and 20075 (followed by a decrease due to the financial crisis, possibly), which might indicate that leasing is becoming a more important and widely adopted financing instrument. Relative to the sample collected, Figure 3 displays the percentage of companies reporting capital leases each year.
Figure 3 - Firms reporting leases, by year
As one can see, the trend observed in Portugal applies as well to this sample of European firms. Between the years of 2000 and of 2010, the percentage of firms reporting capital leases increases about 50pp, from 20% to 70%, which is a very
5 Information retrieved from www.alf.pt - Associação Portuguesa de Leasing, Factoring e Renting’
0% 10% 20% 30% 40% 50% 60% 70% 80% 2000 2001 2002 2003 2004 2005 2006 2007 2008 2010 2011 2012 2013
19
significant evolution. This fact solidifies the position of leasing as an increasingly important financing instrument in the modern business world.
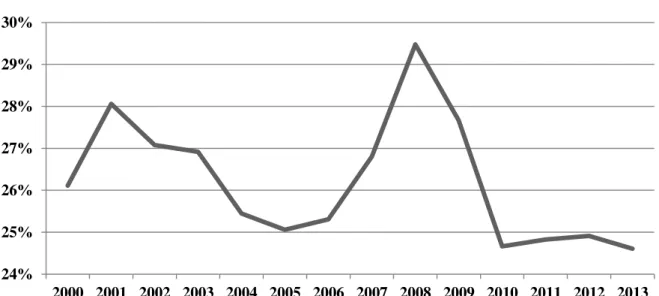
Different macroeconomic and financial environments in each year of the sample collected may potentially influence the leverage levels of the firms considered in this study, including the amount of capital leases. Controlling for this factor shall be particularly important in this case, since the financial crisis of 2007-2008 had strong and global consequences in most companies’ financial situation, which may be reflected on the values of the indicators collected. Furthermore, it would be important to see the evolution of debt ratios and of lease ratios throughout these years. One may argue that, since financial breakdown of 2007-2008 turned firm’s access to credit more difficult (Chor and Manova, 2012; Cornett et al., 2011), it would be expected to see a significant decrease on the firms’ debt ratios. Figure 4 presents the firms’ weighted average ratios of debt to assets from the years of 2000 to 2013.
Figure 4 – Average firms’ ratios of debt-to-assets, by year
As one may observe, the leverage levels of firms vary considerably from year to year. The average ratio of total debt to assets decreased about 4pp, from 29% to 25%, between the years of 2008 and 2010. It is also interesting to notice that this indicator followed exactly the opposite path (increasing 4pp, from 25% to 29%) in the years preceding the financial crisis, from 2005 to 2007. But what happened to the average ratios of capital leases and long-term debt? Comparing the way of how these two ratios evolved throughout this period of time could already give some indications about a potential relationship between them. One may argue that, even though both of them 24% 25% 26% 27% 28% 29% 30% 2000 2001 2002 2003 2004 2005 2006 2007 2008 2009 2010 2011 2012 2013
20
should have decreased from 2008 onwards, a higher change should be expected for the ratio of long-term debt than for the ratio of capital leases, as lease financing is significantly less risky than its long-term debt alternatives and would be more favorable in periods of credit constraints. Bellow, one can see the evolution of capital leases (Figure 5) and long-term debt (Figure 6) from 2000 to 2013.
Figure 5 – Average firms’ ratios of capital leases to assets, by year
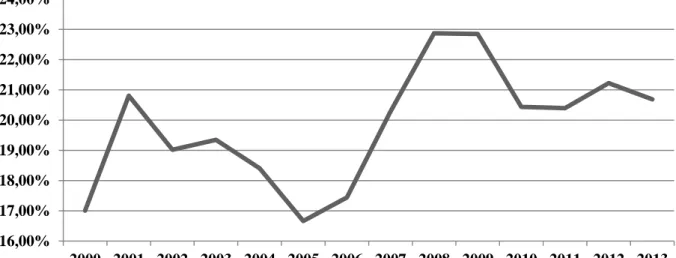
Figure 6 – Average firms’ ratios of long-term debt (excluding capital leases) to assets, by year
As expected, both ratios decrease after 2007: the long-term debt ratio goes down about 3pp, from 23% to 20%, whereas the ratio of capital leases declines slightly less than 1pp, supporting the previous assumption. An interesting fact is that long-term debt levels increased significantly in the pre-crisis period, from 17% to 23%. In Graph 5 it is also displayed the average levels of capital leases for firms that have been reporting
0,00% 0,50% 1,00% 1,50% 2,00% 2,50% 3,00% 3,50% 2000 2001 2002 2003 2004 2005 2006 2007 2008 2009 2010 2011 2012 2013
Firms reporting since 2000 All firms
16,00% 17,00% 18,00% 19,00% 20,00% 21,00% 22,00% 23,00% 24,00% 2000 2001 2002 2003 2004 2005 2006 2007 2008 2009 2010 2011 2012 2013
21
them since 2000, which may more accurately represent the evolution of this indicator throughout the years. Despite different values, the trend observed is quite similar.
V.3 - Leasing & industries
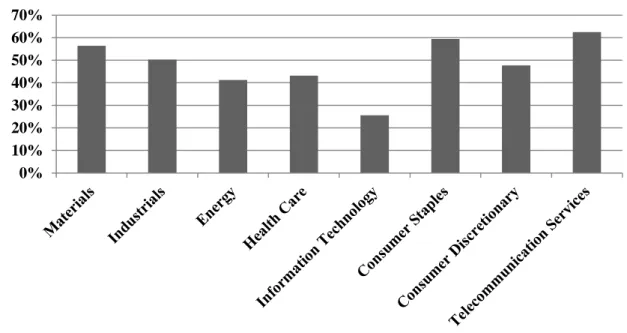
It has been shown that there are persistent industry differences on the lease ratios of firms (Finucane, 1988). Due to the different levels of specificity and use requirements of the assets utilized in each business’s operational procedures, financing these same assets through leases might be more advantageous in some industries than others. For instance, activities involving the manufacturing of a particular good might find it less useful to lease assets than others, since these assets are linked to a particular purpose, with few or no alternatives of use and might be harder to modify or transfer from one entity to other. On the other hand, for wholesale and retail industries, for instance, where the main assets should be simply buildings, it may be easier to find alternatives of use for the leased assets. Hence, it shall be necessary to take into account these industry dissimilarities. Figure 7 presents the average number of firms reporting capital leases, in the sample, for each GICS sector.
Figure 7 - Firms reporting capital leases, by sector
Firms operating in the sectors of ‘Information Technology’ (Software and Services, Technology Hardware and Equipment…), ‘Energy’ and ‘Health Care’ (Health Care Equipment and Services, Pharmaceuticals and Biotechnology) report the fewest capital leases. Following the argument displayed above, this would be the predictable result, since these sectors involve relatively more asset-specific activities. On the other
0% 10% 20% 30% 40% 50% 60% 70%
22
hand, companies operating in the sectors of ‘Consumer Staples’ (Food and Staples Retailing, Food, Beverage and Tobacco…), and ‘Consumer Discretionary’ ( Retailing, Hotels Restaurants & Leisure…) report relatively more capital leases, as they may not require the use of many firm-specific assets on their operational activity. It is, thereby, necessary to take into account these industry differences in the analysis.
V.4 - Leasing & countries
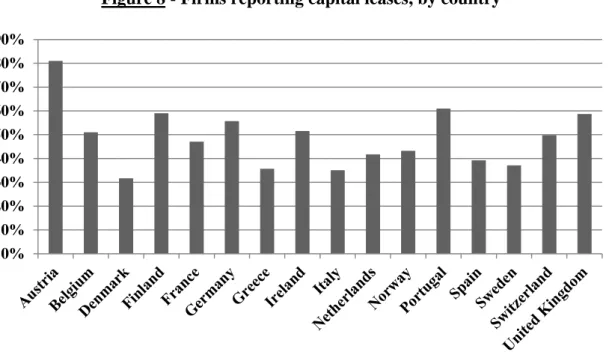
Another factor previously mentioned that could influence the use of lease financing by firms was their country of domicile. Essentially, it could be argued that, from possibly different competitive environments in terms of the offer and availability of lease financing to simple cultural differences, each country might reflect various contexts and environments that might affect, in a certain manner, the choice of lease financing. For instance, this financing instrument may be used by companies from a particular country simply because it is a common practice among its peers or within its business, without really sustaining the decision based on a thorough financial analysis. In addition, the availability and accessibility of lease financing providers may very well vary from country to country. Therefore, a need to control for these potential country differences in this analysis may arise. Figure 8 presents the percentage of firms reporting capital leases for each European country represented in the sample:
Figure 8 - Firms reporting capital leases, by country
Looking at Figure 8, one may conclude that the average amount of firms reporting capital leases in their corporate liability structure varies considerably from
0% 10% 20% 30% 40% 50% 60% 70% 80% 90%
23
country to country. It can be as small as 30% in the case of Denmark or as large as 80% in the case of Austria. Even though an explicit pattern cannot be identified (for instance, one could expect more financially developed countries, as Switzerland, United Kingdom or Sweden, to present higher lease ratios than their counterparts in this sample, as Greece, Italy or Portugal)6 , these differences of lease ratios may indicate possible national influences or biases that need to be controlled for.
V.5 - Correlations
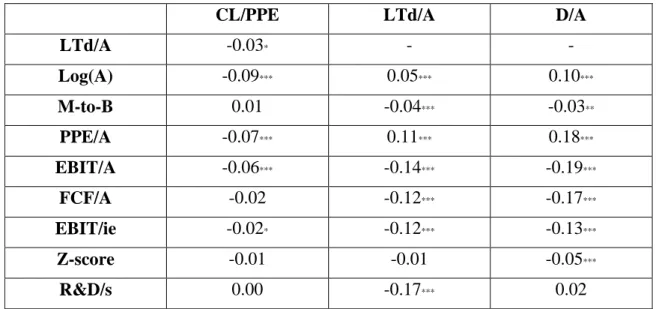
Table 5 presents the Pearson correlation coefficients between the dependent variables of leasing propensity and debt, and the explanatory variables selected.
Table 5 - Correlation coefficients (refer to Table 4 for the description of the variables)
CL/PPE LTd/A D/A
LTd/A -0.03* - - Log(A) -0.09*** 0.05*** 0.10*** M-to-B 0.01 -0.04*** -0.03** PPE/A -0.07*** 0.11*** 0.18*** EBIT/A -0.06*** -0.14*** -0.19*** FCF/A -0.02 -0.12*** -0.17*** EBIT/ie -0.02* -0.12*** -0.13*** Z-score -0.01 -0.01 -0.05*** R&D/s 0.00 -0.17*** 0.02
Statistical significance at the 10% level (*), 5% level (**), and 1% level (***).
The correlation values between dependent variables and explanatory variables might be perceived as some initial evidence of the relationships this study intends to find and understand. Some important correlations should be highlighted: Leasing propensity is negatively and significantly correlated with the size of the firm and with the availability of collateral. These two results are aligned with the hypothesis established earlier. Regarding the level of debt (long-term and total), it is significantly and negatively correlated with the market-to-book ratio of the firm and positively correlated with the availability of collateral and with the size of the firm. Once more, these correlations are in accordance with the hypothesis formulated before. One can also
6
According to the 2012 rankings of Market capitalization of listed companies (%GDP), published by The World Bank (http://data.worldbank.org/indicator/CM.MKT.LCAP.GD.ZS?order=wbapi_data_value_2012+wbapi_data_value+wb api_data_value-last&sort=asc)
24
observe that both external financing options are negatively correlated with measures of the financial condition of the company (EBIT/A, EBIT/ie, FCFA and Z-score). Finally, the correlation between LTd/A and CL/PPE is negative and statistically significant7, which might be seen as an indicator of a substitutability relation between these two financing options.
It is also important to check the correlation values among explanatory variables to see if potential multicollinearity problems can arise in the regression analysis, especially between the variables that measure the financial situation of a firm (profitability, debt obligations coverage, Free Cash-Flow and Altman Z-score). Table 8 presents the Person-Correlation values between explanatory variables:
Table 6 - Correlation coefficients (cont.) (refer to Table 4 for the description of the variables)
Statistical significance at the 10% level (*), 5% level (**), and 1% level (***).
The variables EBIT/A, EBIT/ie and FCF/A are significantly and positively correlated, particularly EBIT/A and FCF/A. This, as previously assumed, would be expected since these three are, somehow, measures of the same issue. The variable of Altman Z-score does not present a considerably high correlation with these variables, possibly because its calculation comprises more than one indicator of a firm’s financial condition.
V.6 - Methodology I
As a first step to the understanding and development of the hypotheses and questions postulated, this method consists on splitting the observations in two groups
7 A similar result is achieved if CL/A is used instead of CL/PPE
Log(A) M-to-B PPE/A EBIT/A FCF/A EBIT/ie Z-score R&D/s Log(A) - -0.11*** 0.08*** -0.07*** -0.05*** -0.02 -0.04** -0.04** M-to-B - -0.05*** 0.3*** 0.27*** 0.03** 0.05*** 0.00 PPE/A - -0.02 -0.17*** 0.01 -0.05*** -0.02 EBIT/A - 0.80*** 0.20*** 0.13*** 0.00 FCF/A - 0.14*** 0.14*** -0.05*** EBIT/ie - 0.07*** -0.02 Z-score - 0.08*** R&D/s -
25
for each explanatory variable (lower values and higher values), and observing the average levels of lease financing (CL/PPE) in each group. For each indicator, observed values which are lower than its median are included in one group and observed values higher than its median are included in other group, resulting in two different and equally relevant (in terms of observations) clusters for each firm’s characteristic to be studied. Table 7 displays the results of this analysis.
Table 7 - Methodology I – results (refer to Table 4 for the description of the variables) CL/PPE
(for group with lower values)
Group difference8
CL/PPE (for group with
higher values) Log(A) 5.00% 0.98pp** 4.02% M-to-B 3.90% 0.99pp** 4.89% PPE/A 5.33% 1.68pp*** 3.65% EBIT/A 5.25% 1.62pp*** 3.63% EBIT/ie 5.53% 2.19pp*** 3.34% FCF/A 4.80% 0.67pp* 4.13% Z-score 4.34% 0.4pp* 3.94% R&D/s 3.19% 0.13pp 3.32% LTd/A 4.96% 1.00pp** 3.96%
Statistical significance at the 10% level (*), 5% level (**), and 1% level (***).
By doing this simple division of the sample, one can interpret the results presented in the table above in the following manner: smaller firms use relatively more lease financing than larger firms, firms with more investment opportunities and growth potential present a higher leasing activity than their counterparts and firms with less availability of collateral use relatively more lease financing than firms with more fixed assets. Furthermore, firms in a worst financial situation (lower values of EBIT/A, EBIT/ie, FCF/A and Z-score) are more prone to lease financing than firms in a better financial condition. The lease ratios associated with the variable R&D/s are not significantly different between the two groups. Finally, companies reporting higher levels of long-term debt appear to report fewer leasing activity which suggests a substitutability relationship between these two financing instruments. This first methodological approach can be understood as a good prediction of the results one
26
might achieve in following analysis. According to these values and differences, all of the previously assumed interactions in Section III between a firm’s characteristics and its lease ratios are corroborated and an idea of the relationship between debt and leases emerges.
V.7 - Methodology II
The following section presents the results achieved through pooled OLS and Tobit regressions with the measures related to the corporate liability structure as dependent variables (LTd/A and CL/PPE) and a specific set of explanatory variables, controlling for time, sector and country fixed effects. As previously mentioned, this analysis has the objective to indirectly compare long-term debt financing (excluding capital leases) and lease financing (capital leases), through the study of the influence of firm specific characteristics that have been consistently shown in the existing finance literature, to influence their levels. For the dependent variable of CL/PPE, a Tobit approach is adopted in addition to the standard OLS methodology. Since there are some observations where the value for capital leases is equal to zero, accounting for this problem of a limited dependent variable, (by left censoring values equal to zero) may be necessary. Table 8 displays the results:
Table 8 - Methodology II – results (refer to Table 4 for the description of the variables)
Statistical significance at the 10% level (*), 5% level (**), and 1% level (***). The values in parenthesis are the calculated t-statistics.
Variable LTd/A (OLS) CL/PPE (OLS) CL/PPE (Tobit) Log(A) 0.011*** (2.736) -0.007** (-2.190) 0.005 (1.246) M-to-B 0.000 (-0.157) 0.000 (0.668) 0.000 (0.439) PPE/A 0.077*** (4.913) -0.006 (-0.500) 0.003 (0.240) EBIT/A -0.154*** (-5.216) -0.087*** (-3.655) -0.155*** (-5.359) Intercept 0.159*** (8.485) 0.079*** (5.178) 0.036** (2.083)
Years Yes*** Yes Yes
Sectors Yes** Yes*** Yes***
Countries Yes*** Yes*** Yes***
Adjusted R² 0.125 0.065 -
27
Some interpretations are possible when looking at the results displayed in Table 8. Regarding the size of a firm, the hypothesis was that smaller firms would have a tendency to use relatively more lease financing than larger firms and these would use relatively more debt financing than smaller firms. In relation to the regressions for the capital lease ratios, one can observe that the coefficient for the variable measuring firm size (log(A)) is negative and statistically significant in one of the regressions (OLS). This result suggests that smaller firms do, indeed, show a higher leasing activity than larger firms, confirming the associated hypothesis. A similar negative relationship between firm size and leasing propensity is also reached in several studies such as Barclay and Smith (1995) and Eisfeldt and Rampini (2009). In the long-term debt equation, this variable’s coefficient is positive and statistically significant, suggesting that larger firms use relatively more debt financing than smaller firms. This positive relationship between firm size and use of long-term debt can also be seen in Graham et al. (1998). Firms with higher availability of fixed assets tend to present higher long-term debt levels. The sign of this variable’s (PPE/A) coefficient is positive and significant for the LTd/A regression. This result is aligned with the arguments of a positive relationship between companies’ level of long-term debt and availability of collateral found in Graham et al. (1998). Relative to the lease equations, the coefficients associated with the variable PPE/A are not statistically significant, so no conclusion can be taken. Regarding the profitability levels of a firm (EBIT/A), the values obtained support the pecking order theory (Myers, 1984; Myers and Majluf, 1984), as companies will likely use internal funds as a first financing source and, only afterwards, external financing is considered. As one can see, the coefficients estimated are negative and statistically significant for both the long-term debt and the leases regressions. Regarding the investment opportunity set, no valid conclusions can be taken, as the variable’s (M-to-B) coefficients are not statistically significant in both the debt and lease regressions. In this analysis it was important to include time dummy variables, in order to control for the influences of different macroeconomic and financial conjectures, previously verified, as well as country and sector dummies. The statistical significance evidenced by these dummy groups demonstrates the importance of controlling the analysis for these effects.
Summarizing, smaller firms use relatively more lease financing than larger firms, which prefer debt financing; firms with relatively more fixed assets use more debt, in relative terms; more profitable firms are less leveraged as they take advantage of higher availability of internal funds to finance their operations. Regarding the
28
relationship between long-term debt and leases, this comparative analysis already sheds some light on this matter. Due to the different results obtained for the variables Log(A) (positively related with LT/d and negatively related with CL/PPE) and similar results for the variable EBIT/A (negatively related with both LTd/A and CL/PPE), one could suggest that these two financing options can either be seen as substitutes or as complements, respectively.
V.8 - Methodology III
This third methodological approach will allow for a better understanding of the relationship between debt and lease financing as well as testing the hypothesis proposed, while possibly solidifying the conclusions reached in previous sections.
It could be easily agreed that a company first chooses its overall debt capacity and only then decides on how to fill up this borrowing capacity with different types of debt instruments, like ordinary debt or capital leases. Therefore, an initial OLS equation is estimated with the total debt ratio (D/A) as the dependent variable and with a set of explanatory variables that have been shown to influence firms’ leverage levels. The next step is to estimate the values of D/A for each observation which will be, subsequently, used as one of the explanatory variables on the final regression, with leasing propensity (CL/PPE) as the dependent variable. Two regressions are estimated for the lease (CL/PPE) variable: One uses the OLS approach and the other utilizes the Tobit procedure to control for the problem of a truncated dependent variable. The EBIT/A variable is used to estimate the debt ratio and it is then substituted in the lease regression by an overall and more complete measure of a firm’s financial state, which is the Altman Z-score (Z-score). Recall that a negative relationship is expected, since companies in a better financial situation should find it less necessary and efficient to use lease financing. One variable measuring asset specificity (R&D/s) is added and a negative coefficient is predicted, as firms find it less accessible to lease specific assets than more commonly used assets. This analysis controls for year, sector and country differences. Table 9 presents the estimated results.
29
Table 9 - Methodology III – results (refer to Table 4 for the description of the variables)
Variables D/A (OLS) CL/PPE (OLS) CL/PPE (Tobit) Log(A) 0.022*** (6.034) 0.002 (0.411) 0.009 (1.513) M-to-B 0.000** (2.251) -0.001 (-1.603) -0.001 (-1.620) PPE/A 0.129*** (9.879) -0.015 (-0.566) -0.026 (-0.875) EBIT/A -0.230*** (-8.821) - - Z-Score - -0.001 (-1.366) -0.002** (-2.075) R&D/s - -0.001 (-0.851) -0.001 (-1.557) Intercept 0.158*** (9.684) 0.115*** (3.729) 0.065* (1.872) D/A (estimated) - -0.306* (-1.922) -0.179 (-0.992)
Years Yes*** Yes*** Yes***
Sectors Yes*** Yes** Yes**
Countries Yes*** Yes*** Yes***
Adjusted R² 0.161 0.105 -
Observations 4283 1507 1507
Statistical significance at the 10% level (*), 5% level (**), and 1% level (***). The values in parenthesis are the calculated t-statistics.
Regarding the debt equation, the results obtained for the variables measuring profitability (EBIT/A), availability of collateral (PPE/A) and firm size (Log(A)) might be seen as supportive of the findings in previous analysis. Even though the dependent variables are different (LTd/A first and D/A now), the arguments displayed for the effects of these indicators on firms’ debt levels can be equally applied. Therefore, aligned with the results achieved in Methodology II, the coefficients of Log(A) and PPE/A are positive and significant whereas the coefficient obtained for EBIT/A is negative and significant. The effect of a firm’s investment opportunity set (M-to-B) on its total leverage ratio is not clarified. Even though the value is positive and statistically significant, it is not economically substantial.
Shifting now the focus to the leasing propensity regressions, no statistically significant results were found for the variable Log(A). However, the effect of firm size on firms leasing propensity is consistent with the one obtained in Methodologies I and II. Firms in a better financial condition will use relatively less lease financing than will