WHAT IS THE IMPACT OF THE ACCESS TO EXTERNAL FINANCE ON THE CAPITAL STRUCTURE OF SMEs IN EUROPE?
Inês Carvalho
Dissertation written underthe supervision of Professor Diana Bonfim
Dissertation submittedin partial fulfilment of requirements forthe MScin Management with Majorin Corporate Finance, at Universidade Católica Portuguesa,
WHAT IS THE IMPACT OF THE ACCESS TO EXTERNAL FINANCE ON THE CAPITAL STRUCTURE OF SMEs IN EUROPE?
Inês Firmino de Carvalho 152114341
Abstract
Previous literature has focused on firms’ characteristics to explain changes in capital structure choices. Nevertheless, external capital availability is also an important factor when determining the amount of leverage. Exploring this idea, and using the Survey on Access to Finance of Small and Medium Enterprises (SAFE) as our database, this dissertation examines how the access to external finance impacts changes in the capital structure of SMEs in Europe. The empirical results using a probit model suggest that (i) improvements in firms’ own capital and credit history lead to decreases and increases in leverage levels, respectively, when considering demand conditions. When focusing on supply factors (ii) increases in fees and commissions lead to decreases in leverage, while increases in loan size and loan maturity increase firms’ leverage. Financial constraints have also been analyzed. Considering the failure in external finance applications as a constraint, (i) improvements in own capital have a significant negative impact on unconstrained firms’ leverage, while (ii) increases in loan size and loan maturity has a major positive impact on constrained firms’ leverage.
WHAT IS THE IMPACT OF THE ACCESS TO EXTERNAL FINANCE ON THE CAPITAL STRUCTURE OF SMEs IN EUROPE?
Inês Firmino de Carvalho 152114341
Resumo
A literatura já existente tem-se focado nas características das empresas para explicar as mudanças na escolha da estrutura de capital. Contudo, a disponibilidade do financiamento externo é também um fator importante ao determinar o montante de dívida que a empresa vai contrair. Tendo com consideração este facto, e utilizando o questionário relativo ao acesso ao financiamento de Pequenas e Médias Empresas (SAFE) como base de dados, esta dissertação analisa como o acesso ao financiamento externo influencia as alterações na estrutura de capital das Pequenas e Médias Empresas na Europa. Os resultados empíricos, utilizando um modelo probit indicam que, ao considerar as condições de procura, (i) melhorias no capital próprio e no historial de crédito das empresas levam a diminuições e aumentos no nível da divida, respetivamente. Ao analisar os fatores de oferta, (ii) aumentos das taxas e comissões levam a diminuições no nível da dívida, enquanto aumentos na dimensão e maturidade do empréstimo aumentam o nível de dívida. Restrições financeiras foram igualmente analisadas. Tendo em consideração o insucesso na candidatura ao financiamento externo como uma restrição, (i) melhorias no capital próprio têm um impacto negativo na dívida das empresas sem restrições financeiras, enquanto (ii) aumentos na dimensão e aumento dos empréstimos têm um impacto positivo superior no nível de dívida das empresas restringidas financeiramente.
Professora Diana Bonfim Orientadora
Acknowledgements
Firstly, I would like to express the biggest gratitude to my family, especially to my parents: Ana and Carlos. Without all the support that a child can have nothing of this would be possible. Thank you so much for believing in me, and helping me achieving all the goals I have fought for. Thank you so much for helping me to become a person I am today. To my beloved aunt and god-mother, who is always there no matter what, my warmest thanks.
I would also like to express my gratitude to my supervisor, Professor Diana Bonfim. For the tireless support throughout the semester, the encouragement and all the advices that helped me improving this dissertation, thank you so much.
Finally, I would like to thank to my friends, who have contributed to my personal and academic growth, for all the moments shared. Specially, thank you Diana and Louis. Nevertheless, I would like to thank to my EY colleagues, for all the knowledge shared, all the flexibility and support throughout this demanding semester.
Table of Contents
1. Introduction ... 1
1.1. Capital Structure defined ... 1
1.2. Access to external finance defined ... 1
1.3. Hypothesis development ... 2
1.4. Contribution of the present dissertation ... 3
2. Literature Review ... 5
3. Data and Methodology ... 10
3.1. Data ... 10
3.2. Variables definition ... 10
3.3. Methodology ... 15
4. Empirical Analysis and Results ... 19
4.1. Descriptive statistics ... 19
4.2. Probit and average marginal effects ... 24
4.3. Additional controls ... 28
4.4. Constraints analysis ... 29
5. Robustness... 33
5.1. SMEs dimension analysis... 33
5.2. Access to external finance analysis ... 36
5.3. Country analysis ... 39
6. Conclusions ... 42
7. Limitations and Future Research ... 44
7.1. Limitations ... 44
7.2. Future Research ... 44
8. References ... 45
List of Tables
Table I: General Summmary Statistics ... 20 Table II: Summary Statistics by Constraints ... 22 Table III: Correlation matrix between Capital Structure and Access to External Finance variables ... 23 Table IV: Direct effect of Access to External Finance variables on Capital Structure ... 27 Table V: Regressions results with control variables: probit and average marginal effects .... 28 Table VI: Regressions results based on success on external finance applications: average marginal effects ... 32 Table VII: Regression results without largest firms: probit and average marginal effects .... 35 Table VIII: Regressions results based on access to finance as a pressing problem: average marginal effects ... 38 Table IX: Regressions results based on impact of crisis on European countries: average marginal effects ... 41
List of Appendices
Appendix 1: Variables used to assess the impact of access to external finance on SMEs' capital
structure ... 48
Appendix 2: General Summary Statistics ... 52
Appendix 3: Summary statistics classified by Country ... 54
Appendix 4: Summary statistics classified by Firm Industry ... 55
Appendix 5: Summary statistics classified by Size ... 56
Appendix 6: Correlation matrix between Capital Structure and Access to External Finance variables ... 57
Appendix 7: Regressions used to determine the access to external finance effect on SMEs capital structure: logit model and average marginal effects ... 59
Appendix 7. 1: Direct effect of Access to External Finance variables on Capital Structure: logit and average marginal effects ... 59
Appendix 8: Regressions used to determine the access to external finance effect on SMEs capital structure: probit model and average marginal effects ... 60
Appendix 8. 1: Regressions results with control variables: probit and average marginal effects ... 60
Appendix 8. 2: Regressions results based on success on external finance applications: average marginal effects ... 62
Appendix 9: Regressions used to test the robustness of the results ... 64
Appendix 9. 1: Regression results without largest firms: probit and average marginal effects ... 64
Appendix 9. 2: Regression results based on access to finance as a pressing problem: average marginal effects ... 66
Appendix 9. 3: Regression results for European countries mostly affected by the crisis vs other European countries: average marginal effects ... 68
1. Introduction
The aim of this dissertation is to give continuity to the empirical research that has been developed regarding the firms’ capital structure, exploring one of the main factors behind it, i.e. the access to external finance. Using firm level data from the Survey on Access to Finance of Enterprises (SAFE), which explores how SMEs access external finance in Europe, the main goal of this dissertation is to answer the following problem statement: what is the impact of the access to external finance on the capital structure of SMEs in Europe? SAFE inquiries SMEs regarding the demand and supply factors that affect their access to external finance. Hence, the main research question is then split in two main components: (i) what is the impact of the demand conditions underlying the access to external finance; and (ii) what is the impact of supply conditions imposed to access to external financing, on the capital structure of SMEs. Additionally, SMEs’ financial constraints in access to external finance are taken into consideration, when testing their impact on capital structures.
Firstly, the main concepts explored in this dissertation are defined. Having it clarified, the hypotheses underlying the research question are presented as well as the main contribution of this dissertation.
1.1. Capital Structure defined
Capital structure represents the firms’ choices regarding their capital composition, where firms should balance their debt and equity financing. Even though Modigliani and Miller (1958) have defended the irrelevance of this structure, the market frictions led to consider the benefits and costs of debt when deciding firms’ financing sources. There are several capital structure theories that try to explain how firms execute their financing decisions. Known authors such as Shyam and Myers (1999), Frank and Goyal (2003), and Fama and French (2002) have studied firms’ characteristics to examine them, namely the trade-off and the pecking order theory. Nevertheless, as stated by Myers (2003), there are different factors for different firms under different conditions that limit the applicability of one unique theory.
1.2. Access to external finance defined
External finance, as it indicates, comprises financing sources found outside the firms’ business. Mainly, they are considered through (i) banks, (ii) creditors (e.g. trade credit, factoring or leasing) and (iii) securities. Its access depends usually on (i) demand conditions faced by firms
and (ii) supply side terms. Recent authors have studied how imperfections arising from the capital markets (Titman, 2002), costliness of the information (Faulkender and Peternsen, 2005) or availability of loanable funds (Leary, 2005) influence leverage levels. Hence, complementing the demand characteristics influencing the access to finance, supply-side factors impact on firms’ leverage have also been object of empirical studies.
1.3. Hypothesis development
Recent literature has defended that not only firms’ characteristics impact their capital structure but also the access to external financing. Deviating from the well-known capital structure theories deeply explored in the literature, several studies have separated the supply and demand drivers of credit usage, focusing on the bank and firm roles regarding the credit provision. Namely, Faulkender and Petersen (2005) divides the access to external finance in both (i) supply and (ii) demand side.
Hence, to address the main problem statement of this dissertation, i.e. the impact of the access to external finance on the capital structure of SMEs in Europe, three main hypotheses are presented as below.
Hypothesis 1: Firms’ demand conditions that are relevant to access external finance influence positively their leverage ratios.
Under this hypothesis it is expected that our analysis allows the verification of the following: (i) Leverage ratios increase as firm’s general economic outlook improves, ceteris
paribus
(ii) Leverage ratios increase as firm’s access to public financial support improves, ceteris paribus
(iii) Leverage ratios decrease as firm’s own capital improves, ceteris paribus (iv) Leverage ratios increase as firm’s credit history improves, ceteris paribus
Hypothesis 2: External financing terms and conditions influence negatively leverage ratios. Under this hypothesis it is expected that our analysis allows the verification of the following:
(i) Leverage ratios decrease as interest rate levels increase, ceteris paribus
(ii) Leverage ratios decrease as other costs of financing, such as charges, fees and commissions increase, ceteris paribus
(iii) Leverage ratios increase as the available size of the loan or credit line increase, ceteris paribus
(iv) Leverage ratios increase as the available maturity of the loan increases, ceteris paribus
(v) Leverage ratios decrease as collateral requirements increase, ceteris paribus
The SAFE questionnaire, which explores how the demand and supply factors affect SMEs access to external finance, allows for the separation of the analysis of access to finance in these two factors (Faulkender and Petersen, 2005). The first hypothesis supports the demand side through (i) general economic outlook, (ii) access to public financial support (iii) own capital and (iv) credit history, while the second hypothesis explores the supply side through (i) interest rate level, (ii) fees and commissions, (iii) collaterals, (iv) loan maturity, (v) loan size, and (vi) other conditions. Additionally, the relation between the access to external finance conditions and firms’ financial structure is controlled for using common characteristics that literature has defended as important for capital structures and are questioned in the survey.
Nevertheless, several authors have studied capital structure taking into consideration financial constraints. It has been examined whether financial constrained firms have different capital structures when compared to unconstrained firms, either to study the impact of macroeconomic conditions (Korajczyka and Levy, 2003 and Campello et all, 2010) or through firm-specific characteristics (Leary, 2005). Hence it leads to the third hypothesis raised in this dissertation, as presented below.
Hypothesis 3: External financing influences differently constrained and unconstrained firms’ leverage ratios.
In this specific case, following previous literature findings but considering the data available, the survey allows a specific measure of financial constraints to explore the third hypothesis. SMEs are questioned about their application to external finance, which supports the main goal of this dissertation. Yet, the resulting from the success that firms had in applying for external finance is also surveyed, which turns possible the last hypothesis raised.
1.4. Contribution of the present dissertation
This study adds to the literature by analyzing how the access to external financing, i.e. supply of credit and demand for credit, influences the capital structure of the SMEs considered in the Survey on Access to Finance of Small and Medium Enterprises (SAFE). To our best knowledge, this dissertation is one of the first studies exploring SAFE in order to assess the impact of access to external sources of finance on SMEs’ capital structures.
Hence, the present dissertation contributes to the literature, when exploring SAFE, in the following dimensions. Firstly, it is uses qualitative data to examine a quantitative subject such as capital structure ratios, differentiating the methodology used. Secondly, having access to the questionnaire allows the usage of micro data across countries that is usually difficult to access and usually not comparable.
Moreover, the variation in the firm’s capital structures has been extensively explored through demand factors, i.e. firm’s characteristics. Hence, this study fills the gap by considering credit supply through bank financing terms and conditions but also firms’ conditions to apply to this external finance. Additionally, the survey was conducted during the current period of financial crisis, namely in Europe, where financial constraints are likely to occur, helping the analysis of the topic. The financial crisis opens space to investigate how financial constraints impact corporate behavior and the relevance of macroeconomic conditions on the capital structure of firms.
The remainder of the study is presented as follows. Section 2 provides the literature review. Section 3 examines the data and methodology used. Section 4 discusses the results. Section 5 presents the robustness procedures used. Conclusions are reported in Section 6, while Section 7 refers the main limitations and future research. Finally, Section 8 includes all the references to the present dissertation and Section 9 presents all the tables and additional information to the data, methodology and findings reported.
2. Literature Review
Capital structure is a puzzling subject that has been explored over the decades by numerous authors. Starting with Modigliani and Miller (1958), their theorem defends the irrelevance of financing decisions to both firm value and cost of capital, as long as the main goal is value maximization.
This theorem is supported by two main propositions: (i) the irrelevance of capital structure proposition, which assuming the presence of perfect capital markets states that the value of firms is not affected by the capital structure decisions; and (ii) the linearity between cost of equity and capital structure of firms, meaning that any increase of debt leads to an increase on the cost of equity. According to this, even though debt is a cheaper source of financing, the increase of debt is compensated with an increase in the cost of equity, eliminating the advantage of using leverage.
However, there are several frictions in the market that do not support Modigliani and Miller first assumptions. By assuming perfect capital markets, the theorem led to the exclusion of important realities such as corporate taxes, bankruptcy and agency costs as well as information asymmetry. The access to external finance conditions (both the demand and supply conditions), explored in this dissertation, is also an important factor when considering capital structure decisions. Theories have tried to explain these frictions throughout the decades. Modigliani and Miller (1963) themselves reformulated the theorem, and considered the benefits and costs of debt. This created the basis for the static trade-off theory, which supports the existence of optimal capital structures. According to Myers (1977), there are major forces – the benefits and costs of leverage in firms – that push firms towards an optimal target leverage. Consequently, an optimal capital structure may be reached, where the benefits of an incremental unit of debt will just offset the costs.
The major benefits of debt taken into consideration are the tax-deductibility of debt finance and the reduction of agency problems arising from the manager-shareholder relationship. According to Miller and Scholes (1978), firms with higher expected tax rates, compared to the constant marginal personal cost, have more book leverage. As stated by Miller (1977), personal taxes can offset the benefits of interest deductibility. Moreover, DeAngelo and Masulis (1980) add that firms with non-debt tax-shields have less book leverage, creating an offsetting effect on capital structure.
interests of managers are not aligned with shareholders leading managers to take actions that are not entirely consistent with the goals of the shareholders. Thus, dividends and debt help reducing funds available for managers to spend, becoming substitutes for the control of free cash flow agency problems. Firms with more profitable assets have higher dividend payouts and more leverage, when controlling for investment opportunities. Likewise, firms with larger profitable investments have lower dividend payout and leverage, when controlling for profitability.
On the other hand, the costs of leverage include the agency costs of financial distress, i.e., bankruptcy costs and agency conflicts from the stockholder-bondholder relationship. The trade-off theory defends that more profitable firms have more book leverage, whereas firms with variable earnings have less book leverage. Therefore, when profitability declines the expected bankruptcy costs rise pushing less profitable firms to lower leverage targets. Lastly, with respect to stockholder-bondholder agency problems, Fama and Miller (1972), Jensen and Meckling (1976) and Myers (1977) also defend that firms with more expected investments have lower dividend payouts and less current leverage.
Corporate finance literature has corroborated these predictions. Several studies provide direct evidence demonstrating that firms adjust their capital structure towards a target leverage. Marsh (1982) and Auerbach (1985), using a logit model, have found evidence that firms adjust towards a target debt ratio. Likewise, Taggart (1977), Jalilvand and Harris (1984) and Opler and Titman (1994) through target-adjustment models have reached the same conclusions. Nevertheless, there are also evidence from other authors demonstrating inconsistencies with the target debt ratios. Kester (1986), Long and Malitz (1985), Titman and Wessels (1988), Rajan and Zingales (1995) and Fama and French (2002) identified corporate profits as a major drawback of the trade-off theory. It finds negative relationships between debt ratios and profitability. Likewise, Myers (1984) highlights that tax effects seem to be empirically weak and Bradley et al. (1984) a strong direct relation between firm leverage and the relative amount of non-debt tax shields. Hence, the inconsistency between authors as well as adverse selection and the transaction costs of issuing securities leads to an alternative theory, the pecking order theory.
The pecking order theory suggests a hierarchical preference regarding the financing sources. Firms prefer first the use of internal funds to the use of external funds, since it prevents the asymmetric information between managers and less-informed outside investors (Myers and Majluf, 1984) and the high costs associated with new issues (Myers, 1984). Once retained earnings are exhausted, firms prefer to issue debt. Inside investors consider retained earnings a
better source of financing than debt, but debt a better option regarding equity. It contains less asymmetry of information and is considered less risky, offering outside investors lower rates of return on debt than on equity. Lastly, when debt is no longer an option, equity is issued. Thus, leverage is not determined by the costs and benefits of debt, characteristic of the trade-off model but by the net cash flows produced by the firm. According to Myers (1984), when controlling for investment opportunities, firms with more profitable assets have higher long-term dividend payouts and less leverage. When controlling for profitability, firms with more investments have lower long-term dividend payouts and more leverage.
Shyam and Myers (1999), supporting the pecking-order theory, are recognized by the testing strategy implemented in both theories, the trade-off model and the pecking order theory. The idea is not to test a model of capital structure options that could influence it but focus on the specifications of both theories. Once defined, these are used to test the target leverage, the mean reversion of leverage and the short-term response of dividends and debt to variation in earnings and investment.
In fact, several authors have tested various models, which include a variety of hypothesis together in the empirical tests, in order to identify the major determinants of capital structure. Titman and Wessels (1988), who included all the hypothesis jointly in the empirical tests, found that leverage decreases with uniqueness, firm size and past profitability. However, there was no support regarding non-debt tax shields, volatility, collateral value or future growth. On the other hand, Harris and Raviv (1991), who explain the conventional range of variables, conclude that leverage increases with fixed assets, non-debt tax shields, growth opportunities, and firm size and decreases with volatility, advertising expenditures, research and development expenditures, bankruptcy probability, profitability and uniqueness of the product. Several other authors tested the numerous factors that could explain the capital structure and eventually support the theories mentioned above. However, as mentioned by Frank and Goyal (2003) excluding them is an important omission but including all of them leads to tough tests for the pecking order theory.
Nevertheless, the pecking order model is a competitor to other explanatory models of capital structure, i.e. the market timing theory. According to Baker and Wurgler (2002), managers evaluate market current conditions and raise funds – debt or equity – in those that seem more favorable to them. Firms tend to issue more equity when its cost is low, issuing debt otherwise. Even though it does not consider the traditional factors described above, it takes into
consideration the access to external finance conditions (i.e. the supply side conditions such as the cost of the external finance options).
Finally, capital structure is a continuous research topic. Different authors support different views. As stated by Myers (1984), if we require the pecking order theory to explain everything, it will be easily rejected. There is no universal capital structure theory but conditional theories, highlighting important factors for different firms in different circumstances (Myers, 2003). According to Korajczyka and Levy (2003), the variation in macroeconomic conditions can lead firms to adopt different capital structures at different points in time. Considering financial constraints, i.e. not having enough cash to undertake investment opportunities and facing severe agency costs when requesting external financing, it shows that unconstrained firms are more sensitive to variations in macroeconomic conditions. Unconstrained firms deviated from their “target” to time their issues when market conditions are more favorable, while constrained firms were more sensitive to deviations from the target leverage. Moreover, it demonstrates that unconstrained firms have counter-cyclical leverage, while constrained firms’ leverage varies pro-cyclically with macroeconomic conditions. Campello et al (2010) show that constrained firms tend to use internal funding and concentrate in getting credit from banks, to deal with the financial crisis and preparing for limited access to credit in the future, respectively.
Hence, both firm-specific factors and macroeconomic conditions lead to variations on financing choices, which also change according to firm’s financial market access. The market frictions that highlight capital structure choices – information asymmetry – also lead firms to be restricted by their lenders (Stiglitz and Weiss, 1981). Not only the demand side characteristics but also the supply side conditions (such as the cost of debt and leverage availability), explored in this dissertation, are important when defining the capital structure of firms. According to Leary (2005), supply frictions in the credit markets are relevant for the firms’ capital structures and firms do change the composition of financing sources in response to limited credit. Small, bank-dependent firms decreased their leverage following negative loan supply shocks.
Thus, debt ratios should depend also on access to external sources of capital. When considering firm’s capital structure, both the determinants of preferred leverage (demand side) and constraints on the capacity to increase leverage (supply side) should be considered (Faulkender and Petersen, 2005).
Summing up, capital structure has been studied by several authors that support different approaches in order to explain firm’s financing choices. The inconsistency between empirical
results leads to the acceptability of different theories – namely, the trade-off and pecking order theory – to explain capital structures. As Harris and Raviv’s (1991) conclude, the reasons and conditions that determine the capital structure choices are almost countless. However, the market frictions and the empirical periods selected among others have been pointed out as an important factor of analysis. Macroeconomics factors have highlighted the importance of financial constraints in shaping the capital structure of firms.
Hence, taking into consideration the questionnaire on access to finance of SMEs in Europe (SAFE)1 this dissertation aims to test how the access to external finance influence the capital structure of European SMEs.
3. Data and Methodology
This section starts with the description of the data used in this study. Then based on the sample chosen, the defined variables are explained as well as the hypotheses behind them. Lastly, the methodology used to test the hypotheses is presented.
3.1. Data
For this analysis the Survey on Access to Finance of Small and Medium Enterprises (SAFE), in Europe was used.
The European Central Bank (ECB) has conducted the SAFE survey in half-yearly waves since 2009. Its main goal is to assess the financing needs of SMEs, their practice in accessing external finance and their perceptions regarding current economic and financial conditions. Hence, it conducts an array of questions that allows the separation between the supply and demand factors affecting the access to finance. For the supply side, terms and conditions of bank financing were considered, i.e. interest rate level, fees and comissions, collateral requirements, size of the loan and maturity of the loan. Regarding the demand side, factors affecting the availability of external finance were considered, i.e. firm’s general economic outlook, access to public financial support, firm’s own capital and their credit history.
The database, covering a period from 2009 to 2015, does not include the same observations, i.e. SMEs across Europe comprised in the survey, each year. Hence, this dissertation considers as sample the first wave conducted in 2015, which includes 17.979 observations. Nevertheless, since the main goal is to assess the impact of access to external finance the sample was redefined in order to capture only firms that had applied for this type of financing in the last 6 months, according with the date of the survey. Hence it includes (i) bank loan, (ii) credit line, bank overdraft or credit overdraft, (iii) trade credit or (iv) other external finance applications. After these exclusions, a final sample is left with 16.916 firms.
3.2. Variables definition
Given that the idea is to examine how the access to external finance impact firms’ capital structure, a range of variables that can represent the supply and demand side of external finance are considered in order to discuss the possible impact on capital structure. The database selected for this study comprises 24 variables, which were created based on the SAFE questions. Below we describe all the variables – dependent, independent and control – used in this analysis, while in Appendix 1 we present the details on their definitions.
Dependent variables
In order to analyze the changes on SMEs capital structures, the following variables are used as proxies.
DebtoAssets is the increase of firms’ debt compared to assets over the past 6 months according with the date of the survey. The ratio of debt to total assets is the common variable to assess firm’s leverage, which indicates the proportion of assets that are financed with debt. Moreover, Shyam and Myers (1999), Fama and French (2002) and Frank and Goyal (2003) use the variation of this ratio to analyze capital structure theories, such as trade-off and pecking order theory. Since the data is taken from a survey, this represents the best proxy to assess variation in firms’ leverage.
BankLoan is the raise of a new loan or a renewal of the loan over the past 6 months according with the date of the survey. When considering external finance, several external sources of financing, from internal funds to trade credit were questioned. Bank debt represents one of the most common costly external sources of financing. Even though it is included in DebtoAssets, this variable aims to represent solely its effect.
Explanatory variables
In order to explain changes in SMEs capital structure we should take into account both demand and supply factors according with SAFE, i.e. factors affecting the availability of external finance and terms and conditions of bank financing, respectively. Regarding the latter, the idea is to include the frictions firms have encountered when trying to access external finance, as performed by Campello, Graham and Harvey (2010). Hence, variables are divided into the following two main categories:
(i) Demand conditions proxies
Several questions were asked about external financing availability and willingness of external partners to provide financing. However, the “availability” is influenced by firms’ performance and historical behaviors. Hence, firm’s factors affecting financing availability were taken into consideration:
GenEconOutlook is the firm’s perspective regarding the change in its general economic outlook. It is a dichotomous variable that assumes 1 if it improved over the last 6 months before
the questionnaire. Yet, it assumes 0 if its general economic outlook perspective remained unchanged or deteriorated during the same period.
AccessPubFin represents the access to public financial support, over the past 6 months according with the date of the survey. It is also a dichotomous variable that assumes 1 if it improved over the last 6 months before the questionnaire. Yet, it assumes 0 if the access to public finance remained unchanged or deteriorated during the same period. According to Faulkender and Petersen (2005), firms without access to public debt markets are constrained by private lenders in the amount they can rise, resulting in lower debt ratios.
OwnCapital represents the improvement of the firm’s own capital, over the past 6 months according with the date of the survey. It is a dichotomous variable that assumes 1 if it improved over the last 6 months before the questionnaire. Yet, it assumes 0 if its own capital remained unchanged or deteriorated during the same period.
CreditHist represents the improvement of the firm’s credit history, over the past 6 months according with the date of the survey. It is a dichotomous variable that assumes 1 if it improved over the last 6 months before the questionnaire and 0 otherwise, i.e. remained unchanged or deteriorated over the same period.
(ii) Bank loan supply proxies
Supply side drivers can affect credit conditions, without being directly related with the borrower’s characteristics. Here terms and conditions of bank financing (i.e. bank loans, overdrafts and credit lines) are used as proxy variables.
IntRate represents the change of the level of interest rates over the past 6 months according with the date of the survey. It is a dichotomous variable that assumes 1 if it increased over the last 6 months before the questionnaire and 0 otherwise, which means remaining unchanged or decreasing during the same period.
FeesandComiss is an extension of the costs of financing besides interest rates. Here the change of the level of charges, fees and commissions are considered. It is also a dichotomous variable that assumes 1 if it increased over the last 6 months before the questionnaire and 0 otherwise. Collat are the changes on the collateral requirements demanded over the past 6 months according with the date of the survey. Therefore, if banks have increased their collateral demands to provide finance the variable equals to 1, and 0 otherwise.
LoanMat refers to the change in the maturity of the loan over the past 6 months according with the date of the survey. It is a dichotomous variable that assumes 1 if the loan maturity’s availability increased over the last 6 months before the questionnaire. Yet, it assumes 0 if its availability remained unchanged or decreased during the same period.
LoanSize refers to the change in the size of the loan over the past 6 months according with the date of the survey. It is a dichotomous variable that assumes 1 if the loan size increased over the last 6 months before the questionnaire. Yet, it assumes 0 if it remained unchanged or decreased during the same period. Leary (2005) defends that firms without access to public debt markets need substitute sources of capital when loan supply reduces. These replacements result in relatively lower leverage following loan supply contractions.
OtherCond represents specific requirements to access external financing, specifically bank loans. Thus, it indicates whether required guarantees, information requirements, procedures, time required for loan approval or loan covenants increased over the past 6 months. As a dichotomous variable, if these requirements increased, it equals to 1. If these requirements remained unchanged or decreased, this variable equals to 0.
Control variables
To determine the relationship between the change in leverage and the access to external finance, i.e. the supply and demand effects described above, it is important to control for other firm characteristics that may influence leverage ratios (Faulkender and Petersen, 2005).
There are several characteristics studied in the literature that are also present in the SAFE questionnaire. By including these nominal variables, it is possible to control for determinants of leverage that are common within characteristics of firms.
Country is a nominal variable that represents the country where each firm is based. Since the survey considers the 28 countries in Europe, countries were selected based on G8, the eight most industrialized countries that meet to discuss global issues, along with their size. Hence, France, Germany, Italy and United Kingdom were considered together with Spain and Portugal. Industry is a nominal variable that can assume, according with the survey division the following activities: Industry (Mining and Manufacturing), Construction, Trade (Wholesale and Retail Trade), Services (Transport, Real State, Other Services) or Other Activities.
Thus, according to the survey answers, it can assume the following owners: Public shareholders, Family or entrepreneurs, Venture Capital Enterprises or Business Angels, One owner only, or lastly Other enterprises or business associates.
Maturity is a nominal variable that represents how old is the firm, i.e. it works as a measure of maturity of firms. Then, according to the survey options to the question, it can assume the following ranges: Old (10 years or more), Middle (5 years or more but less than 10 years), Young (2 years or more but less than 5 years) or Startup (Less than 2 years).
Size is a nominal value that represents the number of employees the enterprise employs either full or part time in all of its locations. Thus, the number of employees is used as a proxy for size and can assume the following dimensions: Micro (1-9 employees), Small (10-49 employees), Medium (50-249 employees) or Large (250+ employees). Historically leverage has been positively correlated with size (Harris and Raviv, 1991; Fama and French, 2002; Frank & Goyal, 2003). Likewise, according to Faulkender and Petersen (2005), small private firms, with the less public information are more credit constrained.
Profit is a dichotomous variable that represents changes in profit (net income after taxes) over the last 6 months before the questionnaire. As a dichotomous variable, if profitability increased, profit equals to 1. If it remained unchanged or decreased, this variable equals to 0. Profitability is an important characteristic when studying capital structures, since it either supports the trade-off or the pecking order theory. Hence, recognized authors such as Myers (1977) support the positive correlation between leverage and profit until it reaches an optimal target leverage. However, several authors defend that more profitable firms have lower leverage (Titman and Wessels, 1988; Harris and Raviv 1991; Fama and French, 2002; Frank & Goyal, 2003). FixedInvest is a dichotomous variable that represents changes in firm’s fixed investment – investment in property, plant, machinery or equipment – over the last 6 months before the questionnaire. Therefore, it assumes 1 if it increased over the last 6 months before the questionnaire. Yet, it assumes 0 if fixed investment remained unchanged or decreased during the same period. Investment is widely considered by literature, but different proxies are used leading to conflicting evidence regarding the relation between investment and leverage (Fama and French, 2002). Hence, according with Harris and Raviv (1991) and Fama and French (2002), investments or expected investments are negatively related with leverage. Moreover, since it includes investment in tangible assets, it can measure firm’s assets tangibility as performed by Faulkender and Petersen (2005). Firms with more tangible assets are more likely to have higher debt ratios (Harris and Raviv, 1991; Shyam and Myers, 1999; and Frank and
Goyal, 2003).
IWC is a dichotomous variable that represents changes in inventories and working capital over the last 6 months before the questionnaire. The variable assumes 1 if it increased over the last 6 months before the questionnaire and 0 otherwise, i.e. remained unchanged or decreased over the same period.
UnconstDebt is a dichotomous variable, which represents a successful application to external sources of finance, i.e. (i) bank loan, (ii) credit line, bank overdraft or credit line overdraft, (iii) trade credit or (iv) other external finance. Hence, the variable takes 1 if the firm succeeded in getting at least one of the finance sources and 0 otherwise. Numerous authors have defined constraints as a driver to analyze the sample selected (Korajczyka and Levy, 2003; Campello et all, 2010). Several criteria can be used according to the purpose of the study and the data available. However, the SAFE question itself characterized financial constrained firms. After excluding companies that did not apply to external finance, firms that succeed in applying to at least one external finance source were considered as unconstrained, and constrained otherwise. AccesstoFin is a dichotomous variable that represents how SMEs consider, from 1 to 10, “Access to Finance” as the most pressing problem. The variable assumes “1” if firms select “Access to Finance” as their most pressing problem between 1 and 5, and “0” if firms select “Acess to Finance” as the most pressing problem between 6 and 10.
CrisisCountries is a dichotomous variable generated to classify SMEs based on their countries macroeconomic conditions. The variable assumes “1” if the categorical variable country assumes “Greece”, “Italy”, “Ireland”, “Portugal” or “Spain”; and “0” otherwise, i.e. other countries that were not extremely influenced by the crisis.
NoLarge is a dichotomous variable created to classify SMEs according with their size. The variable assumes “1” if the categorical variable size assumes “Micro”, “Small”, or “Medium”; and “0” if size is “Large”.
3.3. Methodology
To assess how the access to external financing impacts the capital structure of SMEs across Europe, testing the hypothesis formulated above, several regressions were created and tested. The basis is a general linear regression, which aims to examine how the access to external financing impacts the capital structure of SMEs across Europe. Thus, firms’ leverage variables
(DebtoAssets and BankLoan) are considered a function of access to market capital variables, i.e. demand conditions (GenEconOutlook, AccessPubFin, OwnCapital and CreditHist) and bank loan supply (IntRate, FeesandComiss, Collat, LoanMat, LoanSize and OtherCond). A set of control variables (Country, Industry, Ownership, Maturity, Size, Profit, FixedInvest, and IWC) is also considered.
Firstly, regressions were run as stated below.
𝐷𝑒𝑏𝑡𝑜𝐴𝑠𝑠𝑒𝑡𝑠𝑖 = 𝛼 + 𝛽1𝐺𝑒𝑛𝐸𝑐𝑜𝑛𝑂𝑢𝑡𝑙𝑜𝑜𝑘𝑖+ 𝛽2𝐴𝑐𝑐𝑒𝑠𝑠𝑃𝑢𝑏𝐹𝑖𝑛𝑖+ 𝛽3𝑂𝑤𝑛𝐶𝑎𝑝𝑖𝑡𝑎𝑙𝑖+ 𝛽4𝐶𝑟𝑒𝑑𝑖𝑡𝐻𝑖𝑠𝑡𝑖 + 𝛽5𝐼𝑛𝑡𝑅𝑎𝑡𝑒𝑖 + 𝛽6𝐹𝑒𝑒𝑠𝑎𝑛𝑑𝐶𝑜𝑚𝑖𝑠𝑠𝑖+ 𝛽7𝐶𝑜𝑙𝑙𝑎𝑡𝑖 + 𝛽8𝐿𝑜𝑎𝑛𝑀𝑎𝑡𝑖+ 𝛽9𝐿𝑜𝑎𝑛𝑆𝑖𝑧𝑒𝑖+ 𝛽10𝑂𝑡ℎ𝑒𝑟𝐶𝑜𝑛𝑑𝑖+ 𝛽11𝐹𝑖𝑟𝑚𝐶𝑜𝑛𝑡𝑟𝑜𝑙𝑉𝑎𝑟𝑖𝑎𝑏𝑙𝑒𝑠𝑖 (1) 𝐵𝑎𝑛𝑘𝐿𝑜𝑎𝑛𝑖 = 𝛼 + 𝛽1𝐺𝑒𝑛𝐸𝑐𝑜𝑛𝑂𝑢𝑡𝑙𝑜𝑜𝑘𝑖+ 𝛽2𝐴𝑐𝑐𝑒𝑠𝑠𝑃𝑢𝑏𝐹𝑖𝑛𝑖+ 𝛽3𝑂𝑤𝑛𝐶𝑎𝑝𝑖𝑡𝑎𝑙𝑖+ 𝛽4𝐶𝑟𝑒𝑑𝑖𝑡𝐻𝑖𝑠𝑡𝑖 + 𝛽5𝐼𝑛𝑡𝑅𝑎𝑡𝑒𝑖 + 𝛽6𝐹𝑒𝑒𝑠𝑎𝑛𝑑𝐶𝑜𝑚𝑖𝑠𝑠𝑖+ 𝛽7𝐶𝑜𝑙𝑙𝑎𝑡𝑖 + 𝛽8𝐿𝑜𝑎𝑛𝑀𝑎𝑡𝑖+ 𝛽9𝐿𝑜𝑎𝑛𝑆𝑖𝑧𝑒𝑖+ 𝛽10𝑂𝑡ℎ𝑒𝑟𝐶𝑜𝑛𝑑𝑖+ 𝛽11𝐹𝑖𝑟𝑚𝐶𝑜𝑛𝑡𝑟𝑜𝑙𝑉𝑎𝑟𝑖𝑎𝑏𝑙𝑒𝑠𝑖 (2)
SAFE has a range of questions that allowed the definition of these variables but they are limited by areas of interest, which influences their relevance regarding different external sources of financing. Thus, even though the variables that represent the access to external finance, i.e. the supply and demand side, both try to explain the SMEs capital structure, they revealed to be more appropriate depending on the dependent variable.
Hence, in a second version of the regressions proposed that will be considered across the remaining dissertation, the regressions models convert to:
𝐷𝑒𝑏𝑡𝑜𝐴𝑠𝑠𝑒𝑡𝑠𝑖 = 𝛼 + 𝛽1𝐺𝑒𝑛𝐸𝑐𝑜𝑛𝑂𝑢𝑡𝑙𝑜𝑜𝑘𝑖+ 𝛽2𝐴𝑐𝑐𝑒𝑠𝑠𝑃𝑢𝑏𝐹𝑖𝑛𝑖+ 𝛽3𝑂𝑤𝑛𝐶𝑎𝑝𝑖𝑡𝑎𝑙𝑖+
𝛽4𝐶𝑟𝑒𝑑𝑖𝑡𝐻𝑖𝑠𝑡𝑖 + 𝛽5𝐹𝑖𝑟𝑚𝐶𝑜𝑛𝑡𝑟𝑜𝑙𝑉𝑎𝑟𝑖𝑎𝑏𝑙𝑒𝑠𝑖 (3) 𝐵𝑎𝑛𝑘𝐿𝑜𝑎𝑛𝑖 = 𝛼 + 𝛽1𝐼𝑛𝑡𝑅𝑎𝑡𝑒𝑖+ 𝛽2𝐹𝑒𝑒𝑠𝑎𝑛𝑑𝐶𝑜𝑚𝑖𝑠𝑠𝑖 + 𝛽3𝐶𝑜𝑙𝑙𝑎𝑡𝑖+ 𝛽4𝐿𝑜𝑎𝑛𝑀𝑎𝑡𝑖 +
𝛽5𝐿𝑜𝑎𝑛𝑆𝑖𝑧𝑒𝑖+ 𝛽6𝑂𝑡ℎ𝑒𝑟𝐶𝑜𝑛𝑑𝑖+ 𝛽9𝐹𝑖𝑟𝑚𝐶𝑜𝑛𝑡𝑟𝑜𝑙𝑉𝑎𝑟𝑖𝑎𝑏𝑙𝑒𝑠𝑖 (4)
As observable, the variables that represent the demand and supply side are not considered in both regressions proposed. The demand side relate to the conditions that influence the access to external finance in general, which in this dissertation will try to explain DebtoAssets (the debt variables that comprise the several possibilities of financing). The supply side as
mentioned above relate to the terms and conditions to raise bank loans, implying their relevance in explaining a specific type of debt also considered, i.e. BankLoan variable.
Regarding the estimators used, the OLS estimators, one of the most common regression methodologies, allows the inclusion of binary or categorical variables on the right side of the regressions. However, it is a linear probability model, whose errors (i.e. residuals) disrupt the homoscedasticity and normality of errors assumptions, when using binary dependent variables. The binary nature of variables, inducing heteroscedasticity, results in invalid standard errors and hypothesis tests.
Therefore, the most standard regression alternatives are either the probit or the logistic/logit estimators. Even though the distributional assumptions are vaguely different (i.e. involving either a normal or logit distribution, respectively), both models are maximum likelihood estimators, leading to similar results. Specifically, while the probit coefficient refers to the likelihood of the dependent variable being equal to “1”, with a one percent increase in the independent variable; the logit refers the log odds of the dependent variable being equal to “1”, with a one unit increase in the independent variable. Still, through an additional command, the logit reports also the “odds”, i.e. the ratio of the probability of success and the probability of failure for a given independent variable regarding its effect on the dependent variable. Thus, since both dependent variables are dichotomous, a probit and logit model are used to estimate the two regression models considered, at first. Additionally, they are both controlled for heteroscedasticity with the robust option provided by Stata.
Nevertheless, the marginal impact of the independent variable’s change is not constant. While in the OLS estimator the marginal effect is the same at every observation of a specific variable (the slope of the regression line remains constant for each observation), the probit and logit estimators refer to an unobserved dependent variable. The only interpretation we can take is the direction of the average effect. Hence, a marginal analysis is performed, allowing the interpretation of the predicted probability of the dependent variable given the coefficient of the variable of interest. By default, Stata reports Marginal effects at the Means, i.e. the marginal effect of one variable at the other independent variables’ mean.
However, this dissertation considers the Average Marginal Effects. Instead of considering the other variables at their average values (i.e. considering the average of dummy variables), it compares for each specific variable two hypothetical populations (the one assuming “1” and the one assuming “0”) that have the same values on the remaining independent variables. Thus,
the cause of the differences in the likelihood of the dependent variable (e.g. DebtoAssets or BankLoan).
4. Empirical Analysis and Results 4.1. Descriptive statistics
The tables presented below include general summary statistics (Table I), summary statistics by constraints (Table II), as well as the correlation coefficients (Table III). Nevertheless, summary statistics by Country (Appendix 3), Firm industry (Appendix 4) and Size (Appendix 5) are also mentioned and presented in the appendix.
Taking into consideration the general summary statistics (Table I), Panel A, which presents the capital structure variables, demonstrates that only 14,5% of SMEs have increased their proportion of debt to assets. However, BankLoan have increased in 42,7% of SMEs. Hence, it is important to understand that the capital structure proxy variable, i.e. DebtoAssets, includes not only bank loans but also other components such as trade credit and credit overdraft, and not all the firms in the sample took new loans or draw on credit lines, bank overdraft or credit cards overdraft in the period of analysis.
From Panel B, which represents the access to external finance variables, it is possible to see from the supply side that its terms and conditions have not increased for most SMEs in Europe. FeesandComiss stands out as the variable where more firms (28,0%) revealed that have increased in the last 6 months before the questionnaire. The size of the loan, proxied by LoanSize, other conditions (i.e. guarantees, information requirements, procedures, time required for loan approval or loan covenants) proxied by OtherCond and collaterals, proxied by Collat are the subsequent variables that increased the most among firms. Regarding the demand side, the firms’ own capital reveals to be the variable in which more firms reported an improvement in the last 6 months before the questionnaire (30,4%). Even with low percentages among firms, improvements in credit history, proxied by CreditHist and general economic outlook, proxied by GenEconOutlook, are the highest after OwnCapital.
In Panel C, where control variables are considered, profit, fixed investment and inventories and working capital are highlighted since the remaining control variables are categorical variables that will be analyzed below. Hence, it is possible to conclude that 34,4%, 28,7% and 22,3% of firms have increased their profits, fixed investment, and inventories and working capital, respectively.
Table I
Table I
General Summary Statistics
Table I reports the descriptive statistics for the variables used in the regression analysis, aggregated into panels. Panel A presents the changes of capital structure proxies for SMES in Europe. Panel B contains the variables that try to explain the impact of access to external finance on capital structure, both the supply and demand side. Panel C includes also the control variables considered influential on capital structure of firms by literature (Profit, FixedInvest, IWC). For the sake of simplicity, this table does not display all the control variables considered in the regressions, but they all are presented in Appendix 2. The summary statistics are presented as follows: number of observations, mean, standard deviation, minimum and maximum values, kurtosis, skewness, and quartiles 25, 50, 75 and 90.
Variables Obs. Mean St. Dev. Min Max Kurtosis Skewness p25 p50 p75 p90
Panel A: Capital Structure Variables
DebtoAssets 16 916 0,1452 0,3524 0 1 5,0547 2,0136 0 0 0 1
BankLoan 8 176 0,4267 0,4946 0 1 1,0877 0,2963 0 0 1 1
Panel B: Access to External Finance
GenEconOutlook 16 916 0,2231 0,4163 0 1 2,7694 1,3302 0 0 0 1 AccessPubFin 16 916 0,0701 0,2552 0 1 12,3504 3,3690 0 0 0 0 OwnCapital 16 916 0,3044 0,4602 0 1 1,7224 0,8499 0 0 1 1 CreditHist 16 916 0,2521 0,4342 0 1 2,3034 1,1417 0 0 1 1 IntRate 4 878 0,1501 0,3572 0 1 4,8405 1,9597 0 0 0 1 FeesandComiss 4 878 0,2798 0,4490 0 1 1,9622 0,9809 0 0 1 1 LoanSize 4 878 0,2386 0,4263 0 1 2,5041 1,2264 0 0 0 1 LoanMat 4 878 0,1015 0,3020 0 1 7,9675 2,6396 0 0 0 1 Collat 4 878 0,2015 0,4012 0 1 3,2147 1,4882 0 0 0 1 OtherCond 4 878 0,2271 0,4190 0 1 2,6964 1,3025 0 0 0 1
Panel C: Control Variables
Profit 16 916 0,3441 0,4751 0 1 1,4310 0,6565 0 0 1 1
FixedInvest 16 916 0,2871 0,4524 0 1 1,8862 0,9414 0 0 1 1
When summarizing variable statistics by country (Appendix 3), most observations come from Germany, France and Italy. Regarding the access to external finance variables, (i) the demand variables that have the major improvements among countries are GenEconOutlook and CreditHist; while (ii) the supply variables with the major increases among countries are FeesandComiss and LoanSize. Considering summary statistics by industry (Appendix 4), most of SMEs are from Trade and Services sectors. Nevertheless, DebtoAssets and BankLoan report similar increase frequency between sectors. When analyzing the access to external finance variables, (i) in the demand side variables, OwnCapital has the highest number of improvements together with CreditHist; while (ii) the supply variables that have increased the most are FeesandComiss and OtherCond. Regarding the SMEs’ size, summary statistics (Appendix 5) suggest that most of SMEs surveyed are micro, followed by small and medium firms. This is consistent with the fact that large firms are included only as a small control group. Nevertheless, DebtoAssets and BankLoan, as dependent variables, present more increases for large and medium sizes. Considering the access to external finance variables, (i) the demand side presents OwnCapital and CreditHist as the variables with the larger improvements across size categories; while (ii) for the supply variables of interest, the variables that have increased the most are FeesandComiss and OtherCond.
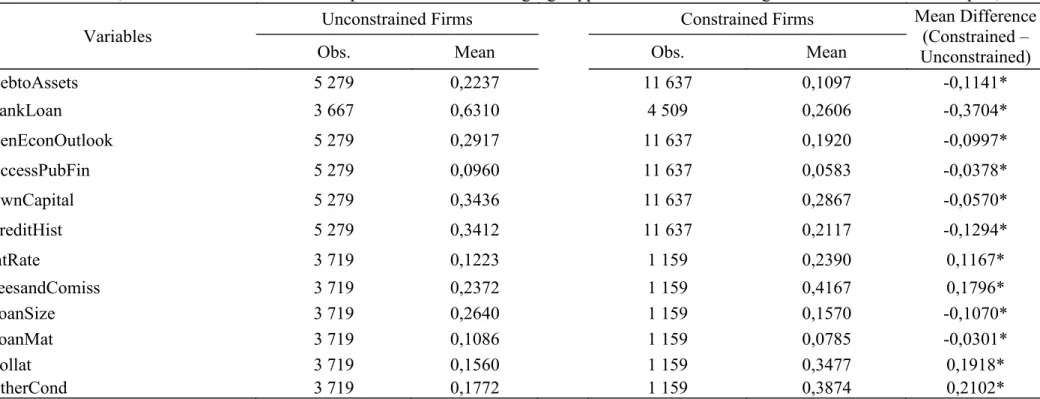
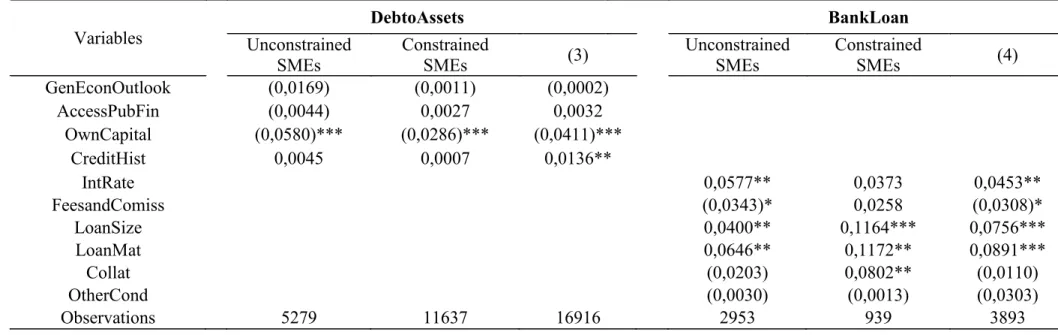
Finally, the third hypothesis of this dissertation aims to understand how the access to external finance varies with financial constraints. In order to analyze it, the sample used in this dissertation is split in two sub-samples: (i) Unconstrained SMEs and (ii) Constrained SMEs, based on SMEs’ success in their application to external sources of financing. Hence, from Table II, it is possible to understand that the sample contains more constrained firms than unconstrained firms. As expectable, unconstrained firms increase on average more 11,4% leverage than constrained firms, when measured throughout DebtoAssets, and 37% more, when considering BankLoan. When analyzing the access to external finance variables, the demand side highlights OwnCapital and CreditHist as the variables with more improvements for both unconstrained (34,4% and 34,1%, respectively) and constrained (28,7% and 21,2%, respectively). Nevertheless, these variables have improved less for constrained firms, as could be expected. Regarding the supply side, FeesandComiss is the variable with more increase frequency, both for unconstrained (23,7%) and constrained (41,7%) firms. With the same reasoning, fees and commissions increased more for constrained firms, as expected given their condition.
Table II
Table II
Summary Statistics by Constraints
Table II presents the changes in the capital structure proxy (DebtoAssets and BankLoan) as well as the access to external finance explanatory variables. Both variables that are a proxy for the demand side (GenEconOutlook, AccessPubFin, OwnCapital and CreditHist) and supply side (IntRate, FeesandComiss, LoanSize, LoanMat, Collat and OtherCond) are presented. The number of observations and the mean values are presented for these variables, according to the firms constraints. The subgroups Unconstrained and Constrained firms define how successful firms were in getting the external finance they applied for, i.e. (i) bank loans, (ii) credit line, bank overdraft or credit line overdraft, (iii) trade credit or (iv) other external finance. Hence, Unconstrained firms were successful in getting at least one source of external finance. The coefficients’ significance was tested with a t-test, whose mean-difference is also presented. The following sign applies for the statistical significance of coefficients: * p<0,01.
Variables Unconstrained Firms Constrained Firms Mean Difference (Constrained –
Unconstrained)
Obs. Mean Obs. Mean
DebtoAssets 5 279 0,2237 11 637 0,1097 -0,1141* BankLoan 3 667 0,6310 4 509 0,2606 -0,3704* GenEconOutlook 5 279 0,2917 11 637 0,1920 -0,0997* AccessPubFin 5 279 0,0960 11 637 0,0583 -0,0378* OwnCapital 5 279 0,3436 11 637 0,2867 -0,0570* CreditHist 5 279 0,3412 11 637 0,2117 -0,1294* IntRate 3 719 0,1223 1 159 0,2390 0,1167* FeesandComiss 3 719 0,2372 1 159 0,4167 0,1796* LoanSize 3 719 0,2640 1 159 0,1570 -0,1070* LoanMat 3 719 0,1086 1 159 0,0785 -0,0301* Collat 3 719 0,1560 1 159 0,3477 0,1918* OtherCond 3 719 0,1772 1 159 0,3874 0,2102*
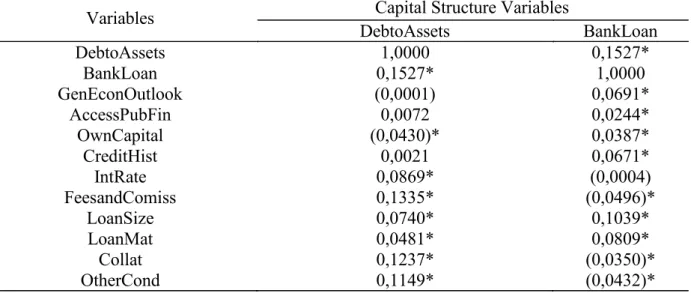
Looking at the correlation matrix (Table III), the dependent variables that try to represent changes in SMEs capital structures vary with the variables of interest, i.e. variables selected to represent the access to external finance.
Generally, all the variables have low linear correlation between them. If we consider the dependent variables (DebtoAssets and BankLoan), the increase in one will increase the other by 15,3%. Analyzing access to external finance variables, it is observable that supply side is the group of variables that are mostly correlated with the dependent variables, specifically DebtoAssets. If supply side variables increase, i.e. IntRate, FeesandComiss, LoanSize, LoanMat, Collat or OtherCond, DebtoAssets will increase by 8,7% (IntRate), 13,4% (FeesandComiss); 7,4% (LoanSize); 4,8% (LoanMat); 12,4% (Collat) or 11,5% (OtherCond). Nevertheless, BankLoan dependent variables presents lower correlations with the same explanatory variables. Considering BankLoan, LoanSize and LoanMat are the variables most correlated with the dependent variable, leading them to increase by 10,4% and 8,1%, respectively. Hence, based on the correlation matrix results, it is expected that increases on the availability of size and maturity of loans will increase the usage of Bank Loans by SMEs. Table III
Table III
Correlation matrix between Capital Structure and Access to External Finance variables Table III reports the correlation between the variables that represent the changes in capital structure of SMEs in Europe (DebtoAssets and BankLoan) and the ones that try to explain the impact of access to external finance on them. Hence both variables that are a proxy for the demand side (GenEconOutlook, AccessPubFin, OwnCapital and CreditHist) and supply side (IntRate, FeesandComiss, LoanSize, LoanMat, Collat and OtherCond) are presented. For the sake of simplicity, this table does not display the control variables considered in the regressions, but they are all presented in Appendix 6. The following sign applies for the statistical significance of coefficients: * p<0,05.
Variables Capital Structure Variables
DebtoAssets BankLoan DebtoAssets 1,0000 0,1527* BankLoan 0,1527* 1,0000 GenEconOutlook (0,0001) 0,0691* AccessPubFin 0,0072 0,0244* OwnCapital (0,0430)* 0,0387* CreditHist 0,0021 0,0671* IntRate 0,0869* (0,0004) FeesandComiss 0,1335* (0,0496)* LoanSize 0,0740* 0,1039* LoanMat 0,0481* 0,0809* Collat 0,1237* (0,0350)* OtherCond 0,1149* (0,0432)*
4.2. Probit and average marginal effects
According to the methodology described in section 3.3, several models were tested in order to answer the research questions proposed in section 1.3 and provide conclusions regarding the present dissertation framework.
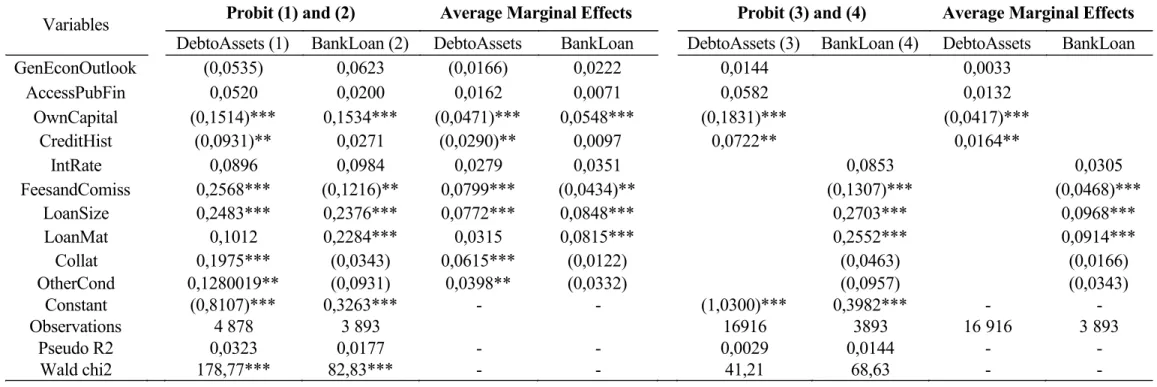
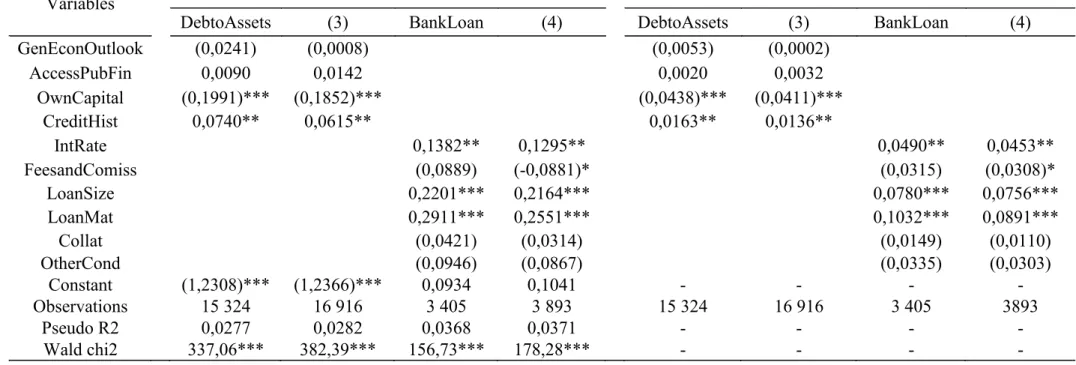
The variables that represent the demand and supply side were firstly considered in both regressions proposed, i.e. regressions (1) and (2). Namely, DebtoAssets and BankLoan were considered as a function of all the access to external finance variables. Nevertheless, the variables of interest revealed to be more appropriated depending on the dependent variable. Thus, DebtoAssets was considered a function of the demand side, generating regression (3), while BankLoan was regressed as a function of the supply side variables, generating regression (4). The idea is to understand how the demand conditions (GenEconOutlook, AccessPubFin, OwnCapital and CreditHist) influence the external finance in general (DebtoAssets) and how the terms and conditions to raise bank loans (IntRate, FeesandComiss, LoanSize, LoanMat, Collat and OtherCond) influence that specific source of financing (BankLoan).
Concerning the empirical analysis, even though regressions (3) and (4) revealed from the beginning to be the most appropriated to explain changes in SMEs capital structure, regressions (1) and (2) were also analyzed in a primary stage, using only the variables of interest. As presented in Table IV, regression (1) reveals that OwnCapital and CreditHist are the demand conditions that are statistically relevant to explain DebtoAssets changes. An improvement on SMEs own capital or credit history has a negative impact on debt change, statistically significant at 1% and 5%, respectively. As expected, these results are consistent if logit models are used instead of probit models (Appendix 7). Even though their coefficients are different, without a marginal analysis, these are the only conclusions that are possible to draw. Hence, taking into consideration the average marginal effect, the improvement of SMEs OwnCapital and CreditHist decreases the probability of an increase in leverage by 4,7% and 2,9%, respectively and holding everything else constant. Supporting hypothesis 1, item (iii), it applies also for both models.
FeesandComiss, LoanSize, Collat and OtherCond are also statistically relevant on DebtoAssets changes when considering the supply variables. However, when interpreting the impact of FeesandComiss, Collat and OtherCond on leverage changes, we conclude that an increase in these variables leads to an increase of DebtoAssets, at 1% significance level for FeesandComiss and Collat and at 5% significance level for OtherCond. Hence, besides not appearing consistent for the present dissertation, it becomes contradictory to the hypothesis 2, items (ii) and (v). On
the other hand, LoanSize is statistically relevant at 1% level, influencing positively DebtoAssets. When analyzing the average marginal effects, the increase of LoanSize increases the probability of a positive change in DebtoAssets by 7,7%, holding everything else constant. Supporting hypothesis 2, item (iii), it applies also for both models.
Considering regression (2), also reported in Table IV, Owncapital is the only demand condition statistically relevant when influencing changes in BankLoan. An improvement on SMEs Owncapital has a positive impact on BankLoan changes, statistically relevant at 1%. Taking into consideration the average marginal effect, the improvement of SMEs own capital increases the probability of a leverage change by 5,5%. Nevertheless, these results do not support any item of hypothesis 1, for both models. Analyzing the supply side variables, FeesandComiss, LoanSize and LoanMat reveal to be statistically relevant on BankLoan changes. An increase of FeesandComiss has a negative impact on leverage change, at 5% significance level, while an increase of LoanSize and LoanMat has a positive impact on leverage change at 1%. When considering the average marginal effect, the increase of FeesandComiss, decreases by 4,3% the probability of an increase in BankLoan, whereas the increase in the LoanSize or LoanMat increases the probability of a positive change in BankLoan by 8,5% and 8,2%, respectively, and holding everything else constant. Complying with hypothesis 2, items (ii), (iii) and (iv), these results hold for both models.
When looking at regression (3), it is understandable that demand conditions such as GenEconOutlook and AccessPubFin do not impact the change in SMEs debt (DebtoAssets), given its non-statistical relevance. However, it is observable that an improvement of SMEs own capital has a negative impact on debt change, while an improvement on SMEs credit history has a positive impact on changes in their debt levels. These effects are statistically significant at 1% and 5% level, respectively. As expected, these impacts are also consistent with the logit model. Taking into consideration the average marginal effect, the negative impact of Owncapital and the positive impact of CreditHist remain unchanged. Namely, the improvement of SMEs Owncapital decreases the probability of an increase in leverage by 4,2%. Nevertheless, the improvement of SMEs credit history increases the probability of a leverage increase by 1,6%, holding everything else constant. Supporting hypothesis 1, item (iii) and (iv), it applies also for both models.
Concerning the results from regression (4), the supply explanatory variables such as IntRate, Collat and OtherCond are not statistical relevant when explaining the changes in BankLoan.
positively by LoanSize and LoanMat, at a 1% significance level. As expected, these conclusions are also consistent with the logit model. Moreover, when analyzing the average marginal effects, the sign impact of the statistical relevant variables of interest remains unchanged. Specifically, the increase of FeesandComiss decrease by 4,7% the probability of an increase in BankLoan, whereas the increase in the LoanSize or LoanMat increase the probability of a positive change in BankLoan by 9,7% and 9,1%, respectively, and holding everything else constant. Complying with hypothesis 2, items (ii), (iii) and (iv), these results hold for both models.
Before continuing with the empirical analysis, it is possible to observe the less accurate results from regressions (1) and (2), and understand why the later regressions (3) and (4) were used as baseline in the remaining of this dissertation. Therefore, only regressions (3) and (4) are analyzed and applied throughout the empirical results, as it will be described below. Moreover, it is important to highlight that both models, appropriated to study binary and categorical variables and used in this dissertation, i.e. probit (Table IV) and logit (Appendix 7) models, draw the same conclusions when analyzing the average marginal effects. Even though their coefficients differ in their interpretations, when applying the average marginal effects the results are identical. Therefore, probit model and its average marginal effects will be used from now onwards.