Design of a vendor managed inventory model
in the tires industry
João Pedro Leite Guimarães Dissertação de Mestrado
Orientador na FEUP: Prof. Eduardo Gil da Costa
Mestrado Integrado em Engenharia Industrial e Gestão 2016-07-12
The inherent preferences of organizations are clarity, certainty, and perfection. The inherent nature of human relationships involves ambiguity, uncertainty, and imperfection. How one honours, balances, and integrates the needs of both is the real trick of management. — Richard Tanner Pascale and Anthony G. Athos, The Art of Japanese Management, 1981
Abstract
This project was developed within the company Continental – Indústria Têxtil do Ave, which is a supplier for the tires industry. The aim of this thesis is to provide to the company the necessary insights to decide whether a shift in the replenishment responsibility would be beneficial both for the company and Continental AG group.
Almost the totality of the company’s sales has a tire plant from the group as destination, so problems as trust and share of information are not at stake. The company has already the capability to monitor the inventory position in the tire plants and the shared ERP system enables an expedited communication of the tire plants’ requirements and purchase orders through EDI.
The company’s willingness to conduct this study comes from 2013 as a way to improve its supply chain management procedures. However, this thesis marks the first concrete steps in the project, in a phase where the company is struggling with production capacity issues. The tires market is volatile and tire plants usually hold big amounts of stock in order to avoid shortage situations. The Continental headquarters have defined target stock levels for the tire plants’ raw materials, but one conclusion reached is that tire plants hold more stock than necessary.
To cope with the current company’s difficulties, there is an urgent need to understand if a Vendor Managed Inventory model, under which the replenishment decisions concerning timings and quantities would fall on the supplier company, is a plausible solution to face the problem.
The main conclusion was that, whether the information maintained in the ERP system is reliable, the company can propose an accurate replenishment plan to the tire plants. It was proved that, resorting to automatic tools, the stock position is controlled within the desired ranges, the average inventory in the tire plants is lower and the service level is maintained at 100%.
For the company, this project indicates that it is possible to increase the stock availability upstream and to speed up and standardize the ordering process.
Moreover, this project raised the attention from Continental headquarters and, therefore, it is possible that the methodology developed can be adopted in other companies and other supply chains within the Group, which is a major achievement.
Design de um modelo de inventário gerido pelo fornecedor na indústria de pneus
Resumo
Este projeto foi desenvolvido na empresa Continental – Indústria Têxtil do Ave, empresa do setor têxtil que fornece a indústria de pneus. O principal objetivo desta tese é dotar a empresa com os conhecimentos necessários para perceber se uma mudança na responsabilidade de reabastecimento será benéfica tanto para a empresa como para o grupo Continental AG. Quase toda a totalidade das vendas da empresa tem como destino uma das fábricas de pneus do grupo, portanto, as complicações comuns no que diz respeito a questões de confiança e de partilha de informação não representam um problema neste caso concreto. Atualmente, a empresa tem a capacidade de monitorizar a posição do inventário nas fábricas de pneus e o sistema ERP partilhado permite uma comunicação expedita das necessidades das fábricas de pneus e das ordens de compras através do EDI.
A vontade da empresa em realizar este estudo começou em 2013, com o objetivo de melhorar os procedimentos de gestão da cadeia de abastecimento. Contudo, esta tese marca os primeiros passos concretos no projeto, numa fase em que a empresa está a ter problemas de falta de capacidade de produção.
O mercado de pneus é volátil e as fábricas de pneus normalmente armazenam grandes quantidades de stock de forma a evitar situações de escassez. A sede da Continental definiu níveis alvo de stock para as matérias-primas nas fábricas de pneus, mas uma das conclusões alcançadas nesta tese é que as fábricas de pneus possuem quantidades de stock maiores que as necessárias.
Para lidar com as atuais dificuldades da empresa, existe a necessidade urgente de compreender se um modelo de inventário gerido pelo fornecedor pode ser uma solução viável para lidar com o problema. Na eventualidade da adoção deste modelo de gestão de inventário, as decisões de reabastecimento, mais concretamente no que diz respeito a dias de entrega e quantidades, seriam da responsabilidade da empresa fornecedora e não das fábricas de pneus. A principal conclusão retirada deste trabalho é que se a informação mantida no sistema ERP for fiável, a empresa fornecedora pode propor um plano de reabastecimento preciso às fábricas de pneus. Foi provado que, recorrendo a ferramentas automáticas, a posição do stock é controlada dentro dos níveis desejados, o inventário médio nas fábricas de pneus é mais baixo e o nível de serviço é mantido nos 100%.
Este projeto dá indicações à empresa de que é possível aumentar a disponibilidade de stock a montante e acelerar e estandardizar o processo de encomenda.
Este projeto chamou a atenção da sede da Continental, e, por isso, é possível que a metodologia desenvolvida possa ser adotada em outras empresas e adaptada a diferentes cadeias de abastecimento do grupo, o que representa uma grande conquista para este projeto.
Acknowledgments
The conclusion of this master thesis was possible not only due to the personal effort but also due to all the professionals that helped me during this journey and to whom I am truly grateful.
To Professor Eduardo Gil da Costa, for being always ready to help, for his availability to discuss my doubts, to guide me through the preparation’s process of this dissertation and for his interest in getting to know the company and the people involved in the project.
To Diogo Silva, for welcoming me and for making me part of the Continental team during my time in the company. Thank you for all the advices, for sharing your know-how of the business and for all the good moments.
To Mr. Manuel Pinheiro, for the availability to discuss every detail that seemed important for the project, for pushing the project forward and for the good conversations from which I learned a lot about business, management and strategy.
To Eng. Eduardo Diniz, for being concerned on how was the project evolving and for keeping on motivating me.
To Michael Okon, who despite being physically far, always showed a great interest in the success of this project.
To Mrs. Magda Cândido and Mrs. Sónia Pereira, for giving me help on the selling and purchasing departments, respectively, which was crucial to the conclusion of the project. To Mrs. Marcela Silva for her readiness to teach me about the most various themes regarding the operations at C-ITA and for her enthusiasm on the final result of this project.
To all the amazing professionals that work at C-ITA, who integrate me and make this journey very pleasant.
To my university colleagues, for sharing their knowledge not only throughout this process but also through the five years we spent together at FEUP.
To my long-time friend, Diogo Pinto, who gave me precious advices on programming and modelling. Also, to all my friends that helped me to relax in the most stressful moments. To my brother and sister-in-law, that have helped me during the entire course and have taught me a great number of things that I used during this master thesis.
To my mother and my father, for their patience and unconditional love and because it is due to their hard work that I have the opportunity to graduate and to do this master thesis.
Finally, to my girlfriend, Raquel, for all of her support and for being there when I most needed.
Index
1 Introduction ... 1
1.1 Company’s Presentation ... 1
1.2 The Industry and the Supply Chain ... 3
1.3 Problem Statement and Methodological Framework ... 5
1.4 Document Organization ... 5
2 Literature Review ... 6
2.1 Supply Chain Management ... 6
2.1.1 Risk Management ... 7 2.1.2 Bullwhip Effect ... 7 2.1.3 Stock ... 8 2.1.4 Service Level ... 10 2.2 Inventory Management ... 10 2.2.1 Forecasts ... 11 2.2.2 Inventory Control ... 11
2.3 Collaborative Supply Chains ... 14
2.3.1 Vendor Managed Inventory ... 14
3 Analysis of the Present Situation ... 16
3.1 Customers ... 17
3.2 Communication Process ... 19
3.3 Demand Particularities ... 22
3.4 Product and Production Particularities ... 27
3.5 Room for Improvement ... 29
4 Proposed Solution ... 30
4.1 Proof of Concept ... 30
4.2 Development of the VMI Concept ... 32
4.2.1 Stock Levels ... 34
4.2.2 Safety Stock ... 35
4.2.3 Prioritization Method and Selection Process ... 37
4.2.4 Process Flow ... 40
4.2.5 Graphical User Interface ... 41
4.3 Results ... 43
4.4 Warehouse or Transportation Optimization ... 47
5 Conclusions and Future Developments ... 49
References ... 51
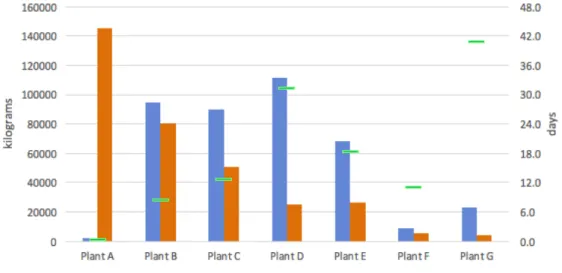
Appendix A: Days of stock of every material in each tire plant ... 54
Appendix B: Tool developed to test the concept ... 55
Appendix C: Routine performed by the Prioritization Method ... 56
Appendix D: UML diagram of the VMI model ... 57
Appendix E: Swimlane diagram of the operational logic to implement in the day-to-day relationship ... 58
Appendix F: Mockup of the developed VMI model ... 59
Appendix G: Differences in the sawtooth amplitude between the inventory management and the full truck load policies for material R05552801AW in Plant B ... 60
Acronyms
BOM: Bill of Materials
C-ITA: Continental – Indústria Têxtil do Ave, SA CMIP: Continental Mabor – Indústria de Pneus CUD: Consumption Unit Days
EDI: Electronic Data Interchange ERP: Enterprise Resource Planning ITA: Indústria Têxtil do Ave
MRP: Material Requirements Planning OEM: Original Equipment Manufacturers PV: Prioritization Value
SCM: Supply Chain Management SKU: Stock Keeping Unit
SMI: Supplier Managed Inventory SOP: Sales and Operations Planning UML: Unified Modelling Language VMI: Vendor Managed Inventory VMR: Vendor Managed Replenishment WIP: Work in Progress
Index of figures
Figure 1 - Continental AG structure and the position of C-ITA inside it ... 2
Figure 2 - Production processes at C-ITA ... 2
Figure 3 - OEM supply chain ... 4
Figure 4 - Retailing supply chain ... 4
Figure 5 - C-ITA's total share, considering its main customers, data from 2015 ... 16
Figure 6 - Division of C-ITA’s sales volume in 2015 ... 17
Figure 7 - C-ITA and its customers’ location ... 18
Figure 8 - Detailed C-ITA’s share in four of the tire plants in study, in 2015 ... 18
Figure 9 - Global Inventory Position versus Global Average Consumption ... 24
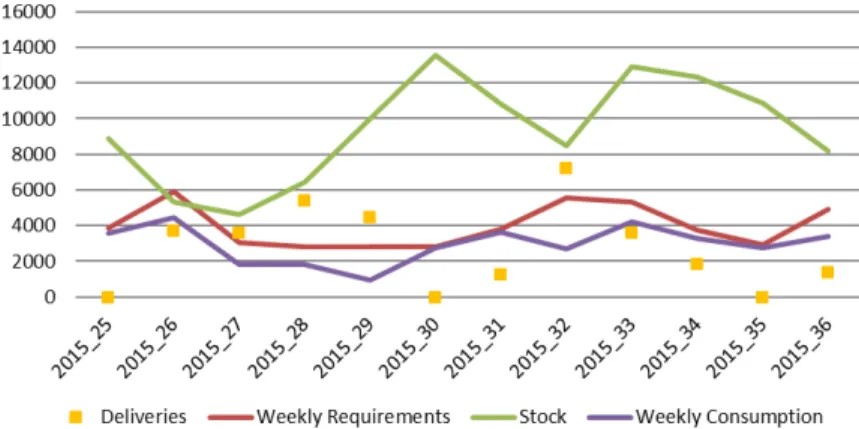
Figure 10 - Evolution of the main figures of material R0521703AE in Plant C ... 25
Figure 11 - Evolution of the main figures of material R0623101AJ in Plant C ... 25
Figure 12 - Evolution of the main figures of material R0686001AO in Plant E ... 25
Figure 13 - Evolution of the main figures of material R0623301AA in Plant E ... 25
Figure 14 - Divergent structure of the supply chain ... 28
Figure 15 - Detail of the VMI concept ... 31
Figure 16 - Chart representation of the different stock levels for one material ... 35
Figure 17 - Different examples of stock positions regarding the stock levels ... 37
Figure 18 - Different inventory positions and crossed levels ... 39
Figure 19 - Process Diagram of the model developed ... 40
Figure 20 - Detail of the Graphical User Interface of the model developed ... 42
Figure 21 - Evolution of stock of material R0552801AW if the purchase orders were delivered ... 43
Index of tables
Table 1 - Demand characteristics, in Muller, Essentials of Inventory Management, 2011 ... 12
Table 2 - The dynamics of the SOP system ... 20
Table 3 - Evolution of the planned production of tires throughout the first months of 2016, in % ... 22
Table 4 - Rationing and shortage gaming in Plant D ... 26
Table 5 - Stock Levels calculated for one material, for a period of eleven days ... 34
Table 6 - Simulation results for the optimization policies and comparison with current status ... 44
Table 7 - Difference between the consumption and the requirements data and its totals ... 45
Table 8 - Safety Stock values and the relation between them, requirements and consumption ... 46
1 Introduction
The last decades have shown a growing awareness regarding supply chain management (SCM) best practices. To ensure its competitiveness in today’s economy, it is important for a company to design an efficient supply chain. In what concerns highly competitive industries, such as the automotive, the focus on SCM has become crucial. The thrive to continue being one of the biggest players in the Original Equipment Manufacturers (OEM) parts suppliers market forces Continental AG group and consequently Continental – Indústria Têxtil do Ave (C-ITA) to develop strategies in order to improve its logistics procedures in a continuous improvement philosophy.
The aim of the present chapter is to present both the company and the industry and contextualize the scope of the project. This way, it will be easier to understand the problem addressed and the proposed solutions.
1.1 Company’s Presentation
The current project was developed at C-ITA, which is a factory located in Lousado, Vila Nova de Famalicão. The plant was built in 1950, nearby the old Mabor – Manufactura Nacional de Borracha’s production plant, with the intention of supplying this tire manufacturer with textile reinforcements. Back then, the company was simply named Indústria Têxtil do Ave (ITA) and both ITA and Mabor had no relation with the Continental group.
In 1990, knowing that Autoeuropa would be created in Portugal and being aware of the Portuguese restrictions regarding the import of components, Continental AG, who already was a minor shareholder of Mabor and ITA, saw a business opportunity and decided to go for a joint venture with Mabor. During 1993 and 1994, the Continental group acquired controlling interest over Mabor and ITA and from the restructuring process arose the designation Continental Mabor – Indústria de Pneus (CMIP) and, more recently, C-ITA. This is not an isolated case, though. Some other previous Continental partners and suppliers became part of the group, as a strategy of growth and, in some cases, vertical integration, so that Continental could reach new markets and gain efficiency globally. With the belief that “Highly developed, intelligent technologies for mobility, transport and processing make up our world”, Continental AG aims at helping people around the world to fulfil their dreams of mobility, being its vision “Your Mobility. Your Freedom. Our Signature.”.
The corporate group Continental AG is among the world leaders in the areas where it operates. Despite being mainly recognized by its tire division, Continental AG is a major player on the automotive business, ranking the third position on the world’s OEM parts suppliers table provided by the Automotive News magazine in 2014 ("Top Suppliers" 2015). The fast growth of innovative companies such as Tesla, Faraday Future and Google bring new requirements and constant challenges to the automotive suppliers. The pressure to which the company’s divisions which face constant evolution are subjected and the necessity of adopting the best practices in order to prosper sprawl throughout the whole group. This means that Continental headquarters demands excellent results year after year in all areas and C-ITA continuously tries to upgrade its methodologies to meet these objectives.
Figure 1 illustrates the actual Continental AG structure and where C-ITA lies inside the group. From 2014 annual report (Continental AG 2015), some relevant numbers which are referred posteriorly are also presented in Figure 1.
Figure 1 - Continental AG structure and the position of C-ITA inside it
Originally, C-ITA could be seen as an ordinary textile plant, since the processes from raw material to finished goods were very similar to the ones from the apparel industry. The only raw material was cotton and the process flow was the preparation of the raw material, then the spinning, then the twisting and at last the weaving. With the appearance of new materials with better characteristics in the 60’s such as fibres of nylon and rayon, the production process changed slightly to what it is yet today. Unlike nylon and rayon, cotton has the ability to adhere to rubber and, with this permutation, once C-ITA had to start buying yarn of those materials, the first two steps were no longer needed and a new one had to be added, the dipping, that is the last process which gives to the textiles the characteristics needed to play an important role in the tire structure.
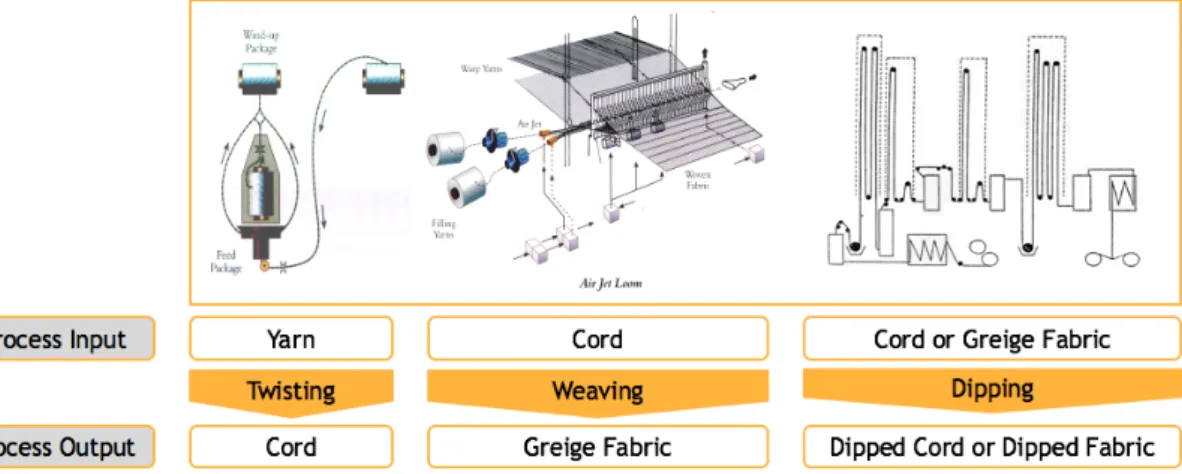
Figure 2 describes the production processes which, in synthesis, begin with the reception of fibres as nylon, polyester, rayon or aramid which are firstly transformed into cord by the process of twisting. After this step, a variable number of bobbins of cord are joined to produce the greige fabric in the weaving machines. The ability to get linked to rubber comes after the dipping process, where chemicals are added to the greige fabric and it acquires its brick red colour. Only after that is the product finished and ready to enter the tire plants’ production lines. For some type of tires, customers use dipped cord instead of dipped fabric, and in those cases, the weaving process does not take place and the dipping process is somehow different.
Figure 2 - Production processes at C-ITA
Continental Corporation
Sales: €34.5 billion EBITDA: €5.2 billion In % of sales: 15%Chassis &
Safety Division DivisionInterior Powertrain Division
Automotive Group
Sales: €20.9 billion EBITDA: €2.4 billion In % of sales: 11,5% Sales: €13.6 billion EBITDA: €2.8 billion In % of sales: 20,5%Rubber Group
Tire Division Sales: €9.8 billion EBITDA: €2.3 billion In % of sales: 23,5% ContiTech Division Tire Plants C-ITA clients C-ITA
The type of fibres used, the defined parameters for production and the chemical characteristics acquired when dipped make C-ITA’s final product fully customized to tire production applications. The main role of textile reinforcements in the tire industry is to prevent tires from expanding indefinitely as their temperature increases when rolling.
Dipped fabric and dipped cord represent 90% of C-ITA’s sales volume, being the annual production capacity of the plant, for these materials, around 18.000 tons/year (value depending on the product mix that is supplied during the year). The production lead time is nearly three weeks, so the flexibility to react quickly to changes in the orders or to new orders is not as high as desired. The continuous challenge in the company, which is a key factor for its success, is to manage the balance between stock levels and service level in the most appropriate way.
Due to strategic reasons, C-ITA has recently diversified its business to other sector of the automotive industry by launching production of a new product family, which is knitted fabric. These products have shown to be a success and represent the remaining percentage of the sales volume. These products are to be used in the interior part of cars, and currently the only customer is one Continental plant from the Interior Division.
In accordance with the strategy to increase Continental internal revenues, C-ITA is always looking forward to raise its production capacity so as to increase the supply of those plants which have to buy part or the totality of their textile supplies from external companies. However, there has to be a trade-off between profit and risk, and Continental, as a preventive measure, does not normally allow a plant to have just one supplier for a certain type of material.
The willingness to increase C-ITA’s share among the plants of the group is directly related with C-ITA’s mission, which is to “Create Value to the Continental world wherever textile competence is a differentiating factor”. To accomplish this, C-ITA is investing in R&D, from which is getting interesting results and it is also contributing to raise its recognition within the Continental group.
The scope of this project focuses exclusively on the company’s core competences and therefore, all the references to C-ITA’s processes, products and customers from now on will be related with textile reinforcements. There is only one more factory held by Continental AG producing this same type of materials as C-ITA, which is located in North America.
The idea for the present project began in 2013 and it has been discussed in some of the Rubber Group annual purchasing meetings since then. The main expected output is a framework that allows C-ITA, the vendor, to better use and manage the information of its customers, the tire plants, in order to improve the overall service level and, ultimately, to gain some production capacity. This project has strategic importance for the group and it has been followed closely by the corporate purchasing division from Continental AG headquarters in Hannover.
The project was developed inside the Logistics Department, which is responsible for purchasing raw materials (inbound logistics) and selling finished goods (outbound logistics). 1.2 The Industry and the Supply Chain
Globalization has resulted in a challenging automotive manufacturing environment that is changing at a rapid pace. Nowadays, automotive companies not only face intense competition, but also ever-increasing customer expectations, unpredictable customer loyalty and little tolerance for poor quality (Masoud and Mason 2016). As an attempt to minimize the business risks, companies have developed highly efficient production systems and it is a real concern to have or to create excess capacity where possible to accommodate demand fluctuations.
One added particularity of the tire industry is the great amount of stock of finished goods that is held. The costs associated with this practice are enormous, but since profits are higher than the ones of other industries (EBITDA and Sales results presented in Figure 1 illustrate this statement, when comparing the tire industry with the other sectors of Continental), brands choose not to lose any sales. The reasoning of tire manufacturers is that inventory is absolutely necessary to be able to quickly react to the market demand variations. Quoting an old saying, recalled by Muller (2011), “it costs money to make money”.
However, in order to generate higher levels of productivity and profitability and to be more competitive, tire industries have been putting a lot of attention on their supply chains. Continental AG recognizes the dangers of having overstock and seeks to carry less inventory along its supply chain while still keeping a high value of service level.
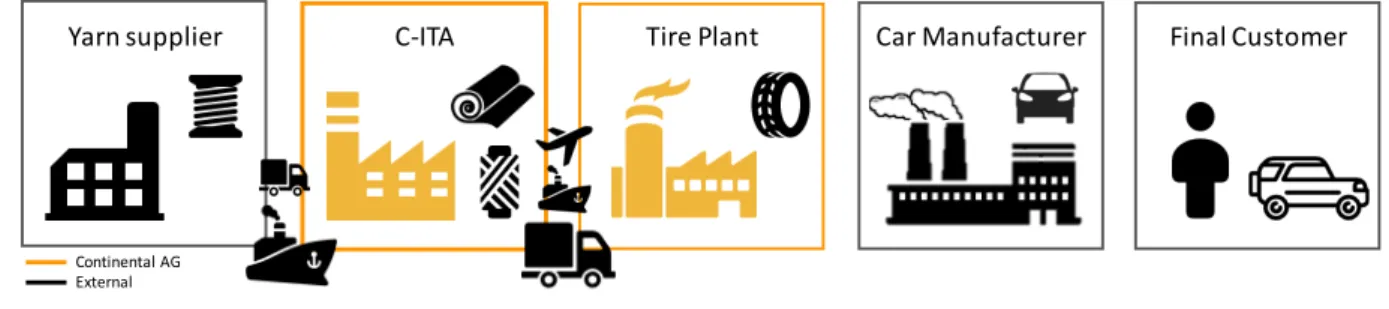
Balancing these two factors is a sensitive task, once in the tires industry new products are continuously being developed and launched and, with this, multiple experiments and tests take place. Suppliers must promptly react to demand, sometimes producing in small batches or new products, and all of this hinders planning, organization and supply chain optimization. C-ITA, being upstream in the chain, has to respond in a flexible and timely manner, despite its time constraints in the production processes. To be more precise, C-ITA is part of two different supply chains, each one with a distinct market as a destiny. In the OEM supply chain, the tire plants sell their tires to automobile manufacturers, to whom tires are a component of their final product (Figure 3).
Figure 3 - OEM supply chain
The other supply chain aims at supplying the replacement market, the one to which the final customer resorts to when he needs to replace the tires of his vehicle (Figure 4).
Figure 4 - Retailing supply chain
Figure 3 and Figure 4 indicate the transportation methods utilized between C-ITA and its upstream and downstream echelon. The highlighted icon indicates the main method used. Regarding raw materials, as suppliers are mainly from Asian countries, transportation is done by boat and the lead times can reach two months. The transportation between C-ITA and its customers is mainly performed by trucks, as they are located mainly in Central Europe. In extreme cases, like shortage imminence, airplane transportation is requested.
Although the number of C-ITA’s customers rounds twenty, being some of them external to the Continental group, this project only concentrates in the relationship between C-ITA and the tire plants of the group located in Europe.
Yarn supplier C-ITA Tire Plant Car Manufacturer Final Customer
Continental AG External
Yarn supplier C-ITA Tire Plant Wholesaler Retailer Final Customer
Continental AG External
1.3 Problem Statement and Methodological Framework
Despite having the same shareholder, each tire plant is a distinct company with its own administration and goals. Currently, tire plants’ replenishment procedure is performed individually, that is, each plant manages its own stock of textile reinforcements and their only concern is to have quantities of raw material which have to be sufficient to keep the plant running without shortages.
There is no specific tool to support the purchasing activity. Based on their forecasts, transportation lead time, on how much a truck can carry and on some more restrictions like warehouse space or specific days to receive a loading, each tire plant’s planner decides about the quantities that must be delivered in a given day.
This is a common business relation, however C-ITA has a broader view over the consumptions and stocks of all the plants and recognizes that there is room for several improvements. Due to C-ITA’s restricted capacity, any capacity gain is important and based on experience and data analysis, C-ITA’s logistics department has successfully been trying to exploit this knowledge to better serve all of its customers. The next step of this process is to study whether a centralized management under a supply chain model of Vendor Managed Inventory (VMI) would be beneficial for the Continental group.
The present project represents the first serious attempt to come up with a feasible solution to this question. The main goal is to develop an evaluation tool where C-ITA can simulate a VMI policy, where C-ITA would have the responsibility of both maintaining proper stock levels and deciding when and how much to replenish each plant.
The first challenge is to download and treat all the relevant data, but not aggregated, from the Enterprise Resource Planning (ERP) system, like daily historical values of sales, consumption, stock levels and forecasts. Then, in order to shift the replenishment decision to the supplier, it is absolutely necessary to establish solid rules regarding stock levels between the two links of the chain, once it represents a very sensitive matter. During this project, although there was not a real concern to define strict rules with the tire plants, there have been some conversations with them in other to create some guidelines. All the real restrictions and impositions were taken into account and scenarios were tested so that, at the end, a versatile tool could be presented to the tire plants and which, ultimately, could bring benefits to them. The main outputs are replenishment proposals which optimize simultaneously the overall cost of the supply chain operations and the risk of shortage in a plant. A customizable framework with dynamic parameters is a must, so that both Continental headquarters and the tire plants can see how lead time, costs and capacity restrictions influence the replenishment decision. 1.4 Document Organization
Chapter one was dedicated to the company’s contextualization, the industry where it operates as well asthe main issue which is currently facing regarding supply chain management. In the second chapter it is presented the literature review, where the whole theories and methodologies which support this thesis, are explained.
The third chapter is reserved to further explanation concerning the problem addressed, being presented a detailed evaluation of how the vendor-buyer relation currently is.
The methodology applied and the reached solutions are approached in the fourth chapter. The aim of this chapter is to give an overview over all the steps of the project and to mention the main comments and results regarding the final output.
Finally, some conclusions about the project and some ideas and future developments regarding this project are presented in the fifth chapter.
2 Literature Review
In the last decade, the new perspective researchers have been studying regarding supply chain relationships is collaboration (Patricia 2011). Given the nature of this project, inevitably collaborative models and more specifically VMI are the main research fields. In order to be able to develop the VMI model, relevant topics such as supply chain management, collaboration, inventory management and replenishment policies were reviewed.
Chapter 2 is divided in three subchapters, corresponding to the main objects of the research: supply chain management, inventory management and collaborative supply chains. In each of these, specific topics are highlighted and explored.
After reading this chapter, all the methodologies and considerations used throughout the project will be more easily understood.
2.1 Supply Chain Management
A supply chain is described by Melnyk et al. (2014) as “the set of upstream and downstream entities who work either directly or indirectly with the firm” and it can be a “critical competitive force in today’s increasingly turbulent marketplace”.
Supply chain initiatives have evolved through time. In the 1960’s companies had vertical organization structures, focused on functions and their relationships with vendors or suppliers were mainly win-lose interactions. After 15 or 20 years, companies were still vertically aligned, but some began to grow attention into process mapping and quality management. Starting in 1990, increasing national and international competition led companies to think about their supply chains in a different way. Aligning the organizational structure with its processes, betting on information technology tools and focusing in the total cost of a product, from its source to consumption, instead of trying to get the lowest price from their suppliers to raise profits were the main changes (Charu and Sameer 2000).
This last topic is deeply related with the “increased reliance on purchased material and outside processing with a simultaneous reduction in the number of suppliers and greater sharing of information between vendors and customers” (Charu and Sameer 2000) which also started to be verified in that time and which marks the first steps in supply chain collaboration.
In turn, SCM is defined by Christopher (2011) as “the management of upstream and downstream relationships with suppliers and customers in order to deliver superior customer value at less cost to the supply chain as a whole.”, thus extending the traditional concept of logistics, in which the focus is on the internal activities. Christopher highlights companies which excelled mainly because they established SCM as a high priority, like Zara, Xerox and Dell, and thus achieved recognition for service excellence and were able to gain competitive advantages over their competitors.
Despite the advantages, this current paradigm obliges companies to rely on others for their success, and so effective supply chain risk management is essential to a prosperous business. In his work, Lynch (2009) addresses supply chain risk from several points of view, stating that “the truly successful supply chain is one in which the potential worst-case single points of
failures are assumed”. Being a matter of great importance for the success of this project, relevant topics on risk and where can this risk be in the supply chain are further explained. 2.1.1 Risk Management
Risk is a fact of life for any supply chain, whether it is dealing with legal issues, quality and safety challenges, supply shortages or even weather and natural disasters. Lynch (2009) generalizes by stating that risk has two essential components, uncertainty and exposure to uncertainty, and that a company faces risk when both of them are present.
Then, the way each company decides to manage the risk will determine the level of its consequences. Christopher (2011) recalls an episode of fire at the facilities of one of the major suppliers of both Nokia and Ericsson. Nokia’s event management capability had alerted them immediately to the potential problem that this breakdown could cause and, on the other hand, Ericsson had been slow to recognize that there was a problem and failed to act timely. As a result, Ericsson was not able to supply the market and consequently, lost significant sales revenue and market share to Nokia. Although both companies faced the same situation, their different strategies led to a very different outcome.
According to Lynch (2009), in order to mitigate any eventuality, a company should: remain agile to avoid risk; be resilient to respond, adapt, and absorb risk; and develop methodologies that are sustainable to scale and maintain risk solutions.
It is important to highlight this last advice. To be able to manage risk solutions is an advantage because risk and efficiency are positively correlated. Admitting that carrying less inventory along the supply chain means to be more efficient, the exposure to risk is also higher. So, there is a balance that must be achieved.
When the last echelon in the supply chain is the final customer, the demand is stochastic. Due to all the variables that influence final customer decisions, it is impossible to determine the exact demand and companies carry extra stock to maintain high service levels. Risk management, in this context, assumes also great importance in SCM once an appropriated balance between the two factors can represent major savings.
2.1.2 Bullwhip Effect
The bullwhip effect, also known as the Forrester effect, is the “phenomenon of variability magnification as we move from the customer to the producer in the supply chain” (Jacobs and Chase 2011) and it indicates a lack of synchronization among supply chain members.
By other words, bullwhip effect is the term used in SCM to indicate the oscillating effect which either inaccurate information or improper forecast can have in inventory levels across the supply chain. Understanding the root cause of any change and the possible downstream effect that it can provoke is one of the most critical steps in supply chain risk management (Lynch 2009).
Literature points out four reasons to the appearance of the bullwhip effect: Demand distortion, price fluctuations, batch ordering and rationing and shortage gaming (Lee et al. 1997).
Demand distortion is the most discussed phenomenon, in which orders to the supplier have larger variance than sales to the buyer (Beamon and Chen 2001) and it can happen due to information complexity. What causes complexity is, among others, the number of stages or levels of the supply chain, for how many of these levels the information must flow and the wide variety of products which leads to multiple bills of materials and hence a higher volume of data (Christopher 2011). When the gap between forecast and reality is large, the conditions for product shortfalls or excess inventory are created.
Lee et al. (1997) explained the other three causes of the bullwhip effect. Price fluctuations are special promotions or discounts, which lead customers into buying large quantities and stocking up. It increases the bullwhip effect whether this information is not taken into account when calculating future forecasts.
To take advantage of potential cost reductions, such as ordering in full truck loads instead of ordering smaller amounts, companies may place orders in batches. Batch ordering contributes to poor forecasting because very little information about actual demand is transported in such method.
At last, rationing and shortage gaming might occur when product demand exceeds supply and a manufacturer starts to ration its products. As a consequence, customers may think that there is a product shortage and they may increase their orders with the expectation that some part of the order will be filled, providing wrong information on the real demand and thus affecting future forecasts.
Bullwhip effect can be reduced or attenuated by diminishing the complexity of information, which can be done by managing this information globally and centrally, in a position with a broader view to the supply chain. To accomplish this, Electronic Data Interchange (EDI) systems are a requirement so as to raise the speed of information flow and accuracy (Machuca and Barajas 2004).
2.1.3 Stock
Stock consists of all the materials and goods which are stored by an organization for future use. The determination of how many stock should a company have at a given time is a sensitive task, once a proper balance between service level and inventory may represent significant savings. After all, stocks are expensive because of the costs of tied-up capital, warehousing, protection, insurance, deterioration, loss, administration, and so on. However, a list of some reasons why a company should hold stock was made by Jacobs and Chase (2011):
• To take advantage of economic purchase order size:
A way to lower costs by taking advantage of price discounts on large orders, by placing few orders or making full loads for delivery, or even purchasing items when the price is low and it is expected to rise, when they are going out of production or when they are difficult to find;
• To provide a safeguard for variation in raw material delivery time:
In a first instance, additional stock can cover deliveries that are delayed or that are too small. However, a variety of reasons can affect the correct delivery of an order, such as an unexpected strike at the supplier’s plant or at one of the shipping companies, a lost order, a shipment of incorrect or defective material, etc. Having safety stock gives cover for emergencies;
• To maintain independence of operations:
It is the same as to say to decouple adjacent operations. A buffer between operations increases flexibility, may allow a reduction in the number of setups and can stabilize the average output, by compensating longer performance times with shorter ones; • To allow flexibility in production scheduling:
Holding inventory relieves the pressure on the production system to deliver the goods. In the cases where the setup costs are high, one can lower the operations costs by producing a larger number of units than the orders in hand once that setup has been made;
• To meet variation in product demand:
Usually demand in not completely known and safety stock should be held to absorb those variations where the demand is larger than expected or when it comes at an unexpected time.
Concisely, despite representing extra costs, holding inventory brings more stability to the whole supply chain. Waters (2003) also classified stock by its overall purpose, and it can be divided into:
• Cycle stock: the normal stock used during operations;
• Safety stock: a reserve of materials that is held for emergencies;
• Seasonal stock: used to maintain stable operations through seasonal variations in demand;
• Pipeline stock: the one currently being moved from one location to another; • Other stock: which consists of all the inventory that is held for some other reason. Among these, safety stock represents the major concern of supply chain managers. King (2011) reinforces this statement by saying that “what keeps people up at night is safety stock”. Safety stock is maintained to provide some protection against stockouts, and thus can be defined as the amount of inventory carried in addition to the expected demand (Jacobs and Chase 2011).
Safety stock should be hold whether uncertainties in demand, in order lead time and/or in material quality are somehow expected. For example, safety stock would keep the plant running smoothly if there is the need to increase production to match a customer’s order, to safeguard that there will be enough inventory until the next delivery arrives or to assure production till the materials are liberated from quality inspection, respectively.
The amount of safety stock a company should keep is thus affected by the variations in demand, variations in replenishment time and service level desired (Mercado 2008). Whether to hold safety stock or not is a question of analysing the costs of a lost sale and of holding a unit of extra inventory. If the cost of a lost sale is higher, then safety stock should be held. Safety stock can be determined based on many different criteria. Many times a company “simply states that a certain number of weeks of supply must be kept as safety stock” (Jacobs and Chase 2011). However, it is better to use an approach which captures the variability in the demand because it makes little sense to maintain the same amount of safety stock for two different products which are being sold in the same average amount, but the forecasts of one of them are much further from reality than the forecasts of the other.
The most known approach to calculate safety stock is called the probability approach, which considers only the probability of running out of stock and which is sustained on the assumption that the demand, over a period of time, is normally distributed. The general formula to calculate the safety stock is presented in equation (2.1):
!! = # × &' (2.1)
Where:
#, Number of standard deviations for a specified service level &', Standard deviation of usage (real data vs. forecasts)
So, analysing the differences between past consumption and the correspondent forecasts or between previous demand and actual sales and determining a service level, it is possible to obtain a safety stock value that is far more sustained than just a guesstimate or a standard value.
2.1.4 Service Level
Service level is a measure of performance. It can be used to characterize the service a company is providing to its customers, for instance, but in SCM it is commonly used to evaluate inventory replenishment policies.
Literature highlights three different types of service level: α (alpha), β (beta) and γ (gamma) (Tempelmeier 2011). The α service level is an event-oriented performance criterion and gives information on the number/frequency of shortages over a time period. The β service level is a quantity-oriented performance measure that analyses the deepness of the stockout. In other words, over a studied period, β compares the quantity of product that was demanded with the real amount that was delivered. The γ service level is not used as much as the previous ones in industrial practice. It reflects both the amount of backorders and the time a company takes to respond to these orders.
When discussing the α service level, some authors simply refer to it as the service level, once it is the most commonly used in practice. Mercado (2008) defines it as a measure of the probability that there will be enough inventory on hand given the nature of the variability of demand and of order lead time.
2.2 Inventory Management
Inventory is the term used to refer to all the stock, like work-in-progress, raw materials and finished goods, which is held by a company. Regarding inventory monitoring, some of the main tasks that a company must execute are:
• The determination of inventory levels; • The decision of when to replenish;
• The calculation of the order size which fits best its main interests.
The inventory management question of how much and when to order should be addressed by finding a reasonable balance between the cost of reordering, the cost of keeping inventory at the warehouse and the cost of not having stock (Mercado 2008).
Literature commonly refers to these costs, respectively, as (Jacobs and Chase 2011):
• Ordering costs: all the costs related with the preparation of the purchase or production order;
• Holding (or carrying) costs: these encompass costs of storage facilities, handling, insurance, obsolescence, depreciation, taxes, opportunity cost of capital, etc.;
• Shortage costs: frequently, the assumed shortage cost is a guesstimate, once it is difficult to precisely estimate lost profits, the effects of lost customers, or lateness penalties.
One way to measure inventory performance is by calculating the two ratios presented in equation (2.2) and equation (2.3) (one is, in practice, the inverse of the other):
()*+),-./ ,0.)-*+. = 1-2, -3 4--52 2-65
7*+.84+ 844.+48,+ 9)*+),-./ *860+ (2.2)
:++;2 -3 20<<6/ =7*+.84+ 844.+48,+ 9)*+),-./ *860+
Inventory turnover is an important measure since the ability to move inventory quickly has a direct impact on a company’s liquidity. Concerning the inventory valorisation, it should be considered raw materials, WIP, finished goods and also goods in transit owned by the company (Jacobs and Chase 2011).
These two inventory measures should be analysed while looking to two other dimensions of supply chain success: risk and service level. It is important to balance these numbers in order to reach a maximization of the service level and a minimization of the risk.
Ineffective inventory related decisions can lead to backorder penalties or lost sales. Muckstadt and Sapra (2010) distinguish inventory models with backordering or lost sales scenarios. Backordering occurs when there is no stock in the supplier’s warehouse and the customer decides to wait for the next replenishments to receive the quantities ordered. Lost sales means that if the supplier does not have the material to deliver, the customer will get it elsewhere. Although the real paradigm is a mix of these two situations, since modelling a hybrid method adds greater complexity, companies prefer to adopt one of these models as a standard.
A trend topic among all companies is lean. Companies are using lean techniques and they want to be part of lean supply chains. The main goal is to reduce waste (in its multiple forms) and to gain efficiency, and inventory management is part of this challenge.
2.2.1 Forecasts
In order to set up an inventory management system, as important as to determine a correct inventory policy is to have inputs to the system. These inputs are the forecasts.
A forecast can be simply described as a prediction of how something will occur or develop in the future based on previous or historical data. According to Waters (2003), “we cannot know with certainty what will happen in the future, but the best we can do is forecast expected conditions”.
The famous quote from Henri Poincare, “it is far better to foresee even without certainty than not to foresee at all”, gives strength to this idea. In fact, the concern should not be if the forecast is wrong or not, but on how wrong it is.
So, a very important topic regarding forecasting is the measurement of its errors. For instance, safety stock calculations are based on these errors and the only reason why safety stock must be hold is exactly because it is impossible to predict with 100% confidence the future demand.
2.2.2 Inventory Control
In what concerns how inventory should be managed, literature highlights the role of the type of demand and what implications it could bring to the decision maker. Jacobs and Chase (2011) stated that “an important characteristic of demand relates to whether demand is derived from an end item or is related to the item itself”.
To describe this characteristic, the terms used are independent demand and dependent demand. According to Muller (2011), independent demand is influenced by market conditions outside the control of the company’s operations (e.g. tires for the replacement market), while dependent demand is related to another item (e.g. tires bought by the OEM to assembly in the cars). That is, the demand for a product built up or created from either raw materials, parts or assemblies, whose destiny is to enter another product production process, is dependent on the demand for that final product.
The implication of this difference is the type of approach that should be followed to manage inventory. Independent demand requires a replenishment approach, which assumes that the market demand for the product has a certain pattern, being the stock replenished as it is used.
Dependent demand calls for a requirements approach. When an assembly or finished item is needed, then the materials needed to create it are ordered. There is no fixed pattern because an assembly created in the past may never be produced again.
This means that forecast techniques should be performed to independent demand and that the suppliers of materials, parts or assemblies for that final product must rely on its production requirements.
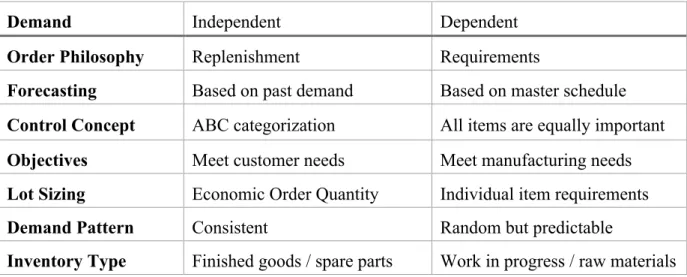
Thus, the nature of demand leads to different methods on how to manage inventory. In his work, Muller (2011) confronts these two concepts, and the mains considerations are resumed in Table 1.
Table 1 - Demand characteristics, in Muller, Essentials of Inventory Management, 2011
Demand Independent Dependent
Order Philosophy Replenishment Requirements
Forecasting Based on past demand Based on master schedule Control Concept ABC categorization All items are equally important Objectives Meet customer needs Meet manufacturing needs Lot Sizing Economic Order Quantity Individual item requirements Demand Pattern Consistent Random but predictable
Inventory Type Finished goods / spare parts Work in progress / raw materials
Jacobs and Chase (2011) also distinguish these two concepts, giving some concrete examples on how to review the inventory level and on how to apply the different lot-sizing techniques. In the following examples, in order to simplify the concepts, it is considered that there is no variability in the demand in the lead time period, so there is no need to calculate safety stock. Regarding independent demand, the review system may be continuous or periodic. A continuous review follows the fixed-order quantity model, a model that is “event triggered” and where inventory is monitored until it gets down to a level where the risk of stocking out is great enough that compels the company to order. This model should be applied to expensive products because it provides, for a certain moment, more accurate information about the real inventory level. Thus, it can be possible to react faster and lower the average inventory. However, this type of review requires much more complex database systems, which makes this system more expensive than a periodic one, for instance.
In order to determine the optimal quantity to order, the most common formula is the Economic Order Quantity (EOQ), presented in equation (2.4) and equation (2.5), whose output is an optimized quantity, constant for the considered time horizon, which should be ordered each time inventory goes below the reorder point level.
@1 = A1 +A C! + C 2D (2.4) ⟹ CFGH = 2A! D (2.5)
Where:
Qopt: Optimal quantity to be ordered
TC: Total annual cost D: Demand (annual) C: Cost per unit
S: Setup cost or cost of placing an order H: Annual holding and storage cost per unit
The periodic review follows a fixed-time period model, which is “time triggered”. It can be used in any type of product, but higher average inventory is expected when comparing it with the results of the continuous review. The inventory is reviewed only at particular times, such as every week or every month. The concept of a constant optimal quantity is not applicable to this situation, because fixed-time review windows make impossible the minimization of the combination between holding and ordering costs. So, the quantity to order shall be the same as the average demand over the period in study minus the inventory currently on hand.
The main problem of the periodic review is that a large unexpected order can be placed right after one review period and draw the stock down to zero. This situation would go unnoticed until the next review period, being possible to be out of stock throughout an entire review period.
Concerning dependent demand, the most frequent lot-sizing techniques are Lot-For-Lot (L4L), EOQ (although it was not designed for a system with discrete time periods like Material Requirements Planning (MRP), it can be used under some assumptions), Least Total Cost (LTC) and Least Unit Cost (LUC).
In L4L, the planned orders are set to exactly match the net requirements, that is, the quantity shipped from the supplier must match the quantity needed by the customer for the time horizon until the next shipment. Despite some assumptions that have to be considered, the rationale of EOQ for dependent demand is the same as for independent demand. Both LTC and LUC are dynamic lot-sizing techniques. LTC calculates the order quantity by comparing holding costs with ordering costs for different lot sizes and then selects the one in which these costs are most nearly equal. LUC differs from the last in the way that it adds both ordering and holding costs for each trial lot size and divides this value by the number of units in each lot size, picking the one with the lowest unit cost.
In each of the cases, the supplier has to rely on the master production schedule (MPS) of its customer, which is a time-phased plan specifying how many and when the company plans to build or assembly the end item. The supplier’s concern is to guarantee that the customer has material in the right time, in the right quantity.
Just-In-Time (JIT), the logistics technique developed by Toyota, is being worldwide adapted to the cases where a supplier supplies its customers with a product whose demand is dependent. Under a JIT model, the supplier relies on the customer’s MPS figures, which are the most accurate forecast a supplier can have, and it is possible to achieve savings along the supply chain because the inventory levels decrease, ideally, to zero.
Since demand can vary due to the unpredictability of forecasts, is is important to define time fences, which are periods of time having some specified level of opportunity for the customer to make changes in their order. Time fences can be really important for a manufacturer once otherwise there would not be the possibility to maintain a reasonably controlled production flow.
2.3 Collaborative Supply Chains
Companies collaborate in order to provide products or services to their customers in a competitive manner. There is a growing conscience towards collaboration in supply chains, and its importance is illustrated by Lambert and Cooper (2000), who state: “One of the most significant paradigm shifts of modern business management is that individual businesses no longer compete as solely autonomous entities, but rather as supply chains. Business management has entered the era of internetwork competition.”.
The increasingly interest in collaboration has led researchers to address this field of studies. Yahia Zare (2009) and Joakim et al. (2014) performed two different literature reviews focusing in distinct aspects of collaboration. Yahia Zare states that a collaboration model has to combine the following characteristics: integration, automation, information and trust. Joakim et al. studied the main concerns of the companies regarding collaboration, coming to the following list: why (not) share information; what information to share and with whom; how to share information; pre-requisites, barriers and drivers.
Trust assumes the main role when analysing these questions. Partners have to trust each other so that the main enablers for collaboration, according to the literature, could be verified. These conditions are both visibility and accuracy of information which is exchanged between partners and the ease of exercising control over the supply chain (Verheijen 2010).
In his work, Verheijen details different forms of collaboration arrangements, contextualizing them historically and stating their pertinence. For the purpose of this project, only VMI is addressed in some detail. VMI arrangements have been implemented in various and distinct industries (Sui et al. 2010) and, many times, the motivation for this type of change differs from one company to another. There is a lot of information regarding this topic, thus, the next subchapter is an overview of the most relevant information in order to meet the purpose of this project.
2.3.1 Vendor Managed Inventory
VMI was firstly developed in the mid 1980’s as a pilot project between Walmart and Procter & Gamble, being currently one of the most popular partnering initiatives on collaboration and information sharing between trading partners (Ramanathan 2010).
Christopher (2011) describes VMI as “a process through which the supplier rather than the customer manages the flow of product into the customer’s operations”. With frequently updated and accurate information regarding the customer’s inventory, like usage or consumption rate, availability and arrivals, the supplier is able to take account of the current level of inventory at the customer and the goods in transit and thus, it is also able to determine what quantity to deliver and when to dispatch it.
Therefore, a VMI environment is very different from the conventional arrangement where the customer places an order and the supplier manages to respond to that order. Under a VMI policy, there are no customer orders. The supplier is responsible for managing customer’s inventory on its behalf, deciding on the appropriate inventory of each product and on the most appropriate inventory policy to maintain these levels, as long as agreed customer service levels and minimum and maximum inventory levels are met (Sari 2008).
Some authors are more specific and distinguish this described practice of a vendor or supplier being responsible for replenishing inventory to agreed-upon min-max values in three different cases: VMI, Supplier Managed Inventory (SMI) and Vendor Managed Replenishment (VMR). Terrance and Thomas (2003) argue that the term VMI should be used to describe the relationship between a manufacturer and a retailer whereas SMI should be used in the transactions between a supplier and a manufacturer. They also refer that, in addition to inventory data, in a VMI arrangement actual sales data should be shared while in SMI
arrangements what should be transmitted is the production plans. Regarding VMR, the difference has to do with the ownership of inventory: the vendor owns the inventory till its utilization by the customer under VMI/SMI (that is, it is a consignment policy), while the customer owns the inventory under VMR. Despite the differences, however, as the rational and the main implications of the implementation of each one are similar and as many authors do not distinguish the three, a simplification is made and the term used from now on to refer to the arrangement is VMI.
Implementing VMI takes several project steps, being the main phases (Gronalt and Rauch 2008): 1) top management commitment, 2) process redesign, 3) developing inventory management systems, 4) develop a prototype, 5) test the prototype, and 6) implementation. When comparing VMI with traditional inventory management, where the buyer is entirely responsible for its own inventory shortages and excesses, Sui et al. (2010) stated that VMI can bring benefits for both parties of the relationship. For the buyer, the advantages may be:
• Increase in the service level:
As the supplier has access to its client’s information, it can better coordinate its own production and activities of supplying material to its different customers. As a result, out-of-stock situations are rarely found at the customers;
• Reduction of inventory levels:
Knowing and managing the customer’s inventory, the supplier can coordinate replenishment decisions with the purpose of keeping stock levels from being excessive. This increases inventory turns at the customer, reduces holding costs and prevents from obsolescence risks;
• Reduction of ordering and planning costs:
Ordering and planning costs are eliminated or reduced for the customer, since this responsibility is shifted to the supplier. These resources can thus be allocated to other activities.
To the supplier, the advantages may be:
• Ease in coordination of the supply process:
Better visibility into stock and consumption patterns of lower levels in the supply chain helps the supplier to understand what is happening and it can take proactive steps, instead of reactive ones, to address these issues. Whether comparing with the traditional relationship between vendor and buyer, where orders from different customers tend to arrive to the vendor at the same time (in the beginning of the week, for example), VMI is a way to avoid this overload of orders. In addition, the supplier can avail of production cost opportunities, such as capacity levelling, a more stable schedule (both in quantities and timings) and optimization of order quantities;
• Better management of transportation:
A trip with “less-than-truckload” shipment should be avoided since transportation costs can be expensive, and sometimes, in order to serve a customer, this situation happens. Taking into account the points above, VMI also allows the optimization of full truck loads.
Analysing the advantages throughout the supply chain, on their study of the effects of VMI on the bullwhip effect, Susanne and Stephan (2011) were able to demonstrate that “the use of VMI leads to dramatic reduction of the bullwhip effect in supply chains”. According to the authors, this means that VMI can solve some problems concerning coordination and thus increase profitability of supply chain members.
3 Analysis of the Present Situation
2015 was C-ITA’s best year so far in what concerns sales volume, due not only to the introduction of the new line of products, but also due to the expansion of the textile reinforcements production capacity.
Being a plant held by the Continental group, C-ITA is set as one of the primary textile reinforcements suppliers for the Continental tire plants, mainly between those which are located in Europe. Despite being a company with its own profitability goals, C-ITA offers competitive prices to the tire plants, and since C-ITA’s production capacity is significantly lower than the tire plants total needs regarding textile reinforcements, it is reasonable to assume that if C-ITA increases its production capacity, the increase in the output would be absorbed by these plants.
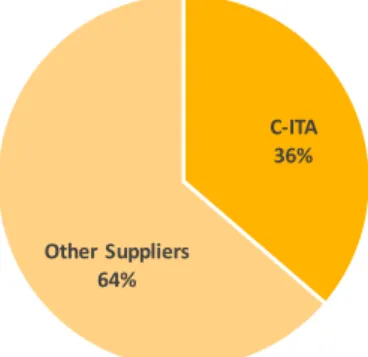
Figure 5 is sustained in the data from 2015 and it indicates that, despite working at its maximum capacity and selling nearly all the production, C-ITA supplies a few more than one third of the total needs of its main customers, which are identified in subchapter 3.1.
Figure 5 - C-ITA's total share, considering its main customers, data from 2015
The tire market has been growing and the trend suggests that it will keep up with the growth in the next years (Tire Business 2015). Tire plants are slightly increasing their orders, but since currently C-ITA has no spare capacity, it is currently struggling to deliver the quantities ordered by each customer.
The possible solution to cope with the increase in the demand, whether C-ITA’s desire is to maintain its market share or even to raise it, is to increase its production capacity. However, such measure does not have immediate impact, represents a major investment and it firstly requires a deep financial analysis and the approval to add this investment to the budget. Another possibility, which does not solve the issue but allows its mitigation in this phase and which can have immediate results is to adopt a more efficient way to manage inventory than the one it is currently in practice, in order to gain some more flexibility and product availability.
So far, C-ITA has successfully been trying to negotiate with the tire plants the amounts to deliver in order to balance the stock between all plants, shortening the global shortage risks. This concern of assuring a high service level and the great awareness towards its downstream supply chain, along with the high quality of its products, are raising C-ITA’s recognition among both Continental headquarters and tire plants.
C-ITA 36%
Other Suppliers 64%
Knowing how great the losses of stopping production in a tire plant can be, C-ITA’s managers have been particularly interested in the development of tools to analyse, among others, the evolution of the tire plants’ stock, consumption values and deviations of these to the forecasts so as to maintain solid information which can enable conscientious and grounded decisions. Normally, an ordinary supplier cannot access the tire plants data which enables this central analysis. Neither is usual a tire plant access the data from another plant, because despite the fact that all Continental plants in Europe share the same ERP system, which avoids the need to interconnect different systems, the information access depends on certain authorizations. However, being C-ITA an internal supplier with corporate supply chain responsibilities, there is a special authorization to monitor stock, consumption and forecast figures of the tire plants. So, in this case, the requirement of a trust-based relationship regarding information exchange, which is sometimes the major barrier in a collaborative model implementation (Kuk 2004), is no longer an issue.
Nonetheless, such tools serve only internal control purposes, from which C-ITA’s managers can understand the consumption behaviour of the tire plants and to predict future changes in these patterns, something which is difficult to perform just by looking individually at each plant’s figures. It is from these tools that C-ITA obtains the necessary insights to be able to negotiate the deliveries with the tire plants. From the beginning of their utilization, C-ITA has been able to attenuate some discrepancies between the orders in hand and what in fact C-ITA could deliver, but C-ITA’s managers believe that there is room for a lot more development and improvement.
The scope of this thesis is the relationship between C-ITA and its downstream supply chain entities, simply referred as its customers or the tire plants, and on how C-ITA can, from a centralized position, better control the stocks in the supply chain in order to overcome its lack of production capacity in the short-term, without investing in machinery, and still maintaining the expected service levels.
The following subchapters describe the current status of the main topics and issues of the challenge addressed.
3.1 Customers
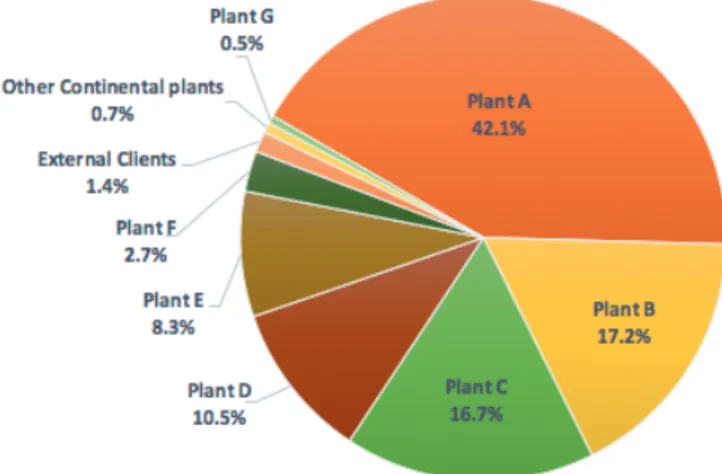
C-ITA supplies technical textiles for tire applications to approximately twenty customers. Some are supplied on a regular basis, being all of these Continental plants. The others, among which are found some Continental plants and external clients, are supplied sporadically and in low volumes when compared to the demand of the tire plants firstly mentioned. Figure 6 illustrates the importance of each of C-ITA’s customers, in terms of sales volume, in 2015.
The main customers are represented by the letters A to G. Plant A is CMIP, the tire plant located right across C-ITA’s door, which is the most important customer and represents approximately 42% of C-ITA’s revenues. Roughly 98% of the sales volume comes from the seven tire plants of the Continental group in Europe. Plant G, despite the low sales volume, is also considered in this number due to the geographical proximity to other plants.
Once among these seven tire plants are the ones being continuously supplied and since the ERP system, under which should the VMI model operate, is common to all these entities, they are the only ones taken into account for the present study.
In Figure 7 the different plants’ locations are highlighted. The products are transported almost always by truck but whether a shortage situation is imminent, the quantities needed to prevent it may be sent by air. However, this scenario is completely abnormal.
Figure 7 - C-ITA and its customers’ location
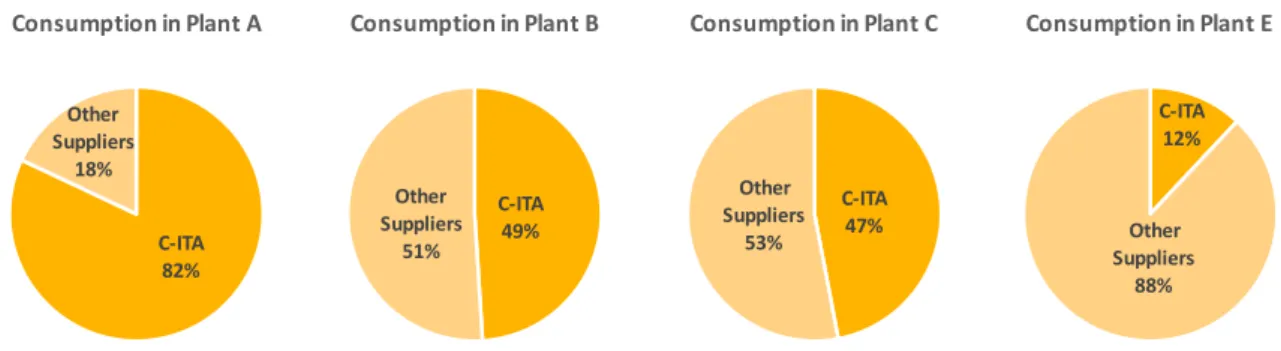
As shown in Figure 5, C-ITA is not the only textile reinforcements supplier of these seven tire plants. Figure 8 indicates more specifically C-ITA’s share in four of the seven facilities in 2015 in order to illustrate how the dependency on C-ITA’s products varies between the different tire plants.
Figure 8 - Detailed C-ITA’s share in four of the tire plants in study, in 2015
C-ITA 49% Other Suppliers 51% Consumption in Plant B C-ITA 82% Other Suppliers 18% Consumption in Plant A C-ITA 47% Other Suppliers 53% Consumption in Plant C C-ITA 12% Other Suppliers 88% Consumption in Plant E