Acceleration of Age-Associated Methylation
Patterns in HIV-1-Infected Adults
Tammy M. Rickabaugh1☯, Ruth M. Baxter2☯, Mary Sehl1,3, Janet S. Sinsheimer2,3,4, Patricia
M. Hultin5, Lance E. Hultin1, Austin Quach2, Otoniel Martínez-Maza5,6, Steve Horvath2, Eric Vilain2‡, Beth D. Jamieson1‡
*
1Department of Medicine, Division of Hematology/Oncology, AIDS Institute, University of California Los Angeles, Los Angeles, California, United States of America,2Department of Human Genetics, University of California Los Angeles, Los Angeles, California, United States of America,3Biomathematics, David Geffen School of Medicine, University of California Los Angeles, Los Angeles, California, United States of America, 4Department of Biostatistics, School of Public Health, University of California Los Angeles, Los Angeles, California, United States of America,5Department of Epidemiology, School of Public Health, University of California Los Angeles, Los Angeles, California, United States of America,6Departments of Obstetrics and Gynecology, and Microbiology, Immunology and Molecular Genetics, University of California Los Angeles, Los Angeles, California, United States of America
☯These authors contributed equally to this work. ‡These senior authors contributed equally to this work.
Abstract
Patients with treated HIV-1-infection experience earlier occurrence of aging-associated dis-eases, raising speculation that HIV-1-infection, or antiretroviral treatment, may accelerate aging. We recently described an age-related co-methylation module comprised of hundreds of CpGs; however, it is unknown whether aging and HIV-1-infection exert negative health ef-fects through similar, or disparate, mechanisms. We investigated whether HIV-1-infection would induce age-associated methylation changes. We evaluated DNA methylation levels at>450,000 CpG sites in peripheral blood mononuclear cells (PBMC) of young (20-35) and older (36-56) adults in two separate groups of participants. Each age group for each data set consisted of 12 HIV-1-infected and 12 age-matched HIV-1-uninfected samples for a total of 96 samples. The effects of age and HIV-1 infection on methylation at each CpG re-vealed a strong correlation of 0.49, p<1 x10-200and 0.47, p<1x10-200. Weighted gene cor-relation network analysis (WGCNA) identified 17 co-methylation modules; module 3 (ME3) was significantly correlated with age (cor=0.70) and HIV-1 status (cor=0.31). Older HIV-1+ individuals had a greater number of hypermethylated CpGs across ME3 (p=0.015). In a multivariate model, ME3 was significantly associated with age and HIV status (Data set 1:
βage= 0.007088, p=2.08 x 10⁻⁹;βHIV= 0.099574, p=0.0011; Data set 2:βage= 0.008762, p=1.27x 10⁻⁵;β
HIV= 0.128649, p= 0.0001). Using this model, we estimate that HIV-1 infec-tion accelerates age-related methylainfec-tion by approximately 13.7 years in data set 1 and 14.7 years in data set 2. The genes related to CpGs in ME3 are enriched for polycomb group tar-get genes known to be involved in cell renewal and aging. The overlap between ME3 and an aging methylation module found in solid tissues is also highly significant (Fisher-exact p=5.6 x 10⁻⁶, odds ratio=1.91). These data demonstrate that HIV-1 infection is associated with methylation patterns that are similar to age-associated patterns and suggest that OPEN ACCESS
Citation:Rickabaugh TM, Baxter RM, Sehl M, Sinsheimer JS, Hultin PM, Hultin LE, et al. (2015) Acceleration of Age-Associated Methylation Patterns in HIV-1-Infected Adults. PLoS ONE 10(3): e0119201. doi:10.1371/journal.pone.0119201
Academic Editor:Karen Conneely, Emory University, UNITED STATES
Received:May 6, 2014
Accepted:January 23, 2015
Published:March 25, 2015
Copyright:© 2015 Rickabaugh et al. This is an open access article distributed under the terms of the Creative Commons Attribution License, which permits unrestricted use, distribution, and reproduction in any medium, provided the original author and source are credited.
Data Availability Statement:Data are held by the Center for Analysis and Management of Multicenter AIDS Cohort Study (CAMACS). For access to the MACS data, please complete the collaboration concept sheet and identify the article for which the data were used. This form and instructions may be found at:http://statepi.jhsph.edu/macs/forms.html.
general aging and HIV-1 related aging work through some common cellular and molecular mechanisms. These results are an important first step for finding potential therapeutic tar-gets and novel clinical approaches to mitigate the detrimental effects of both HIV-1-infection and aging.
Introduction
Aging is associated with an increasing incidence of chronic, debilitating, diseases. While car-diovascular, skeletal, and neurodegenerative diseases are widely known and discussed in the general population, there is virtually no organ or tissue system that is not at risk. The mecha-nisms underlying aging and its deleterious effects are poorly understood, but thought to be multifactorial and to involve epigenetic changes [1]. Epigenetics is the alteration of DNA through modifications that do not change the underlying nucleotide sequence [2], yet are im-portant in controlling gene expression. There are many types of epigenetic regulation, includ-ing small RNAs, acetylation of histones and the methylation of cytosine residues [3]. Currently available array and sequencing technology has allowed genome-wide examination of methyla-tion levels, and there now exists a body of literature showing both global and site-specific changes in methylation patterns in relation to age [4–14].
There are several lines of evidence to suggest that HIV-1-infection accelerates at least some aspects of the aging process [15–16]. Perhaps the most dramatic piece of evidence is that suc-cessfully treated HIV-1-infection is associated with a greater susceptibility to morbidities more commonly observed in older, uninfected, individuals such as frailty [17], non-Hodgkin's lym-phoma [18], anal and cervical carcinomas [19–20], osteoporosis [21–22], liver [23–25] and renal impairment [26], cardiovascular disease [27–28], diabetes [29] and hypertension [29–30]. There is also evidence of faster disease progression in older HIV-1-infected adults [31].
As we have documented, HIV-1-infection is also associated with aging-related changes in the CD4+T-cell compartment [32]. There is a significant decrease in the number of CD31+ naïve CD4+T-cells and shortening of telomeres in the overall naïve CD4+T-cell subpopula-tion, rendering this cellular compartment more phenotypically similar to that of an uninfected adult 20–30 years older [32]. There is also evidence of telomere shortening within CD8+T-cells and a significant increase in senescent CD8+T-cells in HIV-1-infected individuals, similar to that observed in older seronegative individuals [33–34]. Together, these findings have led to the suggestion that HIV-1-infection and aging may interact in a mechanistic manner.
To date, the vast majority of data examining the interrelationship between HIV-1-infection and aging have been obtained at the cellular and organismal level. Much of these data measure outcomes and are unable to address mechanisms or pathways. For example, the finding that HIV-1-infection renders individuals more likely to develop frailty 10 years earlier than their uninfected peers [17] is an outcome. What is missing are data regarding the mechanism(s) by which HIV-1-infection contributes to the earlier manifestation of age-inappropriate clinical outcomes and how those mechanisms overlap with, or are disparate from, the mechanisms re-sponsible for aging-associated comorbidities in the absence of HIV-1-infection.
Using a systems biologic analysis approach we recently revealed a robustly defined age-related co-methylation module that is present in multiple human tissues, including saliva [35], blood, and brain [12]. These studies demonstrate that blood is a promising surrogate for other tissues when studying the effects of age on DNA methylation profiles [12,14] and that the aging module could be an important biomarker for detecting accelerated aging effects.
#5T32GM008243-25. Janet Sinsheimer is partially funded by NSF grant DMS-1264153. Data in this manuscript were collected by the Multicenter AIDS Cohort Study (MACS) and/or the Women's Interagency HIV Study (WIHS). The contents of this publication are solely the responsibility of the authors and do not represent the official views of the National Institutes of Health (NIH). MACS Principal Investigators are funded by the following sources: Johns Hopkins University Bloomberg School of Public Health (Joseph Margolick), U01-AI35042; Northwestern University (Steven Wolinsky), U01-AI35039; University of California, Los Angeles (Roger Detels), U01-AI35040; University of Pittsburgh (Charles Rinaldo), U01-AI35041; the Center for Analysis and Management of MACS, Johns Hopkins University Bloomberg School of Public Health (Lisa Jacobson), UM1-AI35043. The MACS is funded primarily by the National Institute of Allergy and Infectious Diseases (NIAID), with additional co-funding from the National Cancer Institute (NCI). Targeted supplemental funding for specific projects was also provided by the National Heart, Lung, and Blood Institute (NHLBI), and the National Institute on Deafness and Communication Disorders (NIDCD). MACS data collection is also supported by UL1-TR000424 (JHU CTSA). Research supported in this publication included work performed in the Flow Cytometry Core Facility supported by the National Institutes of Health through the National Cancer Institute under award number P30 CA016042, and through the National Institute of Allergy and Infectious Diseases, Center for AIDS Research award number 5P30 AI028697. Additional support was provided by various donor funds awarded by the David Geffen School of Medicine. The content is solely the responsibility of the authors and does not necessarily represent the official views of the National Institutes of Health or donors to the David Geffen School of Medicine. The funders had no role in study design, data collection and analysis, decision to publish, or preparation of the manuscript.
We used two unique data sets to carry out a weighted correlation network analysis
(WGCNA) of DNA methylation data and identified an age related co-methylation module, or aging module, that contains CpG sites that are hypermethylated with age. This is the first study that shows that an age-related co-module, a new biomarker of aging, detects accelerated aging epigenetic effects due to HIV infection. We also show that our systems biologic analysis based on WGCNA leads to more pronounced biological insights than a standard differential methyl-ation analysis that only considers marginal relmethyl-ationships between CpG sites and HIV infection. Comparison of this module to our previously found aging module [12] revealed that it can also be found in other solid tissues, notably human brain tissue, and may thus also measure organis-mal aging effects. These unique tools may aid in the elucidation of novel therapeutic targets for aging-related clinical diagnoses in HIV-infected and uninfected individuals.
Methods
Ethics Statement
This study was approved by the University of California, Los Angeles Medical Institutional Re-view Board and each participant was provided written, informed consent per the approved pro-tocol-IRB# 10–001677.
Participants
We selected participants from the Multicenter AIDS Cohort Study (MACS), a study of the nat-ural and treated history of HIV-1 infection in men who have sex with men [36]. There were two groups of participants in data set one: 24 of the samples were from individuals 20–24 years of age and 24 were from individuals 48–56 years of age. In each group, 12 of the samples were from HIV-1 seropositive (SP) men and 12 were from HIV-1 seronegative (SN) men. There were two groups of participants in data set two: 24 of the samples were from individuals 27–35 years of age and 24 were from individuals 36–56 years of age. In each group, 12 of the samples were from HIV-1 SP men and 12 were from HIV-1 SN men. Selection criteria included the fol-lowing characteristics: age, visit date, anti-retroviral treatment (ART) naïve (self-reported dur-ing the semi-annual MACS study visits), history of smokdur-ing, and ethnicity. Each HIV-1 seropositive sample was individually matched to a seronegative control using the selection criteria.
We examined BMI data on our participants and we do not find any significant difference in BMI for our HIV-1 seronegative and HIV-infected participants. The seronegative participants had an average BMI of 23.9 and a median BMI of 23.8. The seropositive participants had an av-erage BMI of 22.4 and a median BMI of 22.2. We also examined chronic co-infection with Hepatitis B and C, two common viruses that are known to cause chronic infection. In our first group of samples, two of the HIV-1-infected participants had chronic Hepatitis C and two of the HIV-1-infected participants had chronic Hepatitis B infection (none of the seronegatives in either group had a chronic infection).
DNA Isolation
Flow Cytometry
Cryopreserved PBMC obtained from the Multi-Center AIDS Cohort Study (MACS) repository were thawed and assayed for viability using trypan blue. The mean viability of the samples was 88%. Samples were stained for 30 minutes at 4°C with the following antibody combinations of fluorescently conjugated monoclonal antibodies using the manufacturers recommended amounts for 1 million cells: tube 1) CD57 FITC (clone HNK-1), CD28 phycoerythrin (PE, L293), CD3 peridinin chlorophyll protein (PerCP,SK7), CD45RA phycoerythrin cyanine dye Cy7 tandem (PE-Cy7, L48), CCR7 Alexa Fluor 647 (AF647, 150503), CD8 allophycocyanin H7- tandem (APC-H7, SK1) and CD4 horizon V450 (V450, RPA-T4), tube 2) HLA-DR FITC (L243), CD38 PE (HB7), CD3 PercP, CD45RO PE-Cy7 (UCHL-1), CD95-APC(DXZ), CD8 APC-H7, and CD4 V450), tube 3) CD38 FITC (HB7), IgD PE (1A6–2), CD3 PerCP, CD10 PE-Cy7 (HI10a), CD27 APC (eBioscience, clone 0323, San Diego, CA), CD19 APC-H7 (SJ25C1) and CD20 V450 (L27). Antibodies were purchased from BD Biosciences, San Jose, CA (BD) ex-cept as noted. Stained samples were washed twice with staining buffer and run immediately on an LSR2 cytometer equipped with a UV laser (BD, San Jose, CA) for the detection of 4’ ,6-diami-dino-2-phenylindole dihydrochloride (DAPI) which was used as a viability markers at a final concentration 0.1 ug/ml. Lineage gated isotype controls to measure non-specific binding were run and used CD3, CD4 and CD8 for T-cells or CD19 for B-cells. Fluorescence minus one con-trols (FMO) were also utilized to assist gating and cursor setting. 20,000 to 100,000 lymphocytes were acquired and analyzed per sample using the FACSDiva software package (BD, San Jose).
Methylation Arrays
Methylation status, at over 450,000 CpG sites, was measured to single-base resolution using Infinium methylation 450 arrays. These arrays interrogate methylation sites covering 99% of RefSeq genes with an average of 17 CpG sites throughout the promoter 5’and 3’UTRs and coding regions of each gene. In addition the arrays cover CpG islands, island shores and other sites distributed throughout the genome. Genomic DNA was prepared as described above. For both data sets, each SP sample had a matched SN control that was placed on the same chip. Samples were divided so that each chip contained 3 paired samples from the younger age group and 3 paired samples from the older age group. Within each chip the samples were ar-ranged so that SP samples were not placed in adjacent spots with their matched SN controls, the older and younger samples were alternated, and one of each type of sample on the chip oc-cupied each corner.
Microarray hybridization was performed by the Southern California Genotyping Consortium at UCLA. 500 ng of genomic DNA was bisulfate converted using the EZ-methylation kit (Zymo Research). The chips were processed using the Illumina Infinium whole genome genotyping protocol. Labeled samples were hybridized to the Illumina Human-Methylation450 arrays, scanned (iScan reader, Illumina), andβ(methylation) values were obtained using GenomeStudio software. We followed the standard protocol of Illumina methylation assays, which quantifies methylation levels by theβvalue using the ratio of intensities between methylated (signal B) and unmethylated (signal A) alleles. Specifically, theβvalue was calculated from the intensity of the methylated (M corresponding to signal A) and unmethylated (U corresponding to signal B) al-leles, as the ratio of fluorescent signalsβ= Max(M,0)/[Max(M,0) +Max(U,0) + 100]. Thus,β val-ues range from 0 (completely unmethylated) to 1 (completely methylated).
dilation), which adjusts beta-values of type II probes into a statistical distribution characteristic of type I probes [37]. We used the background corrected beta value values and subsequently the BMIQ normalization procedure. We did not filter out any CpGs since our module based analysis is unaffected by possibly misannotated CpG sites.
Weighted correlation network analysis for finding co-methylation
modules
Correlation network methodology has been widely used for studying relationships between gene transcripts. Recently, we and others have shown that these techniques are also useful for studying relationships between the DNA methylation levels of CpGs [12,35]. To describe the relationships among methylation profiles, we used a widely used approach: weighted correla-tion network analysis (WGCNA) [38]. Since prior work had shown that CpGs with a positive age relationships have a different biological interpretation than negatively correlated CpGs [12], we used signed weighted correlation network analysis that leads to co-methylation mod-ules comprised of positively related CpGs. The goal of our WGCNA analysis was i) to identify modules, and ii) to calculate a representative of each module (module eigenvectors), iii) to cor-relate module eigenvectors with age and HIV1 infection status, and iv) to define a continuous measure of module membership in the consensus module (referred to as kME).
To define modules (clusters) we used average linkage hierarchical clustering with the topo-logical overlap based dissimilarity measure because it is a highly robust measure that compares favorably with other distance measures in the case of genomic data [39–40]. Modules, branches of the resulting clustering tree, were subsequently identified using the dynamic hybrid branch cutting approach implemented in the R package dynamicTreeCut [41]. Because each module groups together highly correlated methylation profiles, it is useful to summarize the profiles in each module using a single representative profile. Here we use the module eigenvector [42], defined as the first principal component of the module methylation matrix. For each module, its module eigenvector can be used to define a measure of module membership, denoted kME, which quantifies how close a methylation profile is to the module. Specifically, for each methyl-ation profile and each module, kME is defined as the correlmethyl-ation of the methylmethyl-ation profile with the module eigenvector. Defining module membership as correlation allows one to easily calculate the statistical significance (P-value) of each module membership. Module member-ship measures allow one to efficiently annotate all 480k CpGs on the Illumina Infinium 450K array with respect to module membership [43]. CpGs with high kME values with respect to a particular module are informally referred to as intramodular hub CpGs.
Module preservation statistics
An advantage of WGCNA is that it provides powerful module preservation statistics that assess whether the density (how tight interconnections among genes in a module are) and connectivi-ty patterns of individual modules (for example, intramodular hub gene status) are preserved between two data sets [44]. To assess the preservation our modules from the first data set (ref-erence network) in the test network (second HIV data sets), we used the R function‘ module-Preservation’in the WGCNA R package, as this quantitative measure of module preservation enables rigorous argument that a module is not preserved [44]. By averaging the several preser-vation statistics generated through many permutations of the original data, aZsummaryvalue is
calculated, which summarizes the evidence that a module is preserved and indicative of module robustness and reproducibility. In general, modules withZsummaryscores>10 are interpreted
scores between 2 and 10 are weak to moderately preserved, andZsummaryscores<2 are
not preserved.
Determination of Reproducibility of the Data Sets
Standard screening for HIV-CpG associations was conducted using unpaired two-tailed t-tests and q-value adjustment with the significance threshold of q<0.05. The agreement of these
as-sociations was assessed between datasets using Pearson’s correlation.
Evaluation using Reference Free EWAS
The Reference Free EWAS package developed by Housemanet al. was applied to our PBMC
datasets to assess the influence of cell subset proportions on the association of HIV-CpG meth-ylation associations [45]. Age and HIV status were used as covariates in generating the
refFreeEWAS model, and the number of latent variables estimated by random matrix theory was 5 and 13 for data sets 1 and 2, respectively. Pearson’s correlation was used to determine the concordance between datasets before and after RefFreeEWAS adjustment.
Results
The effects of HIV-1 infection on changes in methylation are additive
with the effects of aging
To investigate the effects of HIV-1 infection on methylation patterns and distribution of cell types in peripheral blood we obtained cryopreserved peripheral blood mononuclear cells (PBMC) from the Multicenter AIDS Cohort Study (MACS) [36]. For data set one, samples ob-tained were from younger (20–24 years) and older adults (48–56 years). Each group consisted of 12 HIV-1-infected individuals and 12 age-matched HIV-1 uninfected controls. For data set two, samples were obtained from a different group of younger (27–35 years) and older adults (36–56 years), with each group containing the same number of HIV-1-infected and uninfected samples as data set one. To avoid the confounding effects of anti-retroviral therapy (ART), all of the HIV-1-infected participants were ART naïve.
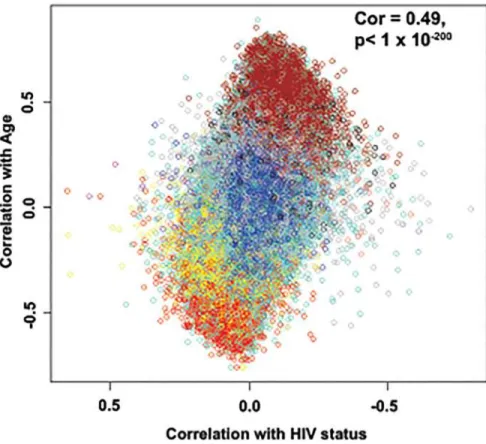
Methylation levels were measured at over 450,000 individual sites using Infinium methyla-tion 450K arrays. The relamethyla-tionship between the effects of age and HIV-1 infecmethyla-tion on changes in the degree of methylation at each site was assessed and revealed a strong correlation of 0.49, p<1 x10-200for data set one (Fig. 1) and 0.47, p<1x10-200for data set two (data not shown).
Also, the reproducibility of the association of HIV status and methylation correlated signifi-cantly between both data sets (S1 Fig.). Interestingly, a subset of sites that are hypermethylated with age show a further increase in methylation in individuals infected with HIV-1, while a subset of sites hypomethylated with age was associated with earlier hypomethylation in HIV-1-infected individuals in both data sets.
HIV-1 infection accelerates age related changes in methylation
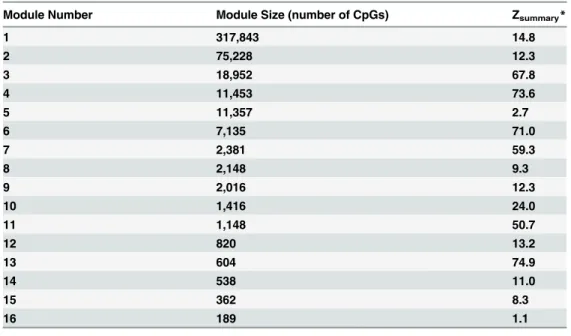
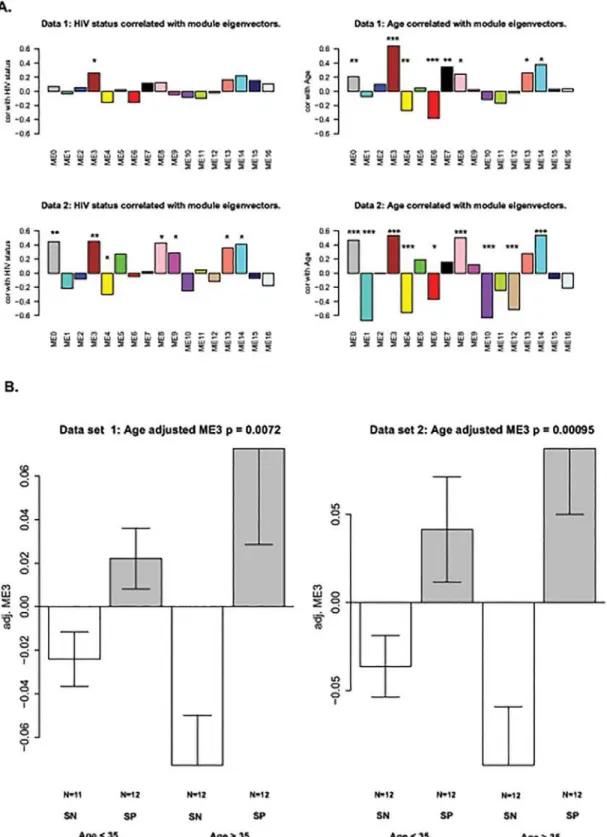
We used the blockwise modules function in the WCGNA R package [38] to identify co-methylation modules in the co-methylation dataset. A co-co-methylation module is a cluster of CpGs that are correlated with each other across the samples analyzed. To determine the module pres-ervation between the data sets, a Zsummaryscore was also obtained using the R function‘This analysis showed that the effects of HIV-1-infection and age (Fig. 2A) result in similar clustering patterns in both data sets, suggesting that similar methylation sites are affected by both age and HIV-1-infection. Module 3, ME3, showed the strongest positive correlation for both age and HIV-1 status. Module 3 is also highly preserved between both data sets with Zsummaryscores of 67.8 (Table 1) [44]. Overall, the expression pattern of the module 3
eigen-gene across participant groups shows that CpGs of the module tend to be significantly hyper-methylated in HIV+ subjects compared to HIV- subjects. The results are more pronounced for older subjects (Fig. 2B).
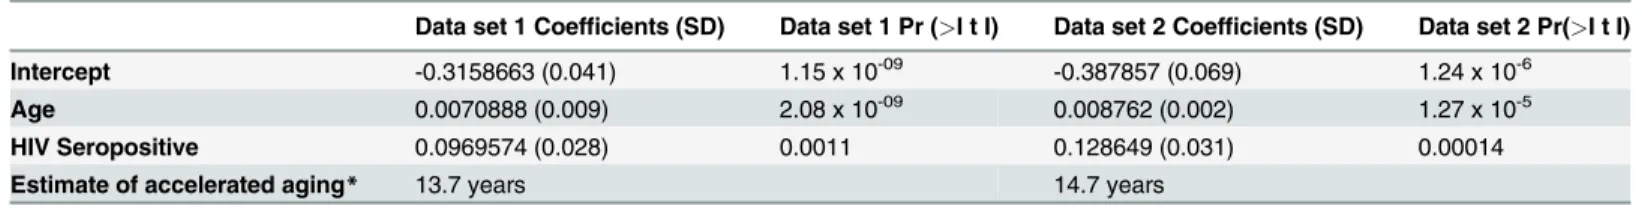
In a multivariate model examining associations between methylation, age and HIV status, module 3 was significantly associated with both age (data set one: p = 2.08 x 10⁻⁹; data set two: p = 1.27 x 10⁻⁵) and HIV-1 status (data set one: p = 0.0011; data set two: p = 0.0001) (Table 2). Using this model, we estimate that HIV-1 infection accelerates age-related methylation changes in peripheral blood mononuclear cells by an average of 13.7 years in data set one and 14.7 years in data set 2 (Table 2).
The numbers of activated, memory, and senescent T-cells positively
correlate with Module 3
Both aging and HIV-1-infection have been associated with similar changes within the lympho-cyte compartment [46–47]. To assess whether these cellular changes are also associated with
Fig 1. Age effects versus HIV-1 effects on methylation status.Methylation differences for each of the 24 pairs of samples were calculated and a paired t-test was performed for each of the CpG sites on the 450K array. The HIV-1 effect (X-axis) was measured as the signed logarithm of the Student t-test p-value. Age effects (Y-axis) were measured by the Pearson correlation coefficient with age. Each dot is colored according to its module membership (SeeFig. 2). This is a representative figure for both data sets.
age or HIV-1-specific methylation patterns, the absolute numbers of various T and B cell sub-sets in the periphery were assessed using flow cytometry on an aliquot of cells from the same vial that yielded cells for methylation analysis. Cell surface markers known to differentiate naïve, memory, terminally differentiated, and activated T-cells, as well as immature/mature B-cells, were used.
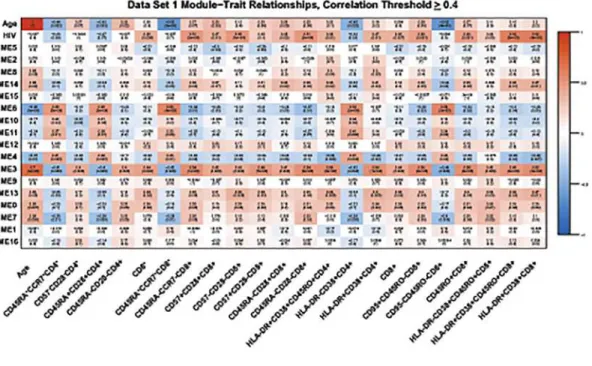
Using this flow cytometry data, we found that methylation status does correlate highly with absolute numbers of several T-cell subsets in both data sets.Fig. 3shows the module-trait rela-tionships between different T-cell subsets identified by flow cytometry and each module with a correlation value of0.4. In addition to correlating with HIV-1 status and age, many T-cell subsets are also strongly positively correlated (correlation coefficient0.34) with module 3 (Table 3). Interestingly, the absolute numbers of cells within specific T-cell subsets that were positively correlated with module 3 were effector/memory, senescent, and activated CD4+and CD8+T-cells (Fig. 3andTable 3), all subsets known to increase during aging and HIV-1-infec-tion. Naïve CD4+and CD8+T-cells showed a negative correlation (0.34) with module 3 (Fig. 3andTable 3) and no significant correlation with module 3 was seen for B-cell subsets.
In order to explore whether these effects are due to changes in cellular composition as a re-sult of HIV infection or aging, we applied the RefFreeEWAS algorithm to both of our data sets (S2andS3Figs.). This algorithm corrects for changes in cellular composition [45]. The RefFreeEWAS adjusted HIV and aging coefficients were significantly correlated to the unad-justed coefficients for both data sets (S2 Fig.). Also, the reproducibility of both RefFreeEWAS adjusted and unadjusted HIV and aging coefficients significantly correlated between both data sets (S3 Fig.). We also performed a multivariate regression model to determine if the effect of HIV infection on module 3 is only due to changes in cell number of senescent cells, such as CD57+CD28-CD8+cells. After accounting for the methylation changes resulting from
Table 1. Module preservation between data sets.
Module Number Module Size (number of CpGs) Zsummary*
1 317,843 14.8
2 75,228 12.3
3 18,952 67.8
4 11,453 73.6
5 11,357 2.7
6 7,135 71.0
7 2,381 59.3
8 2,148 9.3
9 2,016 12.3
10 1,416 24.0
11 1,148 50.7
12 820 13.2
13 604 74.9
14 538 11.0
15 362 8.3
16 189 1.1
*Zsummary>10: module highly preserved
Zsummary>5: module moderately preserved
Zsummary<2: module not preserved
Fig 2. Relating modules to HIV-status and age.Co-methylation modules for HIV-1 status and aging (A) were identified using the blockwise modules function in WCGNA R package. The significant p values for the modules are indicated as follows:*= p0.05,**= p0.01,***= p0.001 (B) A box plot depicting module 3 versus age and HIV status.
CD57+CD28-CD8+cells, it appears that some of the effect is due to an increase in this subset, but there is still a significant effect of HIV infection on module 3 (S1 Table).
Polycomb Group Target genes (PCGT) are highly represented in
Module 3
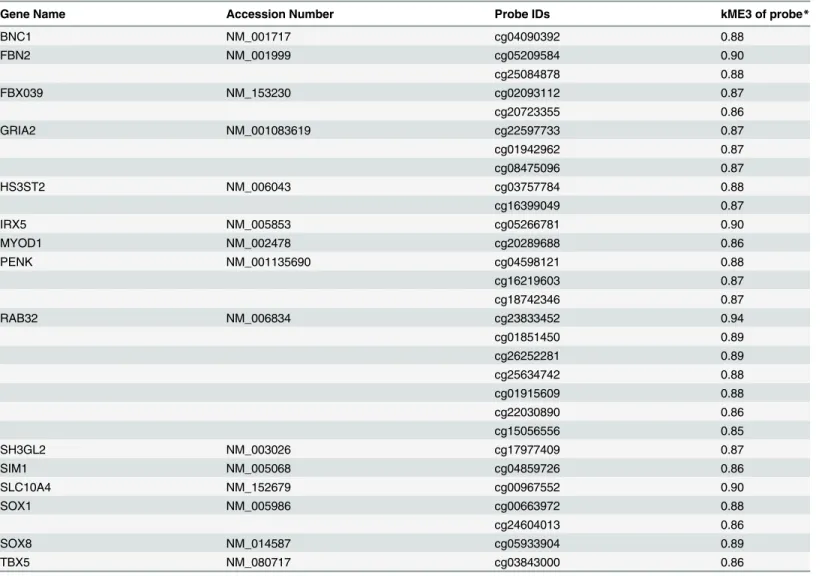
Module eigenvector 3 contains 18,952 CpGs (Table 1). In order to begin the process of identify-ing the genes that fell within this module, we calculated the module membership value (kME) for each CpG within module 3 using the module eigenvector based connectivity measure[43]. Specifically, for each methylation profile and each module, kME is defined as the correlation of the methylation profile with the module eigenvector. Within the list of 990 CpGs that were found to have a kME>0.85, the most stringent cut-off, there were 14 polycomb group target
genes (PCGT) as described by Teschendorff et al. [10] (Table 4). We used this high threshold of 0.85 in order to narrow down the list of intramodular modular hubs to roughly 1000 CpGs (990 exactly), but our results are largely unchanged if other thresholds are chosen. Polycomb group target genes (PCGT) have been shown to be involved in cell renewal, aging and cancer [48–52]. Of note, seven of the PCGT genes in module 3 were represented by multiple different CpG sites that have extremely high kME values. Most striking wasRAB32which was represented by seven
different probes, one of which had the kME value of 0.94, the 3rdhighest value of any probe in module 3. BothPENKandGRIA2were represented in module 3 by three different probes, and a
further four genes were represented by two CpG sites (Table 4). The presence of multiple PCGT genes in the module most strongly associated with aging and HIV-1 infection supports a func-tional association between increased methylation at these sites and aging of the cell.
Discussion
These are the first data to show that HIV-1 infection is associated with methylation patterns that are similar to those seen with aging in the general population. Examination of the effects of aging, and the effects of HIV, showed that aging has a stronger effect on changes in methyla-tion. Marginal analysis of the data showed that HIV-1 infection does not have a significant global effect. However, in two separate data sets which significantly correlated with each other, a subset of CpG sites that are hypermethylated with age showed a further increase of methyla-tion levels in individuals infected with HIV-1 (Figs.1and2B). Additionally, a group of sites that show hypomethylation with age are further demethylated in the HIV-1 infected group (Figs.1and2B). Thus, although we have not identified a strong methylation signature associat-ed with HIV-1 infection, our data show that the effects of HIV-1 infection at a subset of meth-ylation sites appear to be additive with the effects of aging.
Multiple studies have shown the effects of HIV-1 infection on the aging of the immune sys-tem [15,32–33]. Our own studies on telomere length and decreasing numbers of naïve T-cells
Table 2. Estimating accelerated aging due to HIV-1 infection using a multivariate model.
Data set 1 Coefficients (SD) Data set 1 Pr (>I t I) Data set 2 Coefficients (SD) Data set 2 Pr(>I t I)
Intercept -0.3158663 (0.041) 1.15 x 10-09 -0.387857 (0.069) 1.24 x 10⁻⁶
Age 0.0070888 (0.009) 2.08 x 10-09 0.008762 (0.002) 1.27 x 10⁻⁵
HIV Seropositive 0.0969574 (0.028) 0.0011 0.128649 (0.031) 0.00014
Estimate of accelerated aging* 13.7 years 14.7 years
*Using the output above, it is estimated that HIV status accelerates age by 13.7 and 14.7 years (defined by HIV coefficient/Age coefficient)
Fig 3. Heat map of module-trait relationships.This heat map shows correlations between HIV status, chronological age, and the co-methylation module (represented by their eigenvectors) for data set one (A) and data set two (B). Included are cell subsets whose absolute numbers have an absolute correlation with module 3 that was0.4. Red depicts a positive correlation, blue depicts a negative correlation, as indicated by the color band on the right.
showed that individuals with HIV-1 infection appeared immunologically similar to uninfected individuals twenty to thirty years older [32]. It has also been shown that HIV-1 infected indi-viduals develop frailty ten years younger than uninfected indiindi-viduals [17] and coronary artery calcium measurements show a coronary artery“age”that is accelerated by approximately 15 years with HIV-1 infection [53]. Thus, our data showing HIV-1 acceleration of aging by 13.7 years in data set one and 14.7 years in data set 2, as measured by methylation analysis, fits well with these other studies. As such, it would change if we used other modules or other epige-netic biomarkers of aging [14]. We have focused on module 3 as it showed the strongest posi-tive correlation for both age and HIV-1 status.
Interestingly, we found that absolute numbers of effector/memory, activated, and senescent T-cells in both data sets positively correlated with module 3, the same module that correlated significantly with aging and HIV status. Among the many changes that occur in the immune system with aging, the accumulation of CD28-CD8+T-cells, referred to as senescent CD8+ T-cells, is strongly correlated with age, reduced vaccine efficacy, increased autoimmunity and the development of aging-related comorbidities such as frailty, bone loss and cardiovascular disease [46–47,54]. Together with decreased T-cell responses to mitogen and reduced B-cell numbers, an inverted CD4+/CD8+T-cell ratio and the accumulation of CD28-CD8+T-cells was found to be associated with an increased risk of morbidities and mortalities in the OCTO/ NONA studies of elderly individuals [55]. In addition to other functional and phenotypic per-turbations, these CD28-CD8+T-cells secrete IL-6 and TNF-alpha, thereby directly contribut-ing to the systemic inflammatory environment within the elderly [47]. Inflammaging, the
Table 3. T-cell subsets that correlate with module 3 with a correlation coefficient0.34.
Cell Subset Cell Phenotype Data Set 1 Correlation with ME3 (p value) Data Set 2 Correlation with ME3 (p value)
CD4+T-cells:
28 negative CD57-CD28-CD4+ 0.40 (0.005) 0.34 (0.02)
CD45RA-CD28-CD4+ 0.40 (0.006) 0.36 (0.01)
Activated HLADR+CD38+CD45RO+CD4+ 0.56 (>0.001) 0.59 (>0.001)
HLADR+CD38+CD4+ 0.54 (>0.001) 0.57 (>0.001)
Naïve CD45RA+CD28+CD4+ -0.40 (0.005) -0.39 (0.007)
CD45RA+CCR7+CD4+ -0.41 (0.005) -0.38 (0.008)
CD8+T-cells
Total CD8+ CD8+CD3+ 0.44 (0.002) 0.58 (>0.001)
Effector/Memory CD45RO+CD8+ 0.55 (>0.001) 0.69 (>0.001)
CD45RA-CCR7-CD8+ 0.54 (>0.001) 0.67 (>0.001)
CD45RA-CD28+CD8+ 0.41 (0.004) 0.60 (>0.001)
CD95+CD45RO+CD8+ 0.56 (>0.001) 0.7 (>0.001)
CD28 negative CD45RA-CD28-CD8+ 0.54 (>0.001) 0.59 (>0.001)
CD57-CD28-CD8+ 0.43 (0.003) 0.68 (>0.001)
Early Senescent CD57+CD28+CD8+ 0.42 (0.004) 0.72 (>0.001)
Senescent CD57+CD28-CD8+ 0.48 (>0.001) 0.65 (>0.001)
Activated HLADR-CD38+CD45RO+CD8+ 0.42 (0.003) 0.60 (>0.001)
HLADR+CD38+CD45RO+CD8+ 0.49 (>0.001) 0.62 (>0.001)
HLADR+CD38+CD8+ 0.52 (>0.001) 0.65 (>0.001)
Naïve CD45RA+CCR7+CD8+ -0.42 (0.004) -0.41 (0.004)
CD95-CD45RO-CD8+ -0.44 (0.002) -0.45 (0.001)
Included are subsets whose absolute counts have an absolute correlation coefficient with module 3 of0.34.
chronic inflammatory environment during aging, is itself associated with damage to organ sys-tems and increased morbidity and mortality. In an intriguing proof-of-principal investigation into the role of senescent T-cells in aging related morbidity, Baker, et al. [56] demonstrated that removal of senescent cells expressing p16Ink-4afrom a murine model of Progeria delayed the onset of aging-related diseases in several tissue and organ systems.
HIV-1-infection is thought to contribute to immunosenescence by the activation and expansion of CD8+T-cells directed against both HIV-1 and CMV. The response elicited by HIV-1-infection is also highly inflammatory. Indeed, inflammation during HIV-1-infection is associated with an increased rate of progression to AIDS and mortality [47]. We recently re-ported that HIV-1-infection was associated with premature accumulation of an immunosenes-cent phenotype which in turn was associated with faster progression to AIDS [57] leading us to speculate that HIV-1-infection does recapitulate some of the aspects of aging and that these are likely through the inflammatory response and accumulation of senescent cells associated with HIV-1-infection. Some of the changes in methylation in module 3 associated with HIV status
Table 4. Polycomb group target genes (PCGT) represented in module eigenvector 3.
Gene Name Accession Number Probe IDs kME3 of probe*
BNC1 NM_001717 cg04090392 0.88
FBN2 NM_001999 cg05209584 0.90
cg25084878 0.88
FBX039 NM_153230 cg02093112 0.87
cg20723355 0.86
GRIA2 NM_001083619 cg22597733 0.87
cg01942962 0.87
cg08475096 0.87
HS3ST2 NM_006043 cg03757784 0.88
cg16399049 0.87
IRX5 NM_005853 cg05266781 0.90
MYOD1 NM_002478 cg20289688 0.86
PENK NM_001135690 cg04598121 0.88
cg16219603 0.87
cg18742346 0.87
RAB32 NM_006834 cg23833452 0.94
cg01851450 0.89
cg26252281 0.89
cg25634742 0.88
cg01915609 0.88
cg22030890 0.86
cg15056556 0.85
SH3GL2 NM_003026 cg17977409 0.87
SIM1 NM_005068 cg04859726 0.86
SLC10A4 NM_152679 cg00967552 0.90
SOX1 NM_005986 cg00663972 0.88
cg24604013 0.86
SOX8 NM_014587 cg05933904 0.89
TBX5 NM_080717 cg03843000 0.86
*kME is defined as the correlation of the methylation profile with the module eigenvector
can be attributed to a change in numbers of senescent CD57+CD28-CD8+cells (S1 Table). However, after adjusting for this subset, there was still an effect of HIV status on methylation changes in module 3, suggesting that there are other factors, such as premature aging of naïve T-cells [32], contributing to this effect. Together, this data supports the theory that aging with-in the immune system plays an important role with-in agwith-ing of the overall organism, and our meth-ylation data suggests that HIV-1 infection may be accelerating this process using
similar mechanisms.
We found several Polycomb Group Target Genes represented by CpG’s in module 3. The Polycomb complexes contribute to organismal development by modifying the expression of their targets, the PCGT genes, through epigenetic modulation [58]. Expression of PCGT genes is repressed in stem cells through high levels of methylation as a mechanism of preventing dif-ferentiation [58]. Hypermethylation resulting in repressed gene expression is also well estab-lished in tumorigenesis (reviewed in [59]). The presence of multiple PCGT genes within the module 3 kME>0.85 group suggests that decreased expression of PCGT genes and the
conse-quent return of cells to less differentiated forms contributes to the increased susceptibility to cancer observed during aging and HIV-1-infection. Most of the PCGT genes in the module 3 kME>0.85 group were represented by more than one CpG site, and, strikinglyRAB32was
rep-resented by seven CpG sites. The fact that seven CpGs associated withRAB32show increased
methylation strongly suggests that expression of this gene is suppressed in response to aging and HIV-1 infection. RAB32 is a small GTPase related to the oncogene RAS, and is involved in mitochondrial membrane dynamics and apoptosis [60]. Mitochondrial dysfunction is strongly related to aging and cancer [61], and decreased expression of RAB32 may result in disrupted mitochondrial dynamics and changes in apoptotic processes which would also contribute to the development of cancer. Indeed, hypermethylation of RAB32 has been identified in gastric and endometrial cancer [62].
We also evaluated the overlap between our module 3 and the aging module recently de-scribed by Horvath, et al. [12]. The degree of overlap with the aging module, found in human brain tissues and other solid tissues [12] is highly significant (Fisher-exact p-value = 5.6 x 10⁻⁶, odds ratio = 1.91). Interestingly, one of the overlapping genes represented by both modules (the aging module and our module 3) isRAB32, which we discussed above. These results
strongly suggest that our module 3 is not specific to blood tissue. Future research should evalu-ate whether module 3 also reveals HIV relevalu-ated age acceleration effects in other solid tissues. Taken together, these data suggest that HIV-1-infection does accelerate some aspects of aging and that general aging and HIV-1 related aging work through at least some common mecha-nisms. These results are an important first step for finding potential therapeutic approaches to mitigate the effects of both HIV and aging.
Supporting Information
S1 Fig. Reproducibility of HIV and CpG-methylation Associations between Data Sets 1 and 2.CpG methylation was tested for the association with HIV-status by an unpaired t-test. One percent of all applicable CpG probes were randomly sampled and the corresponding t-val-ues for data set 1 and 2 were used for representative plotting. The t-valt-val-ues between data sets were found to have a Pearson correlation of 0.39 (p<10-200). The black line represents the
identity of t-values between datasets. (EPS)
S2 Fig. Effects of RefFreeEWAS-adjustment on HIV and Age Coefficients within Data Sets.
The corresponding coefficients were used for representative plotting within each dataset. The black lines represent the identity of coefficients before and after RefFreeEWAS adjustment. (EPS)
S3 Fig. Reproducibility of HIV and Age Coefficients between Data Sets before and after RefFreeEWAS-adjustment.Reference Free EWAS models were generated using HIV status and age as covariates. Pearson’s correlation was computed between data sets 1 and 2 for before and after adjustment. Representative plots were generated by randomly sampling one percent of applicable CpGs and plotting their corresponding covariate coefficients for comparison be-tween data sets. The black lines represent the identity of the coefficients bebe-tween datasets. (EPS)
S1 Table. Multivariate regression model determining contribution of CD57+CD28-CD8+T cells to differences in methylation with HIV infection.
(DOCX)
Acknowledgments
We thank all the study participants for their contribution to this work. The cryopreserved sam-ples were obtained from the University of California, Los Angeles site of the Multi-Center AIDS Cohort Study (MACS) (P.I.s Roger Detels, Otoniel Martínez-Maza). We would also like to thank Kevin Barrett for his assistance in sample selection and John Oishi for his oversight of the UCLA site of the MACS. The flow cytometry data was obtained using the CFAR/JCCC Flow Cytometry Core Facility at UCLA. The methylation data was produced with the assis-tance of the Neuroscience Genomics Core at UCLA.
Author Contributions
Conceived and designed the experiments: TMR RMB EV BDJ. Wrote the paper: TMR RMB MS JSS SH EV BDJ. Selected and acquired samples from the MACS, assisted in data interpreta-tion: TMR. Carried out DNA extractions, assisted in data interpretainterpreta-tion: RMB. Analyzed the methylation data, provided statistical advice and data interpretation: MS JSS. Designed the flow cytometry antibody panel, collected the data, and performed the analysis of the acquired flow data: PH LH. Did the RefFreeEWAS analysis and created the supplemental figures: AQ. Analyzed the methylation/flow data, provided statistical advice and data interpretation: SH. Co-PI of the Los Angeles site of the MACS and assisted in selecting and acquiring samples for the study: OMM. Assisted in data interpretation: EV BDJ
References
1. Gonzalo S. Epigenetic alterations in aging. J Appl Physiol. 2010; 109: 586–597. doi:10.1152/
japplphysiol.00238.2010PMID:20448029
2. Berger SL, Kouzarides T, Shiekhattar R, Shilatifard A. An operational definition of epigenetics. Genes Dev. 2009; 23: 781–783. doi:10.1101/gad.1787609PMID:19339683
3. Bonasio R, Tu S, Reinberg D. Molecular signals of epigenetic states. Science. 2010; 330: 612–616.
doi:10.1126/science.1191078PMID:21030644
4. Hannum G, Guinney J, Zhao L, Zhang L, Hughes G, Sadda S, et al. Genome-wide Methylation Profiles Reveal Quantitative Views of Human Aging Rates. Mol Cell. 2013; 49: 359–367. doi:10.1016/j.molcel.
2012.10.016PMID:23177740
5. Bell JT, Tsai PC, Yang TP, Pidsley R, Nisbet J, Glass D, et al. Epigenome-wide scans identify differen-tially methylated regions for age and age-related phenotypes in a healthy ageing population. PLoS Genet. 2012; 8: e1002629. doi:10.1371/journal.pgen.1002629PMID:22532803
7. Ben-Avraham D, Muzumdar RH, Atzmon G. Epigenetic genome-wide association methylation in aging and longevity. Epigenomics. 2012; 4: 503–509. doi:10.2217/epi.12.41PMID:23130832
8. Christensen BC, Houseman EA, Marsit CJ, Zheng S, Wrensch MR, Wiemels JL, et al. Aging and envi-ronmental exposures alter tissue-specific DNA methylation dependent upon CpG island context. PLoS Genet. 2009; 5: e1000602. doi:10.1371/journal.pgen.1000602PMID:19680444
9. Bollati V, Schwartz J, Wright R, Litonjua A, Tarantini L, Suh H, et al. Decline in genomic DNA methyla-tion through aging in a cohort of elderly subjects. Mech Ageing Dev. 2009; 130: 234–239. doi:10.1016/
j.mad.2008.12.003PMID:19150625
10. Teschendorff AE, Menon U, Gentry-Maharaj A, Ramus SJ, Weisenberger DJ, Shen H, et al. Age-de-pendent DNA methylation of genes that are suppressed in stem cells is a hallmark of cancer. Genome Res. 2010; 20: 440–446. doi:10.1101/gr.103606.109PMID:20219944
11. Rodriguez-Rodero S, Fernandez-Morera JL, Fernandez AF, Menendez-Torre E, Fraga MF. Epigenetic regulation of aging. Discov Med. 2010; 10: 225–233. PMID:20875344
12. Horvath S, Zhang Y, Langfelder P, Kahn RS, Boks MP, van Eijk K, et al. Aging effects on DNA methyla-tion modules in human brain and blood tissue. Genome Biol. 2012; 13: R97. doi:
10.1186/gb-2012-13-10-r97PMID:23034122
13. Rakyan VK, Down TA, Maslau S, Andrew T, Yang TP, Beyan H, et al. Human aging-associated DNA hypermethylation occurs preferentially at bivalent chromatin domains. Genome Res. 2010; 20: 434–439. doi:10.1101/gr.103101.109PMID:20219945
14. Horvath S. DNA methylation age of human tissues and cell types. Genome Biol. 2013; 14: R115. PMID:
24138928
15. Appay V, Almeida JR, Sauce D, Autran B, Papagno L. Accelerated immune senescence and HIV-1 in-fection. Experimental Gerontology. 2007; 42: 432–437. PMID:17307327
16. Effros RB, Fletcher CV, Gebo K, Halter JB, Hazzard WR, Horne FM, et al. Aging and infectious dis-eases: workshop on HIV infection and aging: what is known and future research directions. Clinical In-fectious Diseases. 2008; 47: 542–553. doi:10.1086/590150PMID:18627268
17. Desquilbet L, Jacobson LP, Fried LP, Phair JP, Jamieson BD, Holloway M, et al. HIV-1 infection is as-sociated with an earlier occurrence of a phenotype related to frailty. J GerontolA BiolSciMedSci. 2007; 62: 1279–1286. PMID:18000149
18. Engels EA, Pfeiffer RM, Landgren O, Moore RD. Immunologic and virologic predictors of AIDS-related non-hodgkin lymphoma in the highly active antiretroviral therapy era. J AcquirImmuneDeficSyndr. 2010; 54: 78–84.
19. D'Souza G, Wiley DJ, Li X, Chmiel JS, Margolick JB, Cranston RD, et al. Incidence and epidemiology of anal cancer in the multicenter AIDS cohort study. J AcquirImmuneDeficSyndr. 2008; 48: 491–499. 20. Dorrucci M, Suligoi B, Serraino D, Tirelli U, Rezza G. Incidence of invasive cervical cancer in a cohort of
HIV-seropositive women before and after the introduction of highly active antiretroviral therapy. J AcquirImmuneDeficSyndr. 2001; 26: 377–380.
21. Thomas J, Doherty SM. HIV infection—a risk factor for osteoporosis. J AcquirImmuneDeficSyndr. 2003; 33: 281–291.
22. Fausto A, Bongiovanni M, Cicconi P, Menicagli L, Ligabo EV, Melzi S, et al. Potential predictive factors of osteoporosis in HIV-positive subjects. Bone. 2006; 38: 893–897. PMID:16377270
23. Weber R, Sabin CA, Friis-Moller N, Reiss P, El-Sadr WM, Kirk O, et al. Liver-related deaths in persons infected with the human immunodeficiency virus: the D:A:D study. Archives of Internal Medicine. 2006; 166: 1632–1641. PMID:16908797
24. Hooshyar D, Hanson DL, Wolfe M, Selik RM, Buskin SE, McNaghten AD. Trends in perimortal condi-tions and mortality rates among HIV-infected patients. AIDS. 2007; 21: 2093–2100. PMID:17885300
25. Arnold DM, Julian JA, Walker IR. Mortality rates and causes of death among all HIV-positive individuals with hemophilia in Canada over 21 years of follow-up. Blood. 2006; 108: 460–464. PMID:16551974
26. Lucas GM, Mehta SH, Atta MG, Kirk GD, Galai N, Vlahov D, et al. End-stage renal disease and chronic kidney disease in a cohort of African-American HIV-infected and at-risk HIV-seronegative participants followed between 1988 and 2004. AIDS. 2007; 21: 2435–2443. PMID:18025880
27. Baker JV, Peng G, Rapkin J, Abrams DI, Silverberg MJ, MacArthur RD, et al. CD4+ count and risk of non-AIDS diseases following initial treatment for HIV infection. AIDS. 2008; 22: 841–848. doi:10.1097/
QAD.0b013e3282f7cb76PMID:18427202
28. Smit C, Geskus R, Walker S, Sabin C, Coutinho R, Porter K, et al. Effective therapy has altered the spectrum of cause-specific mortality following HIV seroconversion. AIDS. 2006; 20: 741–749. PMID:
29. Triant VA, Lee H, Hadigan C, Grinspoon SK. Increased acute myocardial infarction rates and cardio-vascular risk factors among patients with human immunodeficiency virus disease. J ClinEndocrinolMe-tab. 2007; 92: 2506–2512. PMID:17456578
30. Hsue PY, Deeks SG, Farah HH, Palav S, Ahmed SY, Schnell A, et al. Role of HIV and human herpesvi-rus-8 infection in pulmonary arterial hypertension. AIDS. 2008; 22: 825–833. doi:10.1097/QAD.
0b013e3282f7cd42PMID:18427200
31. Blanco JR, Caro AM, Perez-Cachafeiro S, Gutierrez F, Iribarren JA, Gonzalez-Garcia J, et al. HIV infec-tion and aging. AIDS Rev. 2010; 12: 218–230. PMID:21179186
32. Rickabaugh TM, Kilpatrick RD, Hultin LE, Hultin PM, Hausner MA, Sugar CA, et al. The dual impact of HIV-1 infection and aging on naive CD4 T-cells: additive and distinct patterns of impairment. PLoS One. 2011; 6: e16459. doi:10.1371/journal.pone.0016459PMID:21298072
33. Effros RB, Allsopp R, Chiu CP, Hausner MA, Hirji K, Wang L, et al. Shortened telomeres in the expand-ed CD28_ CD8 + cell subset in HIV disease implicate replicative senescence in HIV pathogenesis. AIDS. 1996; 10: F17–F22. PMID:8828735
34. Effros RB. Telomeres and HIV disease. Microbes and Infection. 2000; 2: 69–76. PMID:10717543
35. Bocklandt S, Lin W, Sehl ME, Sanchez FJ, Sinsheimer JS, Horvath S, et al. Epigenetic predictor of age. PLoS One. 2011; 6: e14821. doi:10.1371/journal.pone.0014821PMID:21731603
36. Kaslow RA, Ostrow DG, Detels R, Phair JP, Polk BF, Rinaldo CR Jr. The Multicenter AIDS Cohort Study: Rationale, organization, and selected characteristics of the participants. American Journal of Epidemiology. 1987; 126: 310–318. PMID:3300281
37. Teschendorff AE, Marabita F, Lechner M, Bartlett T, Tegner J, Gomez-Cabrero D, et al. A beta-mixture quantile normalization method for correcting probe design bias in Illumina Infinium 450 k DNA methyla-tion data. Bioinformatics. 2013; 29: 189–196. doi:10.1093/bioinformatics/bts680PMID:23175756
38. Langfelder P, Horvath S. WGCNA: an R package for weighted correlation network analysis. BMC Bioin-formatics. 2008; 9: 559. doi:10.1186/1471-2105-9-559PMID:19114008
39. Yip AM, Horvath S. Gene network interconnectedness and the generalized topological overlap mea-sure. BMC Bioinformatics. 2007; 8: 22. PMID:17250769
40. Song L, Langfelder P, Horvath S. Comparison of co-expression measures: mutual information, correla-tion, and model based indices. BMC Bioinformatics. 2012; 13: 328. doi:10.1186/1471-2105-13-328
PMID:23217028
41. Langfelder P, Zhang B, Horvath S. Defining clusters from a hierarchical cluster tree: the Dynamic Tree Cut package for R. Bioinformatics. 2008; 24: 719–720. PMID:18024473
42. Langfelder P, Horvath S. Eigengene networks for studying the relationships between co-expression modules. BMC Syst Biol. 2007; 1: 54. PMID:18031580
43. Horvath S, Dong J. Geometric interpretation of gene coexpression network analysis. PLoS Comput Biol. 2008; 4: e1000117. doi:10.1371/journal.pcbi.1000117PMID:18704157
44. Langfelder P, Luo R, Oldham MC, Horvath S. Is my network module preserved and reproducible? PLoS Comput Biol. 2011; 7: e1001057. doi:10.1371/journal.pcbi.1001057PMID:21283776
45. Houseman EA, Molitor J, Marsit CJ. Reference-free cell mixture adjustments in analysis of DNA methyl-ation data. Bioinformatics. 2014; 30: 1431–1439. doi:10.1093/bioinformatics/btu029PMID:24451622
46. Deeks SG, Verdin E, McCune JM. Immunosenescence and HIV. Curr Opin Immunol. 2012.
47. Dock JN, Effros RB. Role of CD8 T Cell Replicative Senescence in Human Aging and in HIV-mediated Immunosenescence. Aging Dis. 2011; 2: 382–397. PMID:22308228
48. Hansen KH, Bracken AP, Pasini D, Dietrich N, Gehani SS, Monrad A, et al. A model for transmission of the H3K27me3 epigenetic mark. Nat Cell Biol. 2008; 10: 1291–1300. doi:10.1038/ncb1787PMID:
18931660
49. Petruk S, Sedkov Y, Johnston DM, Hodgson JW, Black KL, Kovermann SK, et al. TrxG and PcG pro-teins but not methylated histones remain associated with DNA through replication. Cell. 2012; 150: 922–933. doi:10.1016/j.cell.2012.06.046PMID:22921915
50. Sauvageau M, Sauvageau G. Polycomb group proteins: multi-faceted regulators of somatic stem cells and cancer. Cell Stem Cell. 2010; 7: 299–313. doi:10.1016/j.stem.2010.08.002PMID:20804967
51. Luis NM, Morey L, Mejetta S, Pascual G, Janich P, Kuebler B, et al. Regulation of human epidermal stem cell proliferation and senescence requires polycomb- dependent and-independent functions of Cbx4. Cell Stem Cell. 2011; 9: 233–246. doi:10.1016/j.stem.2011.07.013PMID:21885019
52. Richly H, Aloia L, Di Croce L. Roles of the Polycomb group proteins in stem cells and cancer. Cell Death Dis. 2011; 2: e204. doi:10.1038/cddis.2011.84PMID:21881606
54. High KP, D'Aquila RT, Fuldner RA, Gerding DN, Halter JB, Haynes L, et al. Workshop on immuniza-tions in older adults: identifying future research agendas. J Am Geriatr Soc. 2010; 58: 765–776. doi:10.
1111/j.1532-5415.2010.02772.xPMID:20398161
55. Ferguson FG, Wikby A, Maxson P, Olsson J, Johansson B. Immune parameters in a longitudinal study of a very old population of Swedish people: a comparison between survivors and nonsurvivors. J Ger-ontol A Biol Sci Med Sci. 1995; 50: B378–B382. PMID:7583794
56. Baker DJ, Wijshake T, Tchkonia T, LeBrasseur NK, Childs BG, van de Sluis B, et al. Clearance of p16Ink4a-positive senescent cells delays ageing-associated disorders. Nature. 2011; 479: 232–236.
doi:10.1038/nature10600PMID:22048312
57. Cao W, Jamieson BD, Hultin LE, Hultin PM, Effros RB, Detels R. Premature aging of T cells is associat-ed with faster HIV-1 disease progression. J AcquirImmuneDeficSyndr. 2009; 50: 137–147.
58. Aloia L, Di Stefano B, Di Croce L. Polycomb complexes in stem cells and embryonic development. De-velopment. 2013; 140: 2525–2534. doi:10.1242/dev.091553PMID:23715546
59. Tsai HC, Baylin SB. Cancer epigenetics: linking basic biology to clinical medicine. Cell Res. 2011; 21: 502–517. doi:10.1038/cr.2011.24PMID:21321605
60. Bui M, Gilady SY, Fitzsimmons RE, Benson MD, Lynes EM, Gesson K, et al. Rab32 modulates apopto-sis onset and mitochondria-associated membrane (MAM) properties. J Biol Chem. 2010; 285: 31590–31602. doi:10.1074/jbc.M110.101584PMID:20670942
61. Brandon M, Baldi P, Wallace DC. Mitochondrial mutations in cancer. Oncogene. 2006; 25: 4647–4662. PMID:16892079
62. Shibata D, Mori Y, Cai K, Zhang L, Yin J, Elahi A, et al. RAB32 hypermethylation and microsatellite in-stability in gastric and endometrial adenocarcinomas. Int J Cancer. 2006; 119: 801–806. PMID: