Genome-Wide DNA Methylation Analysis
Identifies Novel Hypomethylated
Non-Pericentromeric Genes with Potential Clinical
Implications in ICF Syndrome
L. Simo-Riudalbas1☯, A. Diaz-Lagares1☯, S. Gatto2¤a, M. Gagliardi2, A. B. Crujeiras1¤b, M.
R. Matarazzo2, M. Esteller1,3,4*, J. Sandoval1¤c *
1Cancer Epigenetics and Biology Program (PEBC), Bellvitge Biomedical Research Institute (IDIBELL), Barcelona, Catalonia, Spain,2Institute of Genetics and Biophysics ABT, CNR, Naples, Italy,3Department of Physiological Sciences II, School of Medicine, University of Barcelona, Barcelona, Catalonia, Spain, 4Institucio Catalana de Recerca i Estudis Avançats (ICREA), Barcelona, Catalonia, Spain
☯These authors contributed equally to this work.
¤a Current Address: Development, Aging and Regeneration Program (DARe), Sanford-Burnham Medical Research Institute, La Jolla, California, United States of America
¤b Current Address: Laboratory of Molecular and Cellular Endocrinology, Health Research Institute of Santiago (IDIS), University Hospital of Santiago (XXIS/SERGAS), Santiago de Compostela University (USC), Santiago de Compostela and CIBER Fisiopatologia de la Obesidad y la Nutrición (CIBERobn), Madrid, Spain
¤c Current Address: Laboratory of Personalized Medicine, Genomic Unit, Instituto de Investigación Sanitaria La Fe, Valencia, Spain
*[email protected](JS);[email protected](ME)
Abstract
Introduction and Results
Immunodeficiency, centromeric instability and facial anomalies syndrome (ICF) is a rare autosomal recessive disease, characterized by severe hypomethylation in pericentromeric regions of chromosomes (1, 16 and 9), marked immunodeficiency and facial anomalies. The majority of ICF patients present mutations in the DNMT3B gene, affecting the DNA methyltransferase activity of the protein. In the present study, we have used the Infinium 450K DNA methylation array to evaluate the methylation level of 450,000 CpGs in lympho-blastoid cell lines and untrasformed fibroblasts derived from ICF patients and healthy donors. Our results demonstrate that ICF-specific DNMT3B variants A603T/STP807ins and V699G/R54X cause global DNA hypomethylation compared to wild-type protein. We identi-fied 181 novel differentially methylated positions (DMPs) including subtelomeric and intra-chromosomic regions, outside the classical ICF-related pericentromeric hypomethylated positions. Interestingly, these sites were mainly located in intergenic regions and inside the CpG islands. Among the identified hypomethylated CpG-island associated genes, we con-firmed the overexpression of three selected genes, BOLL, SYCP2 and NCRNA00221, in ICF compared to healthy controls, which are supposed to be expressed in germ line and silenced in somatic tissues.
OPEN ACCESS
Citation:Simo-Riudalbas L, Diaz-Lagares A, Gatto S, Gagliardi M, Crujeiras AB, Matarazzo MR, et al. (2015) Genome-Wide DNA Methylation Analysis Identifies Novel Hypomethylated Non-Pericentromeric Genes with Potential Clinical Implications in ICF Syndrome. PLoS ONE 10(7): e0132517. doi:10.1371/ journal.pone.0132517
Editor:Robert Dante, Institut National de la Santé et de la Recherche Médicale, FRANCE
Received:December 16, 2014
Accepted:June 15, 2015
Published:July 10, 2015
Copyright:© 2015 Simo-Riudalbas et al. This is an open access article distributed under the terms of the
Creative Commons Attribution License, which permits unrestricted use, distribution, and reproduction in any medium, provided the original author and source are credited.
Data Availability Statement:The data reported in this manuscript has been deposited in the Gene Expression Omnibus (GEO) database,www.ncbi.nlm.
nih.gov/geo[accession nos. GSE30870] (DNA
Conclusions
In conclusion, this study contributes in clarifying the direct relationship between DNA meth-ylation defect and gene expression impairment in ICF syndrome, identifying novel direct tar-get genes of DNMT3B. A high percentage of the DMPs are located in the subtelomeric regions, indicating a specific role of DNMT3B in methylating these chromosomal sites. Therefore, we provide further evidence that hypomethylation in specific non-pericentro-meric regions of chromosomes might be involved in the molecular pathogenesis of ICF syn-drome. The detection of DNA hypomethylation at BOLL, SYCP2 and NCRNA00221 may pave the way for the development of specific clinical biomarkers with the aim to facilitate the identification of ICF patients.
Introduction
The immunodeficiency, centromeric instability and facial anomalies syndrome (ICF) is a rare recessive disorder, with less than 60 cases reported worldwide. ICF syndrome is characterized by two peculiar signs: a variable immunodeficiency and a recurrent instability of pericentro-meric heterochromatin, which usually leads to chromosome breakage in mitogen-stimulated lymphocytes. The chromosomal abnormalities are found exclusively in hypomethylated peri-centromeric regions of chromosome 1, 16 and less frequently in 9. Other ICF symptoms count in facial anomalies, psychomotor and mental retardation and developmental delay [1].
The importance of ICF pathology, at the molecular level, relies on the fact that it is the only human disease showing mendelian inheritance of aberrant DNA methylation, caused by muta-tions in one of the three main DNA-methyltransferase genes, DNMT3B. Approximately 50% of the ICF cases, defined as ICF type1, present biallelic DNMT3B mutations located mainly in the catalytic domain of the protein, often leading to the impairment of its methyltransferase activity [2]. Among the rest of patients some carry nonsense mutations in zinc-finger and BTB domain-containing 24 gene (ZBTB24), designated as ICF2 patients, while a small group of them has still unknown etiology, and are designated as ICFX [2].
The biochemical defects in DNMT3B-mediated de novo DNA methylation have been recently assessed by in vitro studies of the ICF-associated DNMT3B variants [3]. These results reveal that catalysis by DNMT3B is much more complex than expected. In that context, ICF mutations cause a broad spectrum of biochemical defects in DNMT3B function, including defects in homo-oligomerization, SAM binding, SAM utilization and DNA binding [3].
Although it is well established in literature that all ICF1 patient derived cells exhibit targeted DNA hypomethylation of the pericentromeric heterochromatin at chromosomes 1, 16 and sometimes 9, the molecular defects in global DNA methylation caused by ICF-specific DNMT3B mutants remain relatively uncharacterized. Subtle differences in local DNA methyl-ation patterns have been undetected by less sensitive assays previously employed, such as two-dimensional gel electrophoresis of methylation-sensitive digested genomic DNA and COBRA analysis [4],[5]. Recently, several studies suggested that DNA hypomethylation might be more extended than previously thought [6][7]. In this sense, previous genome-wide work from our laboratory, detected DNA hypomethylation in the inactive heterochromatic regions, satellite repeats and transposons associated to two heterozygous DNMT3B mutations in one ICF1 patient [8].
Funding:The research leading to these results has received funding from the Cellex Foundation, Instituto de Sanidad Carlos III (ISCIII) and the Health and Science Departments of the Generalitat de Catalunya. ADL and ABC were supported by the “Sara Borrell”postdoctoral contract (CD12/00738) and (C09/00365) from the ISCIII at the Spanish Ministry of Economy and Competitiveness. MRM is supported by the Epigenomics Flagship Project EPIGEN, MIUR-CNR. ME is an ICREA Research Professor. JS is a“Miguel Servet”researcher and this work was supported by CP13/00055 ISCIII grant. The funders had no role in study design, data collection and analysis, decision to publish, or preparation of the manuscript.
In this study, a state-of-the-art DNA-methylation high-resolution microarray ( Human-Methylation450k BeadChip)from Illumina (San Diego, CA) that interrogates 450,000 CpGs sites in the human genome was used to find out the impact of four different ICF-specific DNMT3B mutant alleles (A603T/STP807ins and V699G/R54X) on DNA methylation at a global level. This will help us elucidate and understand the potential pivotal role of this hetero-geneous epigenetic mechanism in ICF syndrome pathogenesis. The identification of potential biomarkers for ICF patients after validation in peripheral blood samples of ICF patients might allow us to design more effective strategies to address the diagnosis or treatment of this disease.
Materials and Methods
Sample preparation
The current analysis was performed by evaluating one lymphoblastoid (LCL) cell line and untrasformed fibroblasts derived from two different ICF patients with compound and different heterozygous mutations in DNMT3B gene (PT5 and GM08747) compared to LCLs (XX and MS) and fibroblasts (3674) derived from 3 unrelated controls. PT5 sample comes from an ICF male with heterozygous DNMT3B mutations (V699G/R54X). GM08747 comes from a female diagnosed for ICF syndrome with heterozygous DNMT3B mutations (A603T/STP807ins). The healthy donors samples belonged to two females (XX, GM03674) and one male (MS). All of these cell lines were obtained from Dr. RS Hansen laboratory (University of Washington, USA) and the Coriell Cell Repository and have been used in a previous published article [9]. Additionally, DNA from mononuclear cells isolated from four cord blood donors (three males and one female) was kindly provided by Dr. D. Monk from PEBC (IDIBELL, Spain). For vali-dation steps, we extended the cohort with three lymphoblastoid cell lines: GM08714 from the ICF female patient with mutations A603T/STP807ins (see above) and its related healthy donors (GM08728 and GM08729), identified as the GM08714’s mother (GM08728) and father (GM08729) and another primary fibroblast PT3 from the ICF male with heterozygous
DNMT3B mutations (V699G/R54X). Another unrelated LCL control was used (LDA). All these cell lines were also obtained and purchased from the Coriell Cell Repository. The project has been approved by the local Ethical Committee of the IDIBELL Institution.
Genome-wide DNA methylation analysis
Genome-wide DNA methylation analysis was performed using the Infinium HumanMethyla-tion450 BeadChip from Illumina. The 450K DNA methylation array by Illumina is an estab-lished, highly reproducible method for DNA methylation detection and has been validated in two independent laboratories [10],[11].
DNA from ICF patients and healthy donors were isolated using Phenol:Chloroform:Isoa-mylalcohol (Sigma) and quantified by Quant-iT PicoGreen dsDNA Reagent (Invitrogen). The integrity was analyzed in a 1.3% agarose gel. Bisulfite conversion of 600 ng of each DNA sam-ple was performed according to the manufacturer's recommendation for Illumina Infinium Assay. Effective bisulfite conversion was checked for three controls that were converted simul-taneously with the samples. Fourμl of bisulfite converted DNA were used to hybridize on
using GenomeStudio (2011.1) Methylation module (1.9.0) software. Unsupervised (using the 5000 random CpGs) and supervised heatmaps were obtained using hierarchical clustering analysis with Manhattan metrics.
For determining differentially methylated CpGs a parametric analysis using an absolute dif-ference in beta values of 0.65 and standard deviation<0.15 in ICF1 patients compared to
con-trols were used for selecting the most relevant positions.
Bisulfite genomic DNA sequencing
The Methyl Primer Express v1.0 software (Applied Biosystems, Life technologies, Grand Island, New York) was used to identify the CpG islands in gene promoter regions and to design specific primers for the methylation analysis (S1 Table). DNA methylation status was estab-lished by bisulfite genomic sequencing. DNA was extracted from samples using the DNeasy tis-sue kit (Qiagen, Milan, Italy) and 1μg of DNA was modified with sodium bisulfite using the
EZ DNA methylation-gold kit (Zymo Research, CA USA) according to manufacturer´s instructions. Multiple clones were analyzed for each sample and the methylation frequency was calculated in each case.
Gene expression analysis
Total RNA from lymphoblastoid cell lines and untrasformed fibroblasts was extracted using TRIzol reagent (Life Technologies. Grand Island, New York) and was reverse-transcribed using iScript cDNA Synthesis kit (Bio-rad). Quantitative real-time PCR (qRT-PCR) was per-formed using iQ Supermix SYBR Green 2X (Bio-rad. San Diego, California) on the Bio-Rad iCycler according to the manufacturer’s protocols. TheΔΔCt method [12] was used to deter-mine relative quantitative levels. GAPDH gene was used to normalize the data. Primer sequences for gene expression analysis are shown in (S2 Table). Statistical analysis was per-formed using Student t test.
Results and Discussion
ICF-specific DNMT3B variants cause a global decrease in DNA
methylation profile
Seminal studies regarding DNA methylation in ICF1 patients have reported significant hypo-methylation at pericentromeric satellite DNA sequences in ICF cells of chromosomes 1, 9, 16, Alu sequences, D4Z4 and NBL2 repeats. Heterogeneous hypomethylation has been described at few single copy loci, X-linked and imprinted genes, while the genomic hypomethylation in ICF1 patients has been thought to be involved only in a rather small percentage of the 5-methylcytosine residues [4],[13–17]. Recently, a genome-wide DNA methylation analysis has been performed in our laboratory with the limitation of using a unique patient sample [8].
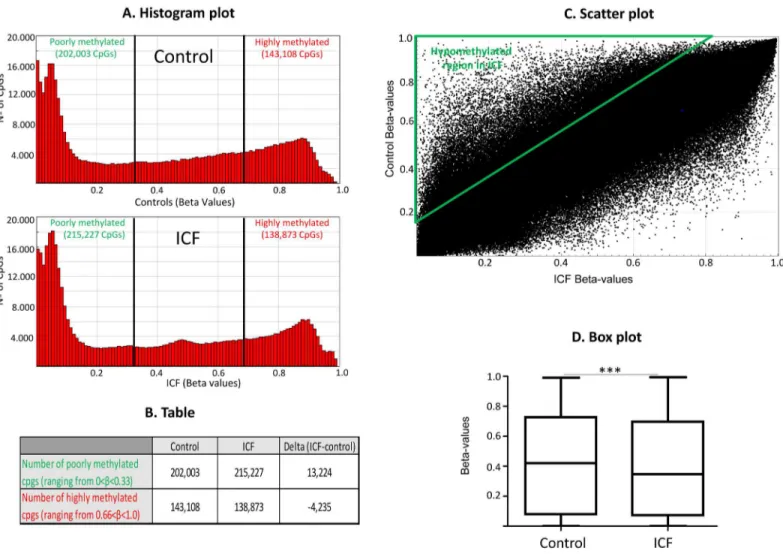
average Beta values from the two ICF patients and later the delta values (average ICF-average controls), shows that ICFs globally contain more poorly methylated (βvalue<0.33) and less
highly methylated CpGs (βvalue>0.66) compared to controls (Fig 1A). In this sense, the
accu-mulated number of poorly methylated CpGs ranging Beta values from 0 to 0.33 of ICF patients is 215,227; while for controls decrease to 202,003 (Delta ICF-Control = +13,224). However, an opposite pattern is obtained for highly methylated CpGs ranging from Beta values 0.66 to 1. In this case, control donor showed 143,108 highly methylated CpGs compared to lower number for ICF patients 138,873 CpGs (Delta ICF-Control = -4,235) (Fig 1B). A more comprehensive representation is the scatter plot of the DNA methylation levels (βvalue) of ICF patients com-pared to controls showing a higher accumulation of hypomethylated CpGs in ICFs than in controls, see triangle area inFig 1C. Confirming these results we observed, using a non-para-metic Mann-withney U test after testing normality with the Shapiro-Wilk test, a significant decrease in methylation level in ICF samples compared to controls (Fig 1D). We provide
Fig 1. Genome-wide DNA methylation profiles in ICF patients and control samples.(A) Histograms shows bimodal distribution pattern of DNA methylation profiles in ICF patients and normal donors. The frequency of CpGs according to DNA methylation levels are depicted in the graph. (B) Table showing number of average poorly methylated (methylation levels beta<0.33) and average highly methylated (methylation levels Beta>0.66). (C) Scatter plot represents comparison of DNA methylation levels of total CpG sites using the Infinium 450K DNA methylation assay. Green triangle selects hypomethylated area for ICF patients compared to controls. (D) Box plot displaying the distribution of Beta-values of total CpG sites of ICFversushealthy
control donors. Normality was tested using the Shapiro-Wilk test and significance was evaluated with the Mann-Whitney U test and is indicated by three asterisks***(p<0.001).
individual histograms, scatter and box plots for all the hybridized samples. Individual methyla-tion levels were consistent, although control 2 (XX) presented lower global levels than the other two controls (MS and GM03674) (S1 Fig). Therefore, our results are in agreement with previous studies reporting that ICF syndrome is a disease characterized by DNA hypomethyla-tion and we further demonstrate that the combinahypomethyla-tion of the specific DNMT3B variants A603T/STP807ins and V699G/R54X derives in a global loss of DNA methylation levels.
Identification of differentially DNA methylated genes in ICF
Previous studies, using candidate-gene approaches, have been searching for differentially methylated regions in ICF patients that would account for the severe clinical features that char-acterize the ICF patients. In this sense, Jinet alreported subtle but significant changes in DNA methylation levels associated with transcript level variations in a few genes involved in develop-ment, neurogenesis and immunological function of ICF patients using expression microarrays [6]. Moreover, high degree correlation between DNA methylation changes and gene expression patterns for a number of heterochromatic genes located at the pericentromeric region of chro-mosome 21 in ICF patients has been also reported [7]. Therefore, a genome-scale approach would contribute to identify new differentially methylated genes and increase the knowledge in the etiology and development of the disease.
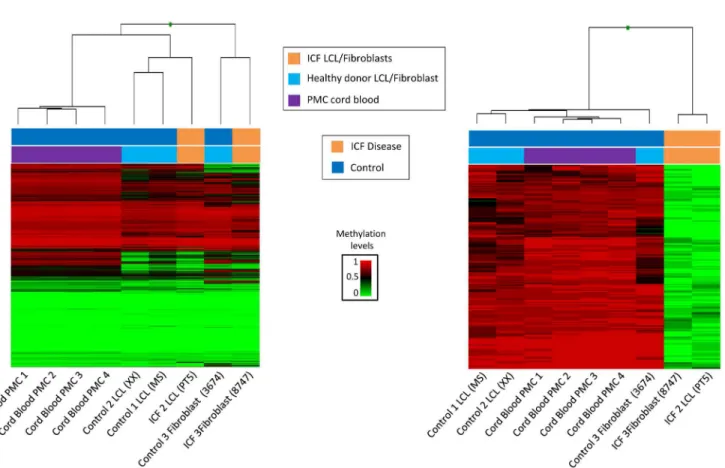
Since we observed that ICF patients with DNMT3B mutations show a global reduction of DNA methylation, we focused on studying the CpG positions with loss of methylation. To gain robustness and reliability, we added to the previous set of ICF1 samples four new controls of peripheral mononuclear cells obtained from cord blood samples (CB10, CB13, CB20 and CB76), being aware of the limitation of the cell type heterogeneity in these samples. The unsu-pervised hierarchical clustering, using 5000 random CpGs mimicking the global methylome, shows that samples are grouped based on their tissue type. The methylome of the four periph-eral mononuclear derived cells samples is homogeneous and clustered together. The immortal-ized cell lines derived from controls and ICF patients clusterimmortal-ized in the same group, but in a separate subgroup. Finally, fibroblast cells clustered in an independent group (Fig 2A). These results indicate that the distance between samples is mainly due to tissue type.
We focused on ICF-associated regions which had loss of methylation, in order to obtain reli-able and ICF-specific differentially methylated candidates. To achieve this, we used a restrictive threshold to overcome the limited number of samples and the heterogeneous effect of the mutations. Then, we performed a parametric analysis comparing average Beta values from ICF1 patients versus controls selecting those with differences in methylation levels higher than 65% (delta<-0.65) and a standard deviation value lower than 15% (Desvest<0.15). Using this
Consistently, we observed that a high number of 138 out of 181 (76.2%) of DMPs were inside a previously defined DMRs and therefore are common to both studies (S2A Fig). It is important to emphasize that although we are using different ICF1 samples from the previously published work, there is a high percentage of concordance that favors the reliability of our results.
Characterization of the genomic localization and gene features of
obtained DMPs
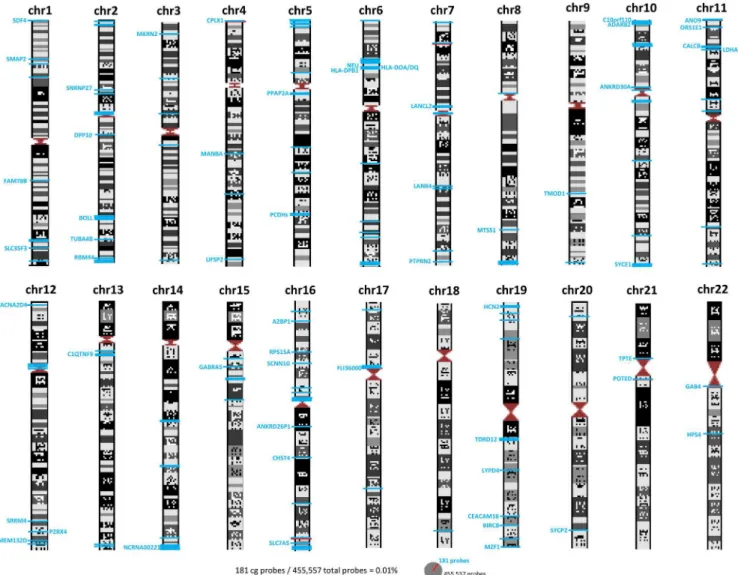
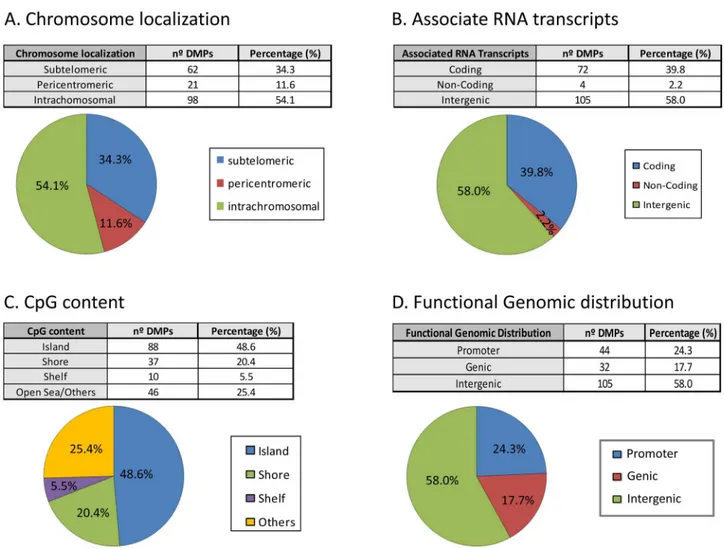
ICF-specific DNA methylation changes have been previously reported mainly in pericentro-meric regions of chromosomes 1, 9 and 16 [18]. However, when we analyzed the subchromoso-mal localization of our DMPs we observed that the majority of the DMPs are located in the intra and subtelomeric regions of the chromosomes (Figs3and4A). These results support pre-vious studies where hypomethylation of subtelomeric regions was associated in the ICF1 cells with advanced telomere replication timing and elevated levels of transcripts emanating from telomeric regions. These findings may explain the abnormal telomeric phenotype observed in ICF syndrome [19].
We further evaluated the association of the RNA transcripts with significant DMPs, finding that 39.8% and 2.2% were associated to coding and non-coding genes, respectively.
Fig 2. Identification of Differentially methylated CpGs.(A) Unsupervised hierarchical clustering and heatmap of four cord blood donors (purple), three unrelated healthy donors (blue) and two ICF patients (orange) using 5000 random selected CpGs. DNA Methylation levels scale is shown. Each column represents patients and each row represents the different CpGs. (B) Supervised cluster and heatmap representing the distinctive 181 CpGs corresponding to the comparison between ICF patients (orange) and all control samples (dark blue).
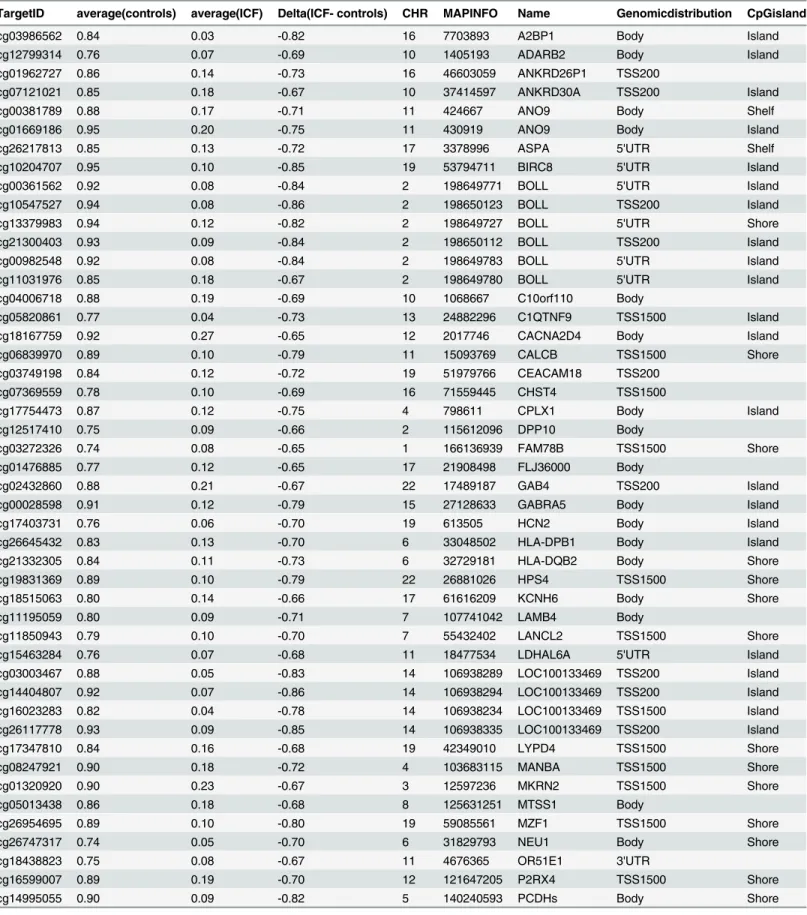
Table 1. List of Differentially Methylated CpGs comparing ICF patients and healthy controls.
TargetID average(controls) average(ICF) Delta(ICF- controls) CHR MAPINFO Name Genomicdistribution CpGisland
cg03986562 0.84 0.03 -0.82 16 7703893 A2BP1 Body Island
cg12799314 0.76 0.07 -0.69 10 1405193 ADARB2 Body Island
cg01962727 0.86 0.14 -0.73 16 46603059 ANKRD26P1 TSS200
cg07121021 0.85 0.18 -0.67 10 37414597 ANKRD30A TSS200 Island
cg00381789 0.88 0.17 -0.71 11 424667 ANO9 Body Shelf
cg01669186 0.95 0.20 -0.75 11 430919 ANO9 Body Island
cg26217813 0.85 0.13 -0.72 17 3378996 ASPA 5'UTR Shelf
cg10204707 0.95 0.10 -0.85 19 53794711 BIRC8 5'UTR Island
cg00361562 0.92 0.08 -0.84 2 198649771 BOLL 5'UTR Island
cg10547527 0.94 0.08 -0.86 2 198650123 BOLL TSS200 Island
cg13379983 0.94 0.12 -0.82 2 198649727 BOLL 5'UTR Shore
cg21300403 0.93 0.09 -0.84 2 198650112 BOLL TSS200 Island
cg00982548 0.92 0.08 -0.84 2 198649783 BOLL 5'UTR Island
cg11031976 0.85 0.18 -0.67 2 198649780 BOLL 5'UTR Island
cg04006718 0.88 0.19 -0.69 10 1068667 C10orf110 Body
cg05820861 0.77 0.04 -0.73 13 24882296 C1QTNF9 TSS1500 Island
cg18167759 0.92 0.27 -0.65 12 2017746 CACNA2D4 Body Island
cg06839970 0.89 0.10 -0.79 11 15093769 CALCB TSS1500 Shore
cg03749198 0.84 0.12 -0.72 19 51979766 CEACAM18 TSS200
cg07369559 0.78 0.10 -0.69 16 71559445 CHST4 TSS1500
cg17754473 0.87 0.12 -0.75 4 798611 CPLX1 Body Island
cg12517410 0.75 0.09 -0.66 2 115612096 DPP10 Body
cg03272326 0.74 0.08 -0.65 1 166136939 FAM78B TSS1500 Shore
cg01476885 0.77 0.12 -0.65 17 21908498 FLJ36000 Body
cg02432860 0.88 0.21 -0.67 22 17489187 GAB4 TSS200 Island
cg00028598 0.91 0.12 -0.79 15 27128633 GABRA5 Body Island
cg17403731 0.76 0.06 -0.70 19 613505 HCN2 Body Island
cg26645432 0.83 0.13 -0.70 6 33048502 HLA-DPB1 Body Island
cg21332305 0.84 0.11 -0.73 6 32729181 HLA-DQB2 Body Shore
cg19831369 0.89 0.10 -0.79 22 26881026 HPS4 TSS1500 Shore
cg18515063 0.80 0.14 -0.66 17 61616209 KCNH6 Body Shore
cg11195059 0.80 0.09 -0.71 7 107741042 LAMB4 Body
cg11850943 0.79 0.10 -0.70 7 55432402 LANCL2 TSS1500 Shore
cg15463284 0.76 0.07 -0.68 11 18477534 LDHAL6A 5'UTR Island
cg03003467 0.88 0.05 -0.83 14 106938289 LOC100133469 TSS200 Island
cg14404807 0.92 0.07 -0.86 14 106938294 LOC100133469 TSS200 Island
cg16023283 0.82 0.04 -0.78 14 106938234 LOC100133469 TSS1500 Island
cg26117778 0.93 0.09 -0.85 14 106938335 LOC100133469 TSS200 Island
cg17347810 0.84 0.16 -0.68 19 42349010 LYPD4 TSS1500 Shore
cg08247921 0.90 0.18 -0.72 4 103683115 MANBA TSS1500 Shore
cg01320920 0.90 0.23 -0.67 3 12597236 MKRN2 TSS1500 Shore
cg05013438 0.86 0.18 -0.68 8 125631251 MTSS1 Body
cg26954695 0.89 0.10 -0.80 19 59085561 MZF1 TSS1500 Shore
cg26747317 0.74 0.05 -0.70 6 31829793 NEU1 Body Shore
cg18438823 0.75 0.08 -0.67 11 4676365 OR51E1 3'UTR
cg16599007 0.89 0.19 -0.70 12 121647205 P2RX4 TSS1500 Shore
cg14995055 0.90 0.09 -0.82 5 140240593 PCDHs Body Shore
Table 1. (Continued)
TargetID average(controls) average(ICF) Delta(ICF- controls) CHR MAPINFO Name Genomicdistribution CpGisland
cg00635356 0.71 0.05 -0.66 5 140603942 PCDHB14 1stExon Shore
cg24403041 0.80 0.15 -0.66 21 14982363 POTED TSS200
cg08691323 0.84 0.04 -0.80 5 54826683 PPAP2A Body Island
cg16411279 0.94 0.02 -0.92 5 54826768 PPAP2A Body Island
cg03473125 0.96 0.25 -0.72 7 157550806 PTPRN2 Body Island
cg22386389 0.98 0.13 -0.85 2 238707268 RBM44 TSS200 Island
cg00399591 0.86 0.21 -0.65 16 18802159 RPS15A TSS1500 Shore
cg27258551 0.84 0.07 -0.77 16 23197740 SCNN1G Body Island
cg13924635 0.95 0.08 -0.87 1 1168432 SDF4 TSS1500 Island
cg21396646 0.76 0.10 -0.66 1 234039761 SLC35F3 TSS1500 Shore
cg04963199 0.81 0.11 -0.69 16 87868947 SLC7A5 Body
cg10700435 0.85 0.15 -0.71 1 40838541 SMAP2 TSS1500 Shore
cg14608581 0.75 0.02 -0.73 2 70122240 SNRNP27 Body
cg10460168 0.82 0.10 -0.72 5 112198022 SRP19 Body Shore
cg11258452 0.83 0.04 -0.79 12 119594454 SRRM4 Body Shelf
cg16266492 0.77 0.09 -0.68 10 135379461 SYCE1 5'UTR Island
cg16654419 0.90 0.09 -0.81 10 135379580 SYCE1 5'UTR Island
cg24678803 0.81 0.13 -0.68 10 135378570 SYCE1 5'UTR Shore
cg21950459 0.97 0.06 -0.91 20 58508076 SYCP2 TSS1500 Island
cg02820072 0.92 0.12 -0.79 19 33210552 TDRD12 TSS200 Island
cg18155407 0.92 0.11 -0.81 19 33210662 TDRD12 TSS200 Island
cg19712189 0.79 0.11 -0.68 19 33210851 TDRD12 5'UTR Island
cg12580503 0.89 0.18 -0.72 12 130340287 TMEM132D Body Island
cg03862437 0.87 0.11 -0.76 3 194353432 TMEM44 Body Shore
cg02203665 0.75 0.06 -0.68 9 100262506 TMOD1 TSS1500 Shore
cg25691239 0.81 0.14 -0.68 21 10991412 TPTE TSS1500 Island
cg09612946 0.84 0.16 -0.68 2 220121680 TUBA4B Body Shelf
cg02359511 0.81 0.11 -0.70 4 186346156 UFSP2 Body Shore
cg13913666 0.79 0.13 -0.66 7 1198122 ZFAND2A 5'UTR Shore
cg00469395 0.90 0.17 -0.73 16 89315104 Island
cg00654159 0.80 0.10 -0.70 16 32858241 Island
cg00813343 0.83 0.14 -0.68 7 109485219
cg00964333 0.89 0.05 -0.83 10 15038045
cg01086526 0.88 0.16 -0.72 5 3188191 Island
cg01215328 0.92 0.10 -0.82 16 34208792 Island
cg01390039 0.93 0.22 -0.71 16 89315293 Island
cg01403596 0.89 0.10 -0.79 2 92045973
cg01873249 0.88 0.23 -0.65 16 34442602 Shore
cg01893629 0.86 0.09 -0.77 12 34494825 Island
cg02052758 0.90 0.18 -0.72 7 55430948 Shelf
cg02491199 0.96 0.07 -0.90 17 21901968
cg02506248 0.83 0.10 -0.73 12 130502267
cg02587606 0.77 0.10 -0.67 10 77352231
cg02797144 0.81 0.07 -0.74 16 3245099 Shore
cg02801570 0.85 0.13 -0.72 10 15026284
cg02811702 0.87 0.08 -0.78 13 24901961 Shore
cg02985366 0.81 0.14 -0.67 16 32360428 Island
Table 1. (Continued)
TargetID average(controls) average(ICF) Delta(ICF- controls) CHR MAPINFO Name Genomicdistribution CpGisland
cg03563298 0.86 0.07 -0.79 2 242990263 Shore
cg03961510 0.87 0.07 -0.80 10 2978438
cg04523661 0.94 0.22 -0.72 19 1302808 Island
cg04696808 0.90 0.13 -0.77 16 34257170 Island
cg04815577 0.72 0.03 -0.69 5 51898 Island
cg05136737 0.81 0.12 -0.69 1 244924918
cg05507257 0.86 0.17 -0.69 10 135524081
cg05585551 0.87 0.09 -0.78 6 167314745 Island
cg06064212 0.80 0.13 -0.67 6 28455048 Shelf
cg06217323 0.72 0.04 -0.67 3 75445502 Island
cg06446408 0.83 0.12 -0.71 16 73266679
cg06766960 0.79 0.08 -0.71 11 133703094 Island
cg06953577 0.84 0.13 -0.70 11 113659952 Shore
cg07088555 0.93 0.07 -0.86 16 89315186 Island
cg08198040 0.78 0.09 -0.69 16 34429930 Shore
cg08363684 0.89 0.12 -0.77 6 761547
cg08377526 0.82 0.13 -0.70 2 92261659 Island
cg08617346 0.82 0.13 -0.69 20 1716331 Island
cg08761055 0.93 0.08 -0.85 2 5846917 Island
cg08767686 0.77 0.01 -0.76 5 51426 Island
cg08860346 0.82 0.09 -0.73 2 75504008
cg09415274 0.86 0.17 -0.69 15 40422219
cg09605095 0.79 0.04 -0.76 2 5847414 Island
cg09785512 0.78 0.09 -0.69 17 21934840 Island
cg09817162 0.75 0.03 -0.72 6 27185676
cg09871679 0.87 0.08 -0.79 7 61821180 Island
cg10399005 0.78 0.07 -0.71 14 70316898 Island
cg10606029 0.86 0.20 -0.65 5 37952598
cg10854819 0.75 0.02 -0.72 15 31515852
cg11115267 0.84 0.15 -0.68 10 38908948
cg11350504 0.77 0.09 -0.68 13 113121280 Shore
cg11476737 0.84 0.07 -0.76 10 2815189 Island
cg11837817 0.90 0.09 -0.81 6 167314233 Island
cg11860886 0.93 0.07 -0.85 14 106857312 Island
cg12109260 0.83 0.06 -0.77 8 144850435 Shelf
cg12161959 0.84 0.19 -0.65 2 240868337 Island
cg12492942 0.89 0.18 -0.71 6 27510966
cg12647837 0.91 0.16 -0.75 7 61820842 Island
cg13396152 0.87 0.19 -0.67 1 62005072
cg14026325 0.93 0.02 -0.90 8 144787867 Island
cg14218861 0.77 0.08 -0.70 10 119443973
cg14303972 0.84 0.05 -0.79 12 34752640
cg14341968 0.85 0.19 -0.66 9 136075868 Shore
cg14493094 0.79 0.10 -0.68 4 132896579 Island
cg15335669 0.77 0.05 -0.72 15 22546908 Island
cg15646803 0.77 0.12 -0.65 2 92261070 Island
cg16530595 0.81 0.07 -0.74 8 144788492 Island
Interestingly, there were 4 DMPs associated to a long non-coding RNA (Fig 4B). These results indicate that specific non coding RNAs are target of DNMT3B and possibly regulated by DNA methylation. From the CpG content and neighborhood context standpoint (Fig 4C), the CpG island, which are regions with high dense number of CpGs, are the most extensively screened regions (48.6%) and are over-represented according to the design of the 450K Infinium array
Table 1. (Continued)
TargetID average(controls) average(ICF) Delta(ICF- controls) CHR MAPINFO Name Genomicdistribution CpGisland
cg17024593 0.75 0.06 -0.68 12 34490115 Island
cg18304339 0.83 0.16 -0.67 14 52213734
cg18315943 0.79 0.12 -0.67 5 3188374 Island
cg18480548 0.87 0.09 -0.78 19 523642 Island
cg18686665 0.87 0.06 -0.81 2 629121 Island
cg18709881 0.75 0.07 -0.69 18 72837627 Island
cg18710908 0.83 0.18 -0.65 8 144787999 Island
cg18898632 0.80 0.14 -0.66 2 242989856 Island
cg18963811 0.81 0.14 -0.66 14 52210597
cg18969117 0.95 0.13 -0.81 1 226269917 Shore
cg19035254 0.87 0.17 -0.70 8 43131260 Island
cg19443750 0.73 0.08 -0.65 13 112996588 Shore
cg19766591 0.81 0.12 -0.69 10 2978190
cg20301678 0.90 0.14 -0.76 6 167313267 Island
cg20447730 0.84 0.06 -0.79 10 45719880 Island
cg21053539 0.89 0.20 -0.69 6 28829503 Shelf
cg21451653 0.76 0.07 -0.68 12 34551994
cg21561672 0.89 0.19 -0.70 14 102101551 Island
cg21918786 0.90 0.10 -0.80 6 109611834 Island
cg21941223 0.95 0.14 -0.81 19 2926894 Island
cg21973687 0.82 0.12 -0.70 6 148142629
cg22243348 0.84 0.13 -0.71 19 11874227 Shelf
cg22778503 0.90 0.09 -0.82 14 106857188 Island
cg22834924 0.83 0.09 -0.74 6 140392531
cg22973226 0.90 0.21 -0.69 1 46705909 Island
cg23193831 0.83 0.11 -0.72 11 43177729
cg23207305 0.83 0.12 -0.71 11 15012901
cg23771956 0.73 0.03 -0.70 10 45720040 Island
cg23972271 0.87 0.21 -0.66 5 98541824
cg23997132 0.86 0.02 -0.84 10 15038349
cg24854181 0.80 0.02 -0.78 5 6823241 Island
cg25606780 0.87 0.20 -0.68 3 47397852 Island
cg25854527 0.77 0.08 -0.69 3 102333494
cg26427818 0.96 0.12 -0.84 11 15093613 Shore
cg26931296 0.86 0.17 -0.69 7 150870852 Island
cg27399125 0.78 0.05 -0.72 6 150378738 Shore
cg27427743 0.78 0.13 -0.65 13 23270850 Island
cg27438152 0.80 0.08 -0.72 15 31515761
cg27629454 0.80 0.14 -0.66 1 228742687 Shore
cg27660756 0.82 0.08 -0.74 19 57103802 Shelf
where CGs in islands represent only a 31% [10]. It is shown the classification according to functional genome distribution, indicating that the majority of the DMPs are located in inter-genic regions (58%) leading to an over-representation of these regions regarding the design of the 450K infinium array where the percentage of probes in intergenic region is 24.6% (Fig 4D). Meanwhile, 24.3% of the DMPs correspond to promoter regions, defined as CpGs located at TSS1500, TSS200 and UTR regions. Interestingly this promoter group is under-represented based on the expected 38.9% from the 450K array [20]. Moreover, we took advantage of results published in [8] and compared the functional genomic distribution between our 181 DMPs and the 296,964 DMRs previously reported. We observed overall a discrepancy in promoter region (24.3% vs 4.5% in our study and Heyn et al, respectively) (S2B Fig, left panel). However, this striking result may be explained by the distribution of the CpGs in the array and in the whole genome that mimics our obtained pattern (S2B Fig, right panel). Finally, analyzing a subset of DMPs located in promoter regions only, we observed that 13 (87%) are associated with CpG islands or shores. Interestingly, these regions have been reported for being important
Fig 3. Schematic representation of chromosomes and CpG localization.Gene names and intergenic CpGs are represented and localized by blue lines.
regulatory regions for disease [21],[22]. As a global conclusion, the majority of the hypomethy-lated DMPs in ICF patients are located at intergenic and CpG islands regions.
DNA hypomethylated candidate validation
To confirm the methylation results obtained by genome-scale techniques, we used a small scale, site-specific technique as targeted bisulfite sequencing. This technique takes advantage of the activity of sodium bisulfite that converts non-methylated cytosines into uraciles by deami-nation, while methyl-cytosines remain unaltered. We performed a technical validation using the same samples that were hybridized; the ICF fibroblasts and LCL (GM08747 and PT5) and 3 unrelated controls (XX, MS and 3674). Moreover, to gain robustness we also performed a biological validation using non-hybridized LCLs from the same ICF patient (GM08714) and ICF fibroblast compared with related controls (GM08728, GM08729 respectively mother and father of GM08714/GM08747) and the unrelated control (LDA). GM8714 was the ICF patient sample used in our previously paper [8].
Fig 4. Genomic distribution and gene features of the 53 differentially methylated CpGs.(A) Chromosomal sub-localization classified in different groups: subtelomeric, pericentromeric and intrachromosomal. (B) Associated RNA transcription classified in: coding, non-coding and intergenic. (C) CpG context and neighborhood classified in: island, shore, shelf and open sea/others. (D) Functional genomic distribution classified in: promoter (TSS1500, TSS200, 5´UTR), genic (1stexon, body and 3´UTR) and intergenic.
Based on previous knowledge that epigenetic disruption of germ line function in somatic tissues has been associated with ICF [23][24], we selected four representative genes related to germ line specific pathways and/or are expressed exclusively in germ cells [25–27]. These four genes (BOLL, SYCP2, LDHAL6A and NCRNA00221) presented DNA methylation differences at crucial regulatory elements such as promoter with CpG islands. It is worth to mention that more than one DMCpGs in those important regulatory regions were identified in our analysis for BOLL and NCRNA00221, 6 and 4 respectively. Thus, coding genes such as, BOLL, SYCP2 and LDHAL6A, might be additional examples of DNMT3b target genes functionally regulated by DNA methylation in somatic tissues. Moreover, NCRNA00221 (Linc00221) is a long inter-genic non-coding RNA (lincRNA). These non-coding genes are important regulators of gene expression that have been described in several diseases [28].
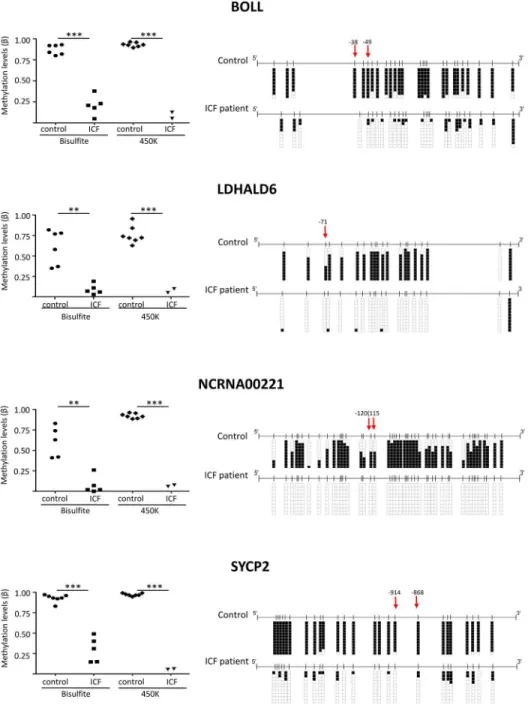
The pyrosequencing analysis confirmed, by comparing ICFs patients with controls, the dif-ferent methylation levels in the targeted promoter CpGs of the four genes (BOLL, SYCP2, LDHAL6A and NCRNA00221) (Fig 5, left panel). Both DNA methylation assays, bisulfite genomic sequencing and 450K infinium array, showed similar levels of methylation. Right panel ofFig 5depicts CpGs DNA methylation values (including the CpGs obtained by 450K array analysis marked with a red arrow) located in the regions analyzed for the four genes in two representative samples: an ICF patient and a healthy control. DNA methylation values for all samples (ICF patients and control donors) and a schematic representation of the four selected gene regions are shown in (S3,S4,S5andS6Figs). Globally, we can conclude that not only the infinium-targeted CpGs are unmethylated in ICF patients (red arrow), but the sur-rounding CpGs also show the same pattern favoring the idea that global DNA demethylation landscape is maintained. This effect could indicate that the entire CpG island, and not only a single base demethylation, is altered as consequence of the DNMT3B deficiency in the ICF dis-ease and might cause gene expression deregulation.
Association of gene expression and DNA methylation changes
The existence of aberrations in the DNA methylation patterns of ICF cells, particularly the hypermethylation of the CpG island sequences located in the promoter regions of key regula-tory genes, that lead to gene silencing, have been extensively described in literature [29]. Con-versely, DNA hypomethylation has been associated mainly with DNA methylation loss at genome-wide level, although it also occurs locally. In this light, the effect of DNA demethyla-tion makes accessible the transcripdemethyla-tion machinery and hence facilitating gene activademethyla-tion, which have been mainly described in cancer, involving the role of oncogenes [22]. Although some hypomethylated genes have been found associated to ICF1 [23], the number of disrupted epi-genetic genes identified is very limited and little is known about their association with the etiol-ogy of this disease. In line with this finding, we aimed to evaluate the impact of DNA
methylation changes on the transcriptional activity and detect gene promoters that are highly methylated in healthy controls a suffer de novo established loss-of-methylation in ICF patients concordant with gene up-regulation.
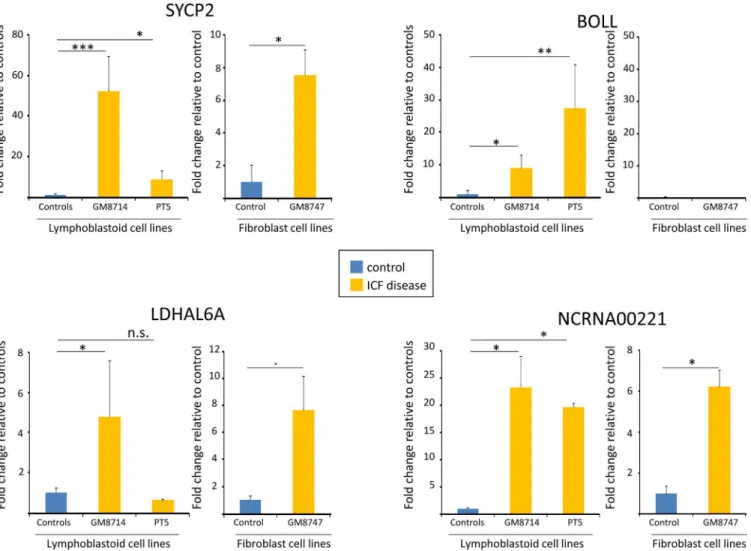
(GM03674). The results clearly showed a significant up-regulation, using the unpaired Student t test, for three of four genes in ICF cells (except LDHAL6A that only show significance in GM08714, but not in PT5) compared to controls, indicating that the impaired DNA methyla-tion at the identified DMPs is critical for controlling their gene activity (Fig 6). Differences in
Fig 5. Validation of DNA methylation of four representative genes (BOLL, SYCP2, LDHALD6 and NCRNA00221) levels by bisulfite genomic sequencing analysis.Left panel depicts DNA methylation values (Beta) from ICF and healthy donors using both methodologies bisulfite genomic sequencing (BSG) and 450K array. Right panel shows bisulfite genomic sequencing analysis of genes in one representative control and ICF patient. CpG dinucleotides are shown in vertical lines. Multiple single clones are represented for each sample. Presence of unmethylated or methylated CpGs is indicated by white or black squares, respectively. Red arrows mark the localization of the differentially methylated CpGs by 450K array. The distance to transcription start site (bp) is also indicated.
expression levels between both ICF samples in SYCP2 and BOLL could be due to DNMT3 type of mutation and the idea that, the other factors together with DNA methylation changes may be involved in the complex regulation of gene expression. In line, consistent results were obtained in fibroblasts expression analysis, except for BOLL that we were not able to detect expression in any fibroblast. This could be explained due to a tissue-specific regulation beyond DNA methylation. Interestingly, even if at different extents overall comparing levels in LCLs with untransformed fibroblasts, three genes were epigenetically regulated in ICF patients with four different DNMT3B mutations (GM8714, PT5). This suggests an important role in the DNMT3B-mediated regulatory pathway that could contribute to explain some aspects of the characteristic phenotype of these ICF patients. These results suggest a potential interaction between the DNMT3B type of mutation and the epigenetic regulation and intensity of gene activation of the studied genes.
The role of DNMT3b in protecting somatic cells against the aberrant expression of the germ line program has recently been suggested [23]. Moreover, the DNMT3b-mediated silencing of a subset of germ line genes in somatic cells occurs through the recruitment of the E2F6
Fig 6. Gene expression analysis for the selected 4 CpG island-promoter associated genes BOLL, SYCP2, LDHALD6 and NCRNA00221.Fold change values of the differentially DNA methylated genes in lymphoblastoid ICF patients and healthy donors were evaluated by qRT-PCR. In parallel, Fold change values were also tested in untransformed fibroblast form an ICF patient and a healthy donor. Values were determined at least in triplicate. Statistic analysis was evaluated using student t test and significance symbols correspond to (*p<0.05;**p<0.01 and***p<0.001).
transcriptional repressor at their promoter region [32]. In this light, by identifying novel germ line genes, which are hypomethylated and inappropriately expressed, our results suggest that this phenomenon in the context of DNMT3B deficiency might be rather widespread. How this specific deregulation may contribute to ICF molecular pathogenesis remains to be established. Notably, the ectopic expression of meiotic genes in cancer cells has been functionally related to abnormal chromosome segregation and aneuploidy [33]. Because chromosomal instability is a hallmark of ICF syndrome, this raises the possibility that loss of silencing at particular germ line genes drives the typical cytological abnormalities seen in ICF patient lymphocytes.
It is known that early diagnosis of ICF syndrome is crucial since early treatment can improve the course of disease. However, ICF is probably underdiagnosed, especially in patients that present incomplete phenotype or born to families with no affected relatives [23]. There-fore, the DNA hypomethylation profile of NCRNA00221 especially, and in a minor extent SYCP2 and BOLL, could be further investigated and validated in peripheral blood in order to develop specific clinical biomarkers to facilitate the identification of ICF patients.
Conclusion
Our results contribute to elucidate how different mutations in DNMT3b result in deficiency of DNA methyltransferase activity, eventually causing ICF1 syndrome. It seems accepted that is the DNA methylation deficiency, and not other aspects of impaired DNMT3b activity, respon-sible for the ICF syndrome.
The regions with aberrant methylation in ICF patients were almost exclusive of pericentro-meric regions of chromosome 1, 16, sometimes 9 and associated to repeated DNA sequences or heterochromatic genes. Although in vitro studies identified a spectrum of biochemical defects in the catalytic function associated to ICF-specific DNMT3B mutations, their impact on the genome-wide DNA methylation level in patient-derived cells is unsolved. Our results contributed to characterize the global defects of DNA methylation pattern in two heterozygous DNMT3B-mutant backgrounds, uncovering novel ICF-specific hypomethylated sites, outside the pericentromeric regions and in other chromosomes compared to those previously men-tioned. Interestingly, we identified additional DNMT3B target loci whose expression must be restricted to germ cells. Establishment and maintenance of promoter DNA methylation in somatic tissues by DNMT3B is critical for their transcriptional repression. In addition, to pro-vide further epro-vidence on DNMT3B role in silencing germ line genes, these findings are of par-ticular interest in the context of other human disease, like cancer. It is remarkable that the expression of catalytically inactive DNMT3b splice variants, the aberrant transcription of germ line genes and chromosomal instability are shared features. We thus believe that these
genome-wide studies will help to elucidate the relationship between DNA hypomethylation and pathological phenotypes.
Finally, from the ICF syndrome point of view, our results contribute to further evaluate the utility of these potential biomarkers as diagnostic markers.
Supporting Information
by three asterisks(p<0.001).
(TIF)
S2 Fig. Comparison of Hypomethylated regions reported by Heyn et al. and current differ-entially methylated positions.(A) Venn diagram illustrating the number of hypomethylated features. The intersecting region represents those CpGs that are common to both analyses. (B) Left panel: graph depicting percentages of differentially methylated features based on func-tional genomic distribution comparing both analyses (dark blue for our analysis and dark red for Heyn et al.). Right panel: graph showing percentages based on the 450K array design and the whole genome (light blue for 450K array and red for whole genome). Data obtained from [20].
(TIF)
S3 Fig. Bisulfite genomic sequencing for technical and biological validation of differentially DNA methylated gene BOLL.For technical validation two ICF (PT5 and GM08747) and two unrelated controls (XX, MS and GM03674) were used. For biological validation two ICF patient samples (GM8714 and PT3) and three controls (two related controls GM8728, GM8729 and one unrelated control LDA) were analyzed. CpG dinucleotides is shown in verti-cal lines. Multiple single clones are represented for each sample. Presence of unmethylated or methylated CpGs is indicated by white or black squares, respectively. Red arrows mark the localization of the differentially methylated CpGs by 450K array. The distance to Trasncription Start Site (bp) is also indicated.
(TIF)
S4 Fig. Bisulfite genomic sequencing for technical and biological validation of differentially DNA methylated gene SYCP2.The design is similar toS3 Fig.
(TIF)
S5 Fig. Bisulfite genomic sequencing for technical and biological validation of differentially DNA methylated gene LDHAL6A.The design is similar toS3 Fig.
(TIF)
S6 Fig. Bisulfite genomic sequencing for technical and biological validation of differentially DNA methylated gene NCRNA00221.The design is similar toS3 Fig.
(TIF)
S1 Table. Primers for bisulfite genomic sequencing.
(DOCX)
S2 Table. Primers for quantitative RT-PCR.
(DOCX)
Acknowledgments
We thank Diana Garcia, Carles Arribas and Sebastian Moran for their technical support and Dr. Sylwia Leppert for her help during the early phase of the work.
Author Contributions
References
1. Ehrlich M, Jackson K, Weemaes C. (2006) Immunodeficiency, centromeric region instability, facial anomalies syndrome (ICF). Orphanet J Rare Dis 1: 2. PMID:16722602
2. Weemaes CM, van Tol MJ, Wang J, van Ostaijen-ten Dam MM, van Eggermond MC, Thijssen PE et al. (2013) Heterogeneous clinical presentation in ICF syndrome: correlation with underlying gene defects. Eur J Hum Genet. 21(11):1219–25. doi:10.1038/ejhg.2013.40PMID:23486536
3. Moarefi AH1, Chédin F. (2011) ICF syndrome mutations cause a broad spectrum of biochemical defects in DNMT3B-mediated de novo DNA methylation. J Mol Biol. Jun 24; 409(5):758–72. doi:10. 1016/j.jmb.2011.04.050PMID:21549127
4. Kondo T, Bobek MP, Kuick R, Lamb B, Zhu X, Narayan A et al. (2000) Whole-genome methylation scan in ICF syndrome: hypomethylation of non-satellite DNA repeats D4Z4 and NBL2. Hum Mol Genet. 9(4):597–604. PMID:10699183
5. Ehrlich M, Buchanan KL, Tsien F, Jiang G, Sun B, Uicker W et al. (2001) DNA methyltransferase 3B mutations linked to the ICF syndrome cause dysregulation of lymphogenesis genes. Hum Mol Genet 10(25):2917–31. PMID:11741835
6. Jin B, Tao Q, Peng J, Soo HM, Wu W, Ying J et al. (2008) DNA methyltransferase 3B (DNMT3B) muta-tions in ICF syndrome lead to altered epigenetic modificamuta-tions and aberrant expression of genes regu-lating development, neurogenesis and immune function. Hum Mol Genet 17(5):690–709. PMID: 18029387
7. Brun ME, Lana E, Rivals I, Lefranc G, Sarda P, Claustres M et al. (2011). Heterochromatic genes undergo epigenetic changes and escape silencing in immunodeficiency, centromeric instability, facial anomalies (ICF) syndrome. PLoS One 6(4):e19464. doi:10.1371/journal.pone.0019464PMID:
21559330
8. Heyn H, Vidal E, Sayols S, Sanchez-Mut JV, Moran S, Medina I et al. (2012) Whole-genome bisulfite DNA sequencing of a DNMT3B mutant patient. Epigenetics 7(6):542–50. doi:10.4161/epi.20523
PMID:22595875
9. Gatto S, Della Ragione F, Cimmino A, Strazzullo M, Fabbri M, Mutarelli M et al. (2010) Epigenetic alter-ation of microRNAs in DNMT3B-mutated patients of ICF syndrome. Epigenetics 5(5):427–43. PMID: 20448464
10. Sandoval J, Heyn HA, Moran S, Serra-Musach J, Pujana MA, Bibikova M et al. (2011) Validation of a DNA methylation microarray for 450,000 CpG sites in the human genome. Epigenetics 6(6):692–702.
PMID:21593595
11. Bibikova M, Barnes B, Tsan C, Ho V, Klotzle B, Le JM et al. (2011) High density DNA methylation array with single CpG site resolution. Genomics 98(4):288–95. doi:10.1016/j.ygeno.2011.07.007PMID: 21839163
12. Livak KJ and Schmittgen TD. (2001) Analysis of relative gene expression data using real-time quantita-tive PCR and the 2(-Delta Delta C(T)) Method. Methods 25(4):402–8. PMID:11846609
13. Miniou P, Jeanpierre M, Blanquet V, Sibella V, Bonneau D, Herbelin C et al. (1994) Abnormal methyla-tion pattern in constitutive and facultative (X inactive chromosome) heterochromatin of ICF patients. Hum Mol Genet 3(12):2093–102. PMID:7881405
14. Miniou P, Jeanpierre M, Bourc'his D, Coutinho Barbosa AC, Blanquet V and Viegas-Péquignot E. (1997) Alpha-satellite DNA methylation in normal individuals and in ICF patients: heterogeneous meth-ylation of constitutive heterochromatin in adult and fetal tissues. Hum Genet 99(6):738–45. PMID: 9187666
15. Hansen RS, Stöger R, Wijmenga C, Stanek AM, Canfield TK, Luo P et al. (2000) Escape from gene silencing in ICF syndrome: evidence for advanced replication time as a major determinant. Hum Mol Genet. 9(18):2575–87. PMID:11063717
16. Matarazzo MR, De Bonis ML, Gregory RI, Vacca M, Hansen RS, Mercadante G et al. (2002) Allelic inactivation of the pseudoautosomal gene SYBL1 is controlled by epigenetic mechanisms common to the X and Y chromosomes. Hum Mol Genet. 11(25):3191–8. PMID:12444103
17. Matarazzo MR, De Bonis ML, Strazzullo M, Cerase A, Ferraro M, Vastarelli P et al. (2007). Multiple binding of methyl-CpG and polycomb proteins in long-term gene silencing events. J Cell Physiol. 210 (3):711–9. PMID:17133344
18. Jeanpierre M, Turleau C, Aurias A, Prieur M, Ledeist F, Fischer A et al. (1993) An embryonic-like meth-ylation pattern of classical satellite DNA is observed in ICF syndrome. Hum Mol Genet. 2(6):731–5.
PMID:8102570
transcription from telomeric regions. Hum Mol Genet. 17(18):2776–89. doi:10.1093/hmg/ddn177
PMID:18558631
20. Stirzaker C, Taberlay PC, Statham AL, Clark SJ. (2014) Mining cancer methylomes: prospects and challenges. Trends Genet. 30(2):75–84. doi:10.1016/j.tig.2013.11.004PMID:24368016
21. Irizarry RA, Ladd-Acosta C, Wen B, Wu Z, Montano C, Onyango P et al. (2009) The human colon can-cer methylome shows similar hypo- and hypermethylation at conserved tissue-specific CpG island shores. Nat Genet 41(2):178–86. doi:10.1038/ng.298PMID:19151715
22. Sandoval J and Esteller M. (2012) Cancer epigenomics: beyond genomics. Curr Opin Genet Dev. 22 (1):50–5. doi:10.1016/j.gde.2012.02.008PMID:22402447
23. Velasco G, Walton EL, Sterlin D, Hédouin S, Nitta H, Ito Y et al. (2014) Germline genes hypomethyla-tion and expression define a molecular signature in peripheral blood of ICF patients: implicahypomethyla-tions for diagnosis and etiology. Orphanet J Rare Dis. 9:56. doi:10.1186/1750-1172-9-56PMID:24742017
24. Walton EL, Francastel C and Velasco G. (2014) Dnmt3b Prefers Germ Line Genes and Centromeric Regions: Lessons from the ICF Syndrome and Cancer and Implications for Diseases. Biology (Basel) 3(3): 578–605.
25. Li M, Liu C, Zhu H, Sun J, Yu M, Song W et al. (2013) Expression pattern of Boule in dairy goat testis and its function in promoting the meiosis in male germline stem cells (mGSCs). J Cell Biochem. 114 (2):294–302. doi:10.1002/jcb.24368PMID:22930651
26. Zheng YH, Rengaraj D, Choi JW, Park KJ, Lee SI and Han JY. (2009) Expression pattern of meiosis associated SYCP family members during germline development in chickens. Reproduction 138 (3):483–92. doi:10.1530/REP-09-0163PMID:19525366
27. Wang H, Zhou Z, Lu L, Xu Z and Sha J. (2005) Cloning and characterization of a novel intronless lactate dehydrogenase gene in human testis. Int J Mol Med 15(6):949–53. PMID:15870898
28. Della Ragione F, Gagliardi M, D'Esposito M and Matarazzo MR. (2014) Non-coding RNAs in chromatin disease involving neurological defects Front Cell Neurosci. 8:54. doi:10.3389/fncel.2014.00054PMID:
24616662
29. Esteller M. (2008) Epigenetics in cancer. N Engl J Med 358(11):1148–59. doi:10.1056/ NEJMra072067PMID:18337604
30. Lopez-Serra P, Marcilla M, Villanueva A, Ramos-Fernandez A, Palau A, leal L et al. (2014) DERL3-associated defect in the degradation of SLC2A1 mediates the Warburg effect. Nat Commun. 5:3608. doi:10.1038/ncomms4608PMID:24699711
31. Quintavalle C, Mangani D, Roscigno G, Romano G, Diaz-Lagares A, Iaboni M et al. (2013) MiR-221/ 222 target the DNA methyltransferase MGMT in glioma cells. Plos One 8(9):e74466. doi:10.1371/ journal.pone.0074466PMID:24147153
32. Velasco G, Hube F, Rollin J, Neuillet D, Philippe C, Bouzinba-Segard H et al. (2010). Dnmt3b recruit-ment through E2F6 transcriptional repressor mediates germ-line gene silencing in murine somatic tis-sues. Proc Natl Acad Sci U S A 107:9281–9286. doi:10.1073/pnas.1000473107PMID:20439742