Hallucinations in Schizophrenia
Remko van Lutterveld1*, Arjan Hillebrand2, Kelly M. J. Diederen1, Kirstin Daalman1, Rene´ S. Kahn1, Cornelis J. Stam2, Iris E. C. Sommer1
1Department of Psychiatry, University Medical Center, Utrecht, the Netherlands and Rudolf Magnus Institute of Neuroscience, Utrecht, the Netherlands,2Department of
Clinical Neurophysiology, VU University Medical Center, Amsterdam, the Netherlands
Abstract
Background:Auditory verbal hallucinations (AVH), a prominent symptom of schizophrenia, are often highly distressing for patients. Better understanding of the pathogenesis of hallucinations could increase therapeutic options. Magnetoence-phalography (MEG) provides direct measures of neuronal activity and has an excellent temporal resolution, offering a unique opportunity to study AVH pathophysiology.
Methods:Twelve patients (10 paranoid schizophrenia, 2 psychosis not otherwise specified) indicated the presence of AVH by button-press while lying in a MEG scanner. As a control condition, patients performed a self-paced button-press task. AVH-state and non-AVH state were contrasted in a region-of-interest (ROI) approach. In addition, the two seconds before AVH onset were contrasted with the two seconds after AVH onset to elucidate a possible triggering mechanism.
Results:AVH correlated with a decrease in beta-band power in the left temporal cortex. A decrease in alpha-band power was observed in the right inferior frontal gyrus. AVH onset was related to a decrease in theta-band power in the right hippocampus.
Conclusions:These results suggest that AVH are triggered by a short aberration in the theta band in a memory-related structure, followed by activity in language areas accompanying the experience of AVH itself.
Citation:van Lutterveld R, Hillebrand A, Diederen KMJ, Daalman K, Kahn RS, et al. (2012) Oscillatory Cortical Network Involved in Auditory Verbal Hallucinations in Schizophrenia. PLoS ONE 7(7): e41149. doi:10.1371/journal.pone.0041149
Editor:Ryota Hashimoto, United Graduate School of Child Development, Osaka University, Japan
ReceivedJanuary 25, 2012;AcceptedJune 18, 2012;PublishedJuly 23, 2012
Copyright:ß2012 van Lutterveld et al. This is an open-access article distributed under the terms of the Creative Commons Attribution License, which permits unrestricted use, distribution, and reproduction in any medium, provided the original author and source are credited.
Funding:This work was supported by the Dutch Science Organization (Nederlandse Wetenschappelijke Organisatie NWO), Operating Grant: 916.56.172. The funders had no role in study design, data collection and analysis, decision to publish, or preparation of the manuscript.
Competing Interests:The authors have declared that no competing interests exist.
* E-mail: [email protected]
Introduction
Auditory verbal hallucinations (AVH) are one of the core symptoms of schizophrenia with approximately 70% of all schizophrenia patients presenting with these symptoms [1,2]. AVH can be highly distressing and often lead to a disrupted social life [3]. Treatment for AVH would benefit from a detailed understanding of the pathophysiology of AVH. This, however, remains elusive.
An intuitive way to investigate AVH-related brain activity is to contrast the AVH state with the non-AVH state. Several studies have used this approach [4–14]. A recent meta-analysis implicated the bilateral insula, left middle and superior temporal gyrus, left hippocampus, left parahippocampal gyrus, left supramarginal gyrus, bilateral inferior frontal gyrus, and right internal globus pallidus in the experience of AVH [15].
Another strategy to study AVH is to identify brain regions that show changes in activity surrounding the start of hallucinations, as this may shed light on its triggering mechanism. Five functional magnetic resonance (fMRI) studies examined this topic [5,16–19]. The three largest studies reported a decrease in activity in the parahippocampal gyrus preceding the experience of AVH,
suggesting the involvement of memory processes in the genesis of AVH [5,16,17].
The vast majority of neuroimaging studies investigating AVH used fMRI. However, MRI scanner noise may interact with hallucination-related brain activity, and blood oxygen level-dependent (BOLD) activity is an indirect measure of neuronal activity. More importantly, the temporal resolution of fMRI is poor, confounding precise analysis of brain activity surrounding AVH onset. In contrast, magnetoencephalography (MEG) is a silent technique and directly measures postsynaptic neuronal activity. Moreover, it has a high temporal resolution, which makes it especially suitable to study short time-windows surrounding AVH onset. Thus far, MEG studies investigated AVH in one or a few (maximal 3) patients, reporting increases in power in the left superior temporal gyrus and left dorsolateral prefrontal gyrus (DLPFC) during AVH [7,9,10].
Methods
Ethics statement
All patients gave their written informed consent and the study was approved by the ethics committees of the University Medical Center in Utrecht and the VU University Medical Center in Amsterdam.
Subjects
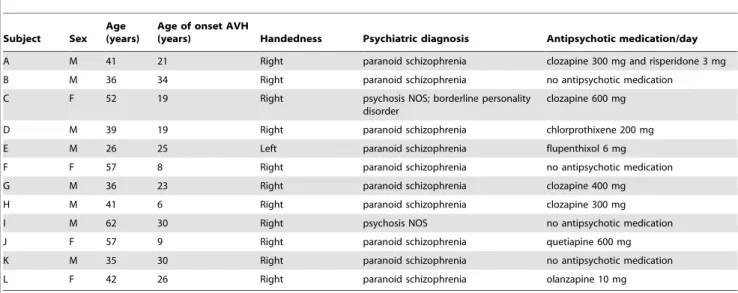
Twenty schizophrenia-spectrum patients experiencing frequent auditory verbal hallucinations (AVH) were recruited at the University Medical Center in Utrecht, the Netherlands. Patients were diagnosed using the Comprehensive Assessment of Symp-toms and History (CASH) interview [20] according to DSM-IV criteria by an independent psychiatrist. Eight out of twenty patients were excluded from analysis (3 patients experienced continuous AVH during recording, 3 patients did not experience AVH during recording, 1 experimental session was aborted because of anxiety of the patient, and we encountered technical difficulties during data-acquisition with 1 patient). Age and clinical characteristics for the 12 included patients (8 male, 4 female) are presented in table 1.
Data acquisition
Brain activity was recorded at the VU University Medical Center using a 151-channel whole-head neuromagnetometer (CTF Systems Inc., Port Coquitlam, BC, Canada) in a magneti-cally shielded room (Vacuumschmelze GmbH, Hanau, Germany). Sampling rate was 625 Hz and the recording bandpass was 0 to 200 Hz. A third-order software gradient was applied for online noise cancellation [21]. At the beginning and end of each recording, the head position relative to the coordinate system of the helmet was recorded by leading small alternating currents through three head position coils attached to the subject’s nasion and left and right pre-auricular points. Head position changes during the recording up to 1.0 cm were accepted. The three fiducial points were photographed for each participant for the purpose of co-registration of the MEG data to structural MRI scans.
During the MEG recording, patients lay in supine position and were instructed to close their eyes and move as little as possible. Subjects indicated the onset and offset of AVH by button-press. That is, subjects briefly pressed a button in the left hand at the start of AVH and briefly pressed a button in the right hand at the end of AVH. Neuromagnetic brain activity was recorded as continuous datasets of 1800 s duration. Due to practical con-siderations, the experiment was stopped early for 5 patients, resulting in datasets of 600, 1040, 1260, 1270 and 1770 seconds. To infer brain activation related to the button-presses, patients also performed a self-paced button-press task for 10 minutes, in which subjects alternatingly pressed the left and right buttons approximately every 10 seconds. Patients were specifically in-structed not to relate the button-presses to the presence of AVH. Proper execution of this instruction was verbally verified after the experiment. Arousal levels were monitored online and subjects were prompted when arousal levels dropped; these data segments were excluded from the analysis.
To facilitate source localization of the MEG data, high-resolution magnetic resonance imaging (MRI) scans were obtained with a 3 Tesla MRI scanner (Philips Medical Systems, Best, the Netherlands) (TR/TE: 9.86/4.6 ms, 1 mm3voxels, flip angle 8u). Co-registration of the MEG and MRI data was achieved by selecting the location of the nasion and pre-auriculars on the anatomical MRI. The fiducials were subsequently displayed on a 3D display of the head surface, as obtained from the segmented MRI, and visually compared with the location of the fiducials in the digital photographs taken during the MEG experiment. The location of the fiducials in the MRI was adjusted if there was a mismatch between the location of the fiducials on the MRI surface and the photographs. Severity of AVH during scanning was assessed directly after data acquisition using the Auditory Hallucinations Rating Scale (AHRS). This questionnaire assesses multiple characteristics of AVH such as the frequency of occurrence, loudness of the voices, length of AVH, and influence and discomfort of AVH as experienced by the patient [22]. In addition to the above, the Positive and Negative Syndrome Scale (PANSS) was used to assess clinical symptomatology [23].
Table 1.Patient characteristics.
Subject Sex Age (years)
Age of onset AVH
(years) Handedness Psychiatric diagnosis Antipsychotic medication/day
A M 41 21 Right paranoid schizophrenia clozapine 300 mg and risperidone 3 mg
B M 36 34 Right paranoid schizophrenia no antipsychotic medication
C F 52 19 Right psychosis NOS; borderline personality
disorder
clozapine 600 mg
D M 39 19 Right paranoid schizophrenia chlorprothixene 200 mg
E M 26 25 Left paranoid schizophrenia flupenthixol 6 mg
F F 57 8 Right paranoid schizophrenia no antipsychotic medication
G M 36 23 Right paranoid schizophrenia clozapine 400 mg
H M 41 6 Right paranoid schizophrenia clozapine 300 mg
I M 62 30 Right psychosis NOS no antipsychotic medication
J F 57 9 Right paranoid schizophrenia quetiapine 600 mg
K M 35 30 Right paranoid schizophrenia no antipsychotic medication
L F 42 26 Right paranoid schizophrenia olanzapine 10 mg
Data selection
Artifact-free segments were selected by visual inspection by two experienced MEG investigators (RvL and AH). In the present study, the neural correlates of AVH were investigated by contrasting the AVH state versus the non-AVH state. In addition, the neural correlates of AVH onset were investigated by contrasting the first 2 seconds of the AVH state versus the 2 seconds preceding AVH onset. Data selection procedures were different for both analyses:
i) For the AVH-state vs. non-AVH state analysis, duration and number of selected time segments were identical for the hallucinatory and non-hallucinatory states within each sub-ject, but these parameters were dissimilar across subjects in order to maximize the total amount of useful data for each participant. As the selection of longer segments led to fewer usable segments (because of large intra-individual heteroge-neity in AVH and non-AVH duration and a higher chance of artifacts being present), maximization of data was achieved by selecting the segment length for which the product of number of segments and segment length was largest. Segments started at the presses’ offset. To verify the effect of the button-presses, 5 s segments were selected from the control experiment, with segments starting at the left and right button-presses’ offset. The number of segments in the control and AVH analysis was individually matched. Individual data regarding selected segments are provided in Table S1. ii) For the onset of AVH analysis, 2 seconds prior and 2 seconds
following AVH onset were selected. This timeframe was chosen because of practical considerations; selection of longer timeframes would result in a sharp drop in useful segments because of the large heterogeneity in AVH and non-AVH duration, presence of artifacts, and decreased matching possibilities with the control experiment. Individual data regarding selected segments are provided in Table S1. As a control condition, the same analyses were performed for the control experiment, with artifact-free segments of 2 seconds surrounding the left button-press serving as a control condition for the AVH onset analysis. The number of selected segments in the control analysis was matched individually to the AVH onset analysis, and duration of the incorporated button-press was matched at the group-level.
Data analysis
Electromagnetic source analysis was conducted with the Synthetic Aperture Magnetometry (SAM) beamformer algorithm as implemented in the CTF software [24]. With this approach, an optimal spatial filter is constructed for each location in the brain individually using the entire array of MEG sensors. Estimates of neuronal activity in the target locations can then be obtained by projecting sensor power through the filter. These estimated timeseries have the same millisecond temporal resolution as the original MEG recording [25] and are usually referred to asvirtual electrodesignals [26]. Differential images of source power (pseudo-t
maps) can then be constructed by contrasting the neuronal power in each location for two conditions (divided by a projection of the estimated sensor noise [27]. In this experiment, beamformer images were constructed on a 5 mm3grid throughout the whole brain. Four separate frequency bands were selected for analysis (delta 0.5–4 Hz, theta 4–8 Hz, alpha 8–13 Hz, beta 13–30 Hz. The gamma frequency band (30–48 Hz) was not included as high-frequency bands may be contaminated by muscle artefacts [28].
The individual participants’ beamformer images were spatially normalized to a template brain and then averaged across participants, following the procedure described in Singh et al [29]. As a nonparametric approach was most appropriate given the small sample size, statistical analysis was performed using a nonparametric permutation test (SnPM) [30], using all possible permutations. The family-wise error (FWE) correction threshold was set at P = 0.05, combined with an extent threshold of 6 contiguous voxels [31–33]. For the hypothesis-driven focus on specific areas, the analysis was conducted on anatomically defined ROIs, based on previous literature:
i) For the AVH state versus non-AVH state analysis, ROIs were selected based on a recent neuroimaging meta-analysis that implicated the bilateral insula, left middle and left superior temporal gyri, left hippocampus and left parahippocampal gyrus, left supramarginal gyrus, bilateral inferior frontal gyrus, and right globus pallidus in the experience of AVH [15]. To increase sensitivity of the statistical tests, motor areas were not included in the mask, as any potential activation in these regions is likely to be related to the button-presses.
ii) For the AVH onset analysis, ROIs included the bilateral hippocampus and parahippocampal gyrus [5,16,17]. Recent studies have demonstrated the efficacy of MEG in detecting and localizing hippocampal activity [34–37]. In order to explore whether findings in this analysis are prolonged or primarily occurring in the small-time-frame surrounding AVH onset, this reduced mask was also applied to the AVH state versus non-AVH state data. Time-frequency plots were calculated at peak loci for each individual using a Morlet wavelet transform. These peak loci were located in close proximity to the peaks observed in the group analysis.
To elucidate potential associations between symptomatology and changes in neuronal activity, in a secondary analysis correlations between changes in delta, theta, alpha and beta-band activity in analysis i) and analysis ii) and scores on the AHRS and the positive symptom scale of the PANSS were investigated. Detailed information regarding this analysis is provided in Text S1. ROIs were defined using the WFU Pickatlas software tool (version 2.4, Wake Forest University, Winston-Salem, NC, USA; http://fmri.wfubmc.edu/cms/software) and the AAL library [38], and subsequently resliced to the coordinate system of the spatially normalized MEG datasets. To be able to assess cortical activity at the boundaries of the masks, both masks were inflated by 2 mm. Anatomical labelling of significant activation clusters was performed with the WFU Pickatlas using the AAL library, and MRIcron (http://www.sph.sc.edu/comd/rorden/mricron/) was used for visualization of group activation maps.
Results
Behavioral
AVH versus non-AVH state analysis
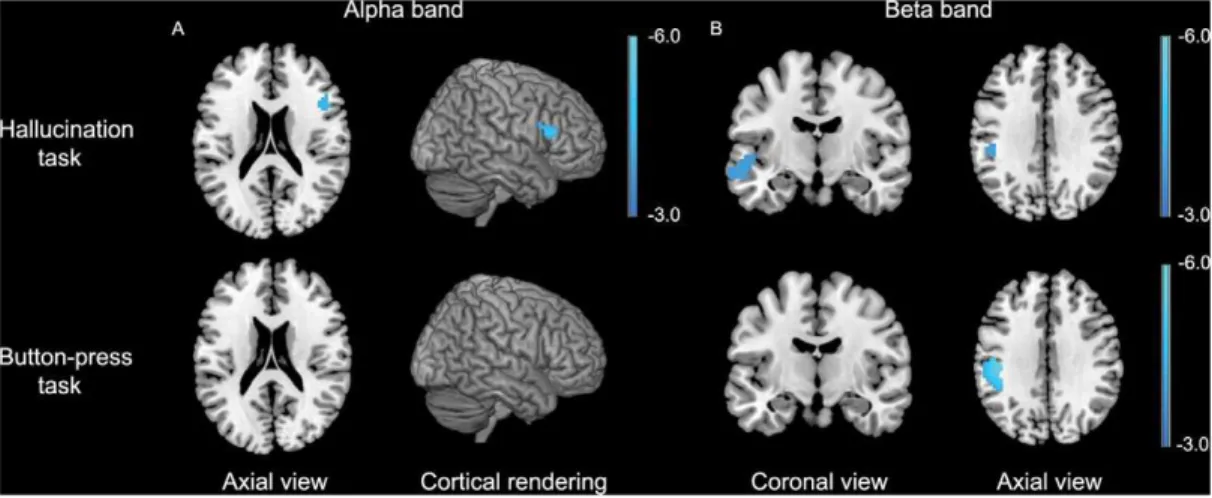
MEG imaging revealed a statistically significant relative de-crease in alpha-band neuronal power in the right inferior frontal gyrus, while no changes in alpha-band power were found in the control experiment (fig. 1a). For the beta band, significant relative decreases in power were observed in the left middle temporal gyrus extending into the left superior gyrus and in the left supramarginal gyrus. Changes in beta-band power in the latter region was also found in the control experiment (fig. 1b). Detailed information about the coordinates of local maxima and corre-sponding cluster sizes is shown in table 2.
AVH onset analysis
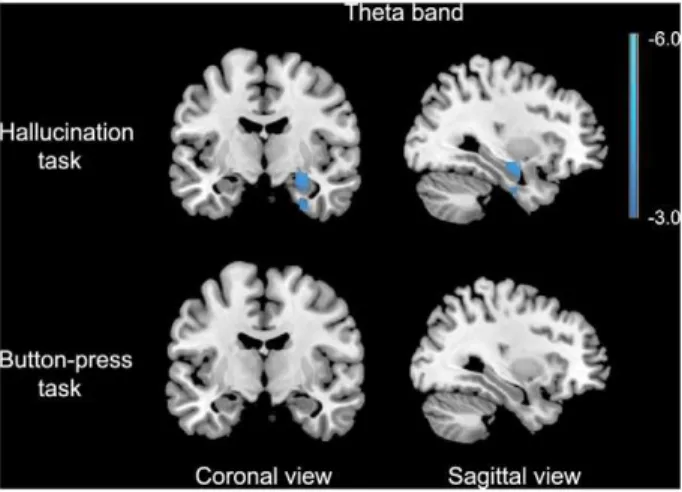
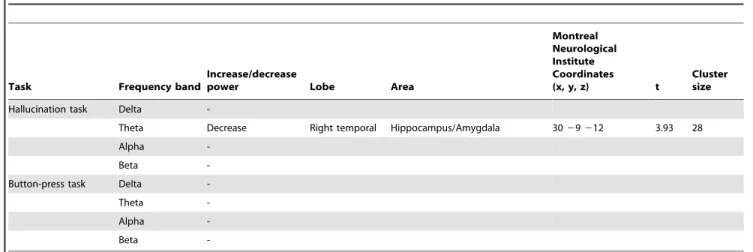
A significant relative decrease in theta-band power was found in the right hippocampus extending into the amygdala in the 2 seconds following AVH onset versus the 2 seconds preceding AVH onset. For the self-paced button-press task, no change in theta-band power was found (fig. 2), while for the other frequency-bands no changes in power were observed in both experiments. Detailed information about the coordinates of local maxima and corresponding cluster sizes are shown in table 3, and time-frequency representations of two representative subjects are shown in Figure S1. Application of the AVH-onset mask to the AVH state versus non-AVH state data yielded no significant results in any frequency band.
Associations between clinical symptoms and changes in neuronal activity
No significant correlations were found between total AHRS scores and changes in neuronal activity related to either the experience of AVH or the onset of AVH. Sum scores of the positive symptom scale of the PANSS correlated positively with AVH-related changes in beta band power in the left inferior frontal gyrus (k = 27; MNI coordinates218 21 218), indicating that increased levels of positive symptoms were related to increased changes in beta-band neuronal power during the occurrence of AVH in this structure. No significant correlations were found between sum scores on the positive symptom scale of the PANSS for the AVH onset analysis.
Discussion
This is the first study to utilize the excellent temporal resolution of MEG to investigate brain activity related to AVH onset. It is also the first study investigating the neural correlates of AVH employing MEG in a substantial sample (n = 12), enabling group-wise analysis.
AVH were associated with a decrease in alpha-band power in the right inferior frontal gyrus and with a decrease in beta-band power in the left middle and superior temporal gyrus. The motor control task did not result in any changes in neuronal power in these areas. AVH onset was accompanied by a decrease in theta-band power in the right hippocampus while in the control task no change in theta-band power was observed in this brain structure.
AVH state versus non-AVH state analysis
AVH-related changes in the left temporal cortex, where we observed a decrease in beta-band power, are usually interpreted as auditory processing related to the perception of voices [6]. It has been suggested that beta oscillations are involved in underscoring a stimulus as novel or salient [39,40]. The observed change in activity in this frequency band during the experience of AVH is as such in line with the fact that AVH are often of high emotional content (frightening) and therefore of high salience. An alternative explanation linking the decrease in beta-band power to AVH may be that the process of corollary discharge (i.e. a signal originating in frontal speech production areas that is sent to auditory perception areas to indicate that forthcoming thought is self-generated) is disturbed through the decrease in oscillatory power in this frequency band. For the observed decrease in alpha-band power in the right inferior frontal gyrus several explanations are possible, including processing of linguistic emotional information, detection of salient events and dysfunctional inhibition processes [41–43].
The present findings are partially consistent with those of previous studies. Functional MRI studies have implicated changes in activity in the left middle and left superior temporal cortex and right inferior frontal gyrus during AVH [5,13,15,44]. Our findings are also partially in line with previous MEG studies, reporting increases in theta-band and beta-band power in the left superior temporal gyrus (STG) [7,10], and an increase in beta-band activity in the left STG extending into the left dorsolateral prefrontal cortex (DLPFC) during AVH [9]. In the current study, the left
Figure 1. Results for the AVH versus non-AVH analysis for the alpha and beta frequency bands.Data are superimposed on a template brain and are presented in neurological convention (right is right). P,0.05, FWE corrected. The color bar indicates t-values.
STG was associated with a decrease instead of an increase in beta-band power during AVH. The previously published MEG studies reported single cases [7,10] or three cases analyzed individually [9]. Single subject analyses yield more variable and less reliable results than group-wise analysis, providing a possible explanation for the divergent findings [45]. An EEG study also implicated the left STG, albeit in the alpha band [46]. The divergent findings in frequency bands between EEG and MEG may be explained by differences in methodologies. EEG sensors pick up electrical activity related to neuronal activity and these signals are smeared out by the skull. MEG measures magnetic activity, which is not substantially affected by the skull.
AVH onset analysis
We observed a decrease in theta-band power in the hippocam-pus during AVH onset. Animal research of the hippocamhippocam-pus has revealed some of the functions of theta-band oscillations in memory retrieval. Cell recordings in the hippocampus in rat models have provided support that theta and gamma oscillations together form a code for neural representations of memorized items [47,48]. Each cycle of the fast gamma rhythm is generated by a different neural ensemble, and represents a single item in memory [49,50]. The gamma cycles are ordered by much slower theta-waves, i.e. theta waves form the ‘punctuation’ of the gamma oscillations and as such the items in memory they represent [49]. Moreover, the theta waves on which the gamma oscillations are superimposed coordinate the pattern of neuronal firing over larger brain areas [51]. The proposed function of theta oscillations would be to integrate different representations of perception, memory and association into one coherent concept, e.g. a congruent line of thoughts and experiences [49,51]. The onset of a hallucination can be viewed as an interruption of this coherent line [51]. Hence, the change in theta rhythm observed in the hippocampus and parahippocampal gyrus at the onset of hallucinations may reflect the cessation of a coherent line of thoughts and perception, and perhaps the transition from a state of consciousness that is focused around perception of information from the sense organs to a state that relies to a higher degree on internal representations collected from memory.
In the present study no changes in hippocampal theta-band activity were found in the AVH state versus the non-AVH state, yet a transient change in theta-band activity surrounding AVH onset was found, suggesting that a temporary disturbance in
theta-Table
2.
Significantly
activated
voxels
and
locations
of
local
maxima
during
auditory
verbal
hallucinations
in
the
group
hallucination
task
and
button-pre
ss
task.
Task
Frequency
band
Increase/decre
ase
power
Lobe
Area
Montreal
Neurological
Institute
Coordinates
(x,
y
,
z)
t
Cluster
size
Hallucination
task
Delta
-Theta
-Alpha
Decrease
Right
frontal
Inferior
frontal
gyrus
4
8
21
1
5
4
.88
36
Beta
Decrease
Left
temporal
Superior
temporal
gyrus/Middle
temporal
gyrus
2
60
2
12
2
12
4.04
48
Decrease
Left
parietal
Supramarginal
gyrus
2
48
2
33
33
4.00
12
Button-press
task
Delta
-Theta
-Alpha
-Beta
Decrease
Left
parietal
Supramarginal
gyrus/Postcentral
g
yrus
2
42
2
24
33
5.76
229
doi:10.1371/journal.pone.
0041149.t002
band activity may underlie the genesis of hallucinations through a short aberration in theta-band mediated integration of different representations. The present findings of changes in neuronal power in the theta band in the hippocampus surrounding AVH onset are partially in line with previous fMRI studies, which reported changes in activity in the parahippocampal gyrus to precede the onset of AVH [5,16,17]. This finding is also consistent with a recent cognitive model that postulates that AVH arise from dysfunctioning in memory processes and top-down inhibitory processing, in which the latter may be mediated by the right inferior frontal gyrus [42,52–54].
As AVH often consist of emotional content, future research could focus on elucidating the relationship between emotional valence of AVH and neuronal activity related to the symptom [55].
Limitations
A limitation of this study is that AVH were assessed by self-report, rendering the precision of AVH onset and offset subject to the patients’ accuracy. Furthermore, we used a self-paced button-press paradigm as a control task. Although this paradigm is often used to investigate the effect of button-presses in a hallucination task [13,17], the process of attention may not be similar in both tasks, as patients are required to press the buttons to indicate the presence of hallucinations in the hallucination task (‘externally triggered’) and the control task is self-paced (‘internally triggered’). As such, we recommend that future studies incorporate an additional non-self-paced control task, e.g. indicating the presence of externally presented auditory stimuli. Another limitation is that the presence of AVH during the control task may have influenced results. This is however not likely, as the self-paced button-presses were not related to the presence of AVH, leading to the presence of AVH in both parts of the contrast, and resulting in presumably no or minor impact on the analysis. Finally, most of the patients in the current study were on antipsychotic medication. This may have influenced results, as antipsychotic agents have been reported to affect theta-band activity [56].
To summarize, this is the first study focusing on the small time-frame surrounding AVH onset which could identify the triggering
mechanism of hallucinations. The onset of AVH was accompanied by changes in theta-band power in the right hippocampus. Furthermore, AVH were associated with a decrease in alpha-band power in the right inferior frontal gyrus and with decreases in beta-band power in the left middle and superior temporal gyri, which are regions generally implicated in auditory and language processes. These results suggest that AVH are triggered by a short aberration in the theta band in the hippocampus, followed by activity in auditory areas accompanying the experience of hearing voices. We speculate that these aberrations may disturb the coherency of thoughts and perception such that there is an increased focus on internal representations collected from mem-ory. New treatment options, such as deep brain stimulation, may target hippocampal structures in order to restore their normal function and impede the onset of AVH.
Supporting Information
Figure S1 Time-frequency representation (TFR) plots of source peak activity in the right hippocampus surround-ing AVH onset in two representative subjects. The frequency band in which a significant difference was observed in this brain region (group analysis) is indicated by the black box. The vertical line indicates the onset of hallucinations. TF: time-frequency. AVH: auditory verbal hallucinations.
(TIF)
Table S1 Length and number of selected segments for the auditory verbal hallucination (AVH) analysis and the AVH onset analysis per subject.
(DOC)
Text S1 Supporting text. (DOC)
Author Contributions
Conceived and designed the experiments: RvL AH CJS IECS. Performed the experiments: RvL. Analyzed the data: RvL AH. Contributed reagents/ materials/analysis tools: AH KMJD KD . Wrote the paper: RvL AH RSK CJS IECS.
Table 3.Significantly activated voxels and locations of local maxima in the group hallucination onset analysis for the hallucination
task and the control task.
Task Frequency band
Increase/decrease
power Lobe Area
Montreal Neurological Institute Coordinates
(x, y, z) t
Cluster size
Hallucination task Delta
-Theta Decrease Right temporal Hippocampus/Amygdala 3029212 3.93 28
Alpha
-Beta
-Button-press task Delta
-Theta
-Alpha
-Beta
References
1. Nayani TH, David AS (1996) The auditory hallucination: A phenomenological survey. Psychol Med 26: 177–189.
2. Slade P, Bentall R (2002) Sensory deception: a scientific analysis of hallucinations. London (UK): Croom Helm.
3. Cheung P, Schweitzer I, Crowley K, Tuckwell V (1997) Violence in schizophrenia: Role of hallucinations and delusions. Schizophr Res 26: 181–190. 4. Copolov DL, Seal ML, Maruff P, Ulusoy R, Wong MT, et al. (2003) Cortical activation associated with the experience of auditory hallucinations and perception of human speech in schizophrenia: a PET correlation study. Psychiatry Res 122: 139–152.
5. Diederen KMJ, Neggers SFW, Daalman K, Blom JD, Goekoop R, et al. (2010) Deactivation of the parahippocampal gyrus preceding auditory hallucinations in schizophrenia. Am J Psychiatry 167: 427–435.
6. Dierks T, Linden DEJ, Jandl M, Formisano E, Goebel R, et al. (1999) Activation of Heschl’s Gyrus during auditory hallucinations. Neuron 22: 615–621. 7. Ishii R, Shinosaki K, Ikejiri Y, Ukai S, Yamashita K, et al. (2000) Theta rhythm
increases in left superior temporal cortex during auditory hallucinations in schizophrenia: a case report. Neuroreport 11: 3283–3287.
8. McGuire PK, Shah GMS, Murray RM (1993) Increased blood-flow in Broca Area during auditory hallucinations in schizophrenia. Lancet 342: 703–706. 9. Reulbach U, Bleich S, Maihofner C, Kornhuber J, Sperling W (2007) Specific
and unspecific auditory hallucinations in patients with schizophrenia - A magnetoencephalographic study. Neuropsychobiology 55: 89–95.
10. Ropohl A, Sperling W, Elstner S, Tomandl B, Reulbach U, et al. (2004) Cortical activity associated with auditory hallucinations. Neuroreport 15: 523–526. 11. Shergill SS, Brammer MJ, Williams SCR, Murray RM, McGuire PK (2000)
Mapping auditory hallucinations in schizophrenia using functional magnetic resonance imaging. Arch Gen Psychiatry 57: 1033–1038.
12. Silbersweig DA, Stern E, Frith C, Cahill C, Holmes A, et al. (1995) A functional neuroanatomy of hallucinations in schizophrenia. Nature 378: 176–179. 13. Sommer IEC, Diederen KMJ, Blom JD, Willems A, Kushan L, et al. (2008)
Auditory verbal hallucinations predominantly activate the right inferior frontal area. Brain 131: 3169–3177.
14. van de Ven VG, Formisano E, Roder CH, Prvulovic D, Bittner RA, et al. (2005) The spatiotemporal pattern of auditory cortical responses during verbal hallucinations. Neuroimage 27: 644–655.
15. Jardri R, Pouchet A, Pins D, Thomas P (2010) Cortical activations during auditory verbal hallucinations in schizophrenia: a coordinate-based meta-analysis. Am J Psychiatry doi: 10.1176/appi.ajp.2010.09101522
16. Hoffman RE, Anderson AW, Varanko M, Gore JC, Hampson M (2008) Time course of regional brain activation associated with onset of auditory/verbal hallucinations. Br J Psychiatry 193: 424–425.
17. Hoffman RE, Pittman B, Constable RT, Bhagwagar Z, Hampson M (2011) Time course of regional brain activity accompanying auditory verbal hallucina-tions in schizophrenia. Br J Psychiatry 198: 277–283.
18. Lennox BR, Bert S, Park G, Jones PB, Morris PG (1999) Spatial and temporal mapping of neural activity associated with auditory hallucinations. Lancet 353: 644–644.
19. Shergill SS, Brammer MJ, Amaro E, Williams SCR, Murray RM, et al. (2004) Temporal course of auditory hallucinations. Br J Psychiatry 185: 516–517. 20. Andreasen NC, Flaum M, Arndt S (1992) The Comprehensive Assessment of
Symptoms and History (Cash) - An instrument for assessing diagnosis and psychopathology. Arch Gen Psychiatry 49: 615–623.
21. Vrba J, Anderson G, Betts K, Burbank MB, Cheung T, et al. (1999) 151-Channel whole-cortex MEG system for seated or supine positions. Recent advances in biomagnetism. Sendai (Japan): Tohoku University Press. pp. 93–96. 22. Hoffman RE, Hawkins KA, Gueorguieva R, Boutros NN, Rachid F, et al. (2003) Transcranial magnetic stimulation of left temporoparietal cortex and medica-tion-resistant auditory hallucinations. Arch Gen Psychiatry 60: 49–56. 23. Kay SR, Fiszbein A, Opler LA (1987) The positive and negative syndrome scale
(PANSS) for schizophrenia. Schizophr Bull 13: 261–276.
24. Robinson SE, Vrba J, Yoshimoto T, Kotani M, Kuriki S, et al. (1999) Functional neuroimaging by synthetic aperture magnetometry (SAM). Recent Advances in Biomagnetism. Sendai (Japan): Tohoku University Press. pp. 302–305. 25. Hillebrand A, Singh KD, Holliday IE, Furlong PL, Barnes GR (2005) A new
approach to neuroimaging with magnetoencephalography. Hum Brain Mapp 25: 199–211.
26. Barnes GR, Hillebrand A (2003) Statistical flattening of MEG beamformer images. Hum Brain Mapp 18: 1–12.
27. Vrba J, Robinson SE (2001) Signal processing in magnetoencephalography. Methods 25: 249–271.
28. Whitham EM, Pope KJ, Fitzgibbon SP, Lewis T, Clark CR, et al. (2007) Scalp electrical recording during paralysis: quantitative evidence that EEG frequencies above 20 Hz are contaminated by EMG. Clin Neurophysiol 118: 1877–1888. 29. Singh KD, Barnes GR, Hillebrand A, Forde EME, Williams AL (2002)
Task-related changes in cortical synchronization are spatially coincident with the hemodynamic response. Neuroimage 16: 103–114.
30. Singh KD, Barnes GR, Hillebrand A (2003) Group imaging of task-related changes in cortical synchronisation using nonparametric permutation testing. Neuroimage 19: 1589–1601.
31. Binder M, Urbanik AS (2006) Material-dependent activation in prefrontal cortex: working memory for letters and texture patterns–initial observations. Radiology 238: 256–263.
32. Prat CS, Keller TA, Just MA (2007) Individual differences in sentence comprehension: a functional magnetic resonance imaging investigation of syntactic and lexical processing demands. J Cogn Neurosci 19: 1950–1963. 33. Schipul SE, Williams DL, Keller TA, Minshew NJ, Just MA (2011) Distinctive
Neural Processes during Learning in Autism. Cereb Cortex 22: 937–950. 34. Cornwell BR, Salvadore G, Colon-Rosario V, Latov DR, Holroyd T, et al.
(2010) Abnormal hippocampal functioning and impaired spatial navigation in depressed individuals: evidence from whole-head magnetoencephalography. Am J Psychiatry 167: 836–844.
35. Hanlon FM, Houck JM, Pyeatt CJ, Lundy SL, Euler MJ, et al. (2011) Bilateral hippocampal dysfunction in schizophrenia. Neuroimage.
36. Quraan MA, Moses SN, Hung Y, Mills T, Taylor MJ (2011) Detection and localization of hippocampal activity using beamformers with MEG: a detailed investigation using simulations and empirical data. Hum Brain Mapp 32: 812– 827.
37. Riggs L, Moses SN, Bardouille T, Herdman AT, Ross B, et al. (2009) A complementary analytic approach to examining medial temporal lobe sources using magnetoencephalography. Neuroimage 45: 627–642.
38. Tzourio-Mazoyer N, Landeau B, Papathanassiou D, Crivello F, Etard O, et al. (2002) Automated anatomical labeling of activations in SPM using a macroscopic anatomical parcellation of the MNI MRI single-subject brain. Neuroimage 15: 273–289.
39. Kisley MA, Cornwell ZM (2006) Gamma and beta neural activity evoked during a sensory gating paradigm: effects of auditory, somatosensory and cross-modal stimulation. Clin Neurophysiol 117: 2549–2563.
40. Uhlhaas PJ, Haenschel C, Nikolic D, Singer W (2008) The role of oscillations and synchrony in cortical networks and their putative relevance for the pathophysiology of schizophrenia. Schizophr Bull 34: 927–943.
41. Hampshire A, Chamberlain SR, Monti MM, Duncan J, Owen AM (2010) The role of the right inferior frontal gyrus: inhibition and attentional control. Neuroimage 50: 1313–1319.
42. Lenartowicz A, Verbruggen F, Logan GD, Poldrack RA (2011) Inhibition-related activation in the right inferior frontal gyrus in the absence of inhibitory cues. J Cogn Neurosci 23: 3388–3399.
43. Rota G, Sitaram R, Veit R, Erb M, Weiskopf N, et al. (2009) Self-Regulation of regional cortical activity using real-time fMRI: The right inferior frontal gyrus and linguistic processing. Hum Brain Mapp 30: 1605–1614.
44. Allen P, Laroi F, McGuire PK, Aleman A (2008) The hallucinating brain: A review of structural and functional neuroimaging studies of hallucinations. Neurosci Biobehav Rev 32: 175–191.
45. van Lutterveld R, Sommer IE, Ford JM (2011) The neurophysiology of auditory hallucinations - a historical and contemporary review. Front Psychiatry 2: 1–7. 46. Sritharan A, Line P, Sergejew A, Silberstein R, Egan G, et al. (2005) EEG coherence measures during auditory hallucinations in schizophrenia. Psychiatry Res 136: 189–200.
47. Behrendt RP (2010) Contribution of hippocampal region CA3 to consciousness and schizophrenic hallucinations. Neurosci Biobehav Rev 34: 1121–1136. 48. Jensen O, Lisman JE (1996) Hippocampal CA3 region predicts memory
sequences: Accounting for the phase precession of place cells. Learning & Memory 3: 279–287.
49. Lisman JE, Idiart MAP (1995) Storage of 7+/22 short-term memories in oscillatory subcycles. Science 267: 1512–1515.
50. O’Keefe J, Recce ML (1993) Phase relationship between hippocampal place units and the EEG theta-rhythm. Hippocampus 3: 317–330.
51. Lisman J, Buzsaki G (2008) A neural coding scheme formed by the combined function of gamma and theta oscillations. Schizophr Bull 34: 974–980. 52. Badcock JC (2010) The cognitive neuropsychology of auditory hallucinations:
a parallel auditory pathways framework. Schizophr Bull 36: 576–584. 53. Badcock JC, Waters FA, Maybery MT, Michie PT (2005) Auditory
hallucina-tions: failure to inhibit irrelevant memories. Cogn Neuropsychiatry 10: 125–136. 54. Waters FA, Badcock JC, Michie PT, Maybery MT (2006) Auditory hallucina-tions in schizophrenia: intrusive thoughts and forgotten memories. Cogn Neuropsychiatry 11: 65–83.
55. Daalman K, Boks MP, Diederen KM, de Weijer AD, Blom JD, et al. (2010) The same or different? A phenomenological comparison of auditory verbal hallucinations in healthy and psychotic individuals. J Clin Psychiatry 72: 320– 325.