Inferring RBP-Mediated Regulation in Lung
Squamous Cell Carcinoma
Atefeh Lafzi1, Hilal Kazan2*
1Department of Health Informatics, Middle East Technical University, Ankara, Turkey,2Department of Computer Engineering, Antalya International University, Antalya, Turkey
Abstract
RNA-binding proteins (RBPs) play key roles in post-transcriptional regulation of mRNAs. Dysregulations in RBP-mediated mechanisms have been found to be associated with many steps of cancer initiation and progression. Despite this, previous studies of gene expression in cancer have ignored the effect of RBPs. To this end, we developed a lasso regression model that predicts gene expression in cancer by incorporating RBP-mediated regulation as well as the effects of other well-studied factors such as copy-number variation, DNA methylation, TFs and miRNAs. As a case study, we applied our model to Lung squamous cell carcinoma (LUSC) data as we found that there are several RBPs differentially
expressed in LUSC. Including RBP-mediated regulatory effects in addition to the other fea-tures significantly increased the Spearman rank correlation between predicted and mea-sured expression of held-out genes. Using a feature selection procedure that accounts for the adaptive search employed by lasso regularization, we identified the candidate regula-tors in LUSC. Remarkably, several of these candidate regularegula-tors are RBPs. Furthermore, majority of the candidate regulators have been previously found to be associated with lung cancer. To investigate the mechanisms that are controlled by these regulators, we predicted their target gene sets based on our model. We validated the target gene sets by comparing against experimentally verified targets. Our results suggest that the future studies of gene expression in cancer must consider the effect of RBP-mediated regulation.
Introduction
Aberrant gene expression is a main feature of cancer development. Characterizing the regula-tory events that lead to gene expression changes during cancer development is critical for can-cer research. Differential gene expression in cancan-cer can occur due to several factors including copy-number variation (CNV), DNA methylation changes, and alterations in transcriptional and post-transcriptional regulatory mechanisms. Among these factors, post-transcriptional regulation (PTR) has gained significant importance due to its emerging roles in cancer biology.
PTR is mediated by the interactions of RNA-binding proteins (RBPs) and microRNAs (miRNAs) with target mRNAs through short sequence and/or structure motifs. Recent studies
a11111
OPEN ACCESS
Citation:Lafzi A, Kazan H (2016) Inferring RBP-Mediated Regulation in Lung Squamous Cell Carcinoma. PLoS ONE 11(5): e0155354. doi:10.1371/journal.pone.0155354
Editor:Julio Vera, University of Erlangen-Nuremberg, GERMANY
Received:January 13, 2016
Accepted:April 27, 2016
Published:May 17, 2016
Copyright:© 2016 Lafzi, Kazan. This is an open access article distributed under the terms of the
Creative Commons Attribution License, which permits unrestricted use, distribution, and reproduction in any medium, provided the original author and source are credited.
Data Availability Statement:All relevant data are within the paper and its Supporting Information files.
Funding:This work was supported by The Scientific and Technological Research Council of Turkey (113E159 to H.K.) and European Union Marie Curie Career Integration Grant (631986 to H.K.). The funders had no role in study design, data collection and analysis, decision to publish, or preparation of the manuscript.
have found that RBPs are key regulators controlling every step of RNA metabolism including RNA splicing, transport, localization, decay and translation. More than 850 RBPs have been identified in the human genome [1,2]. Recent advances in experimental methods that charac-terize the binding sites of RBPs have significantly expanded our knowledge ofin vivoandin vitroRBP binding preferences [3,4]. This recent explosion of knowledge on RBP binding sites provide opportunities to study RBP-mediated regulation in greater detail.
Several RBPs have been found to be implicated in cancer [5]. For example, overexpression of KHDRBS1 (Sam68) has been revealed in various cancer types including breast, prostate, colorectal and lung cancer cells [6–8]. KHDRBS1 is found to mediate the alternative splicing of oncogenes. ELAVL1 is another well-known RBP that is found to be associated with tumorigen-esis by regulating the stability and translation of key growth factors and proto-oncogenes [9, 10]. Overexpression of ELAVL1 has been observed in many cancer types [11,12]. Recently, FXR1 is found to regulate tumor progression in lung cancer, and is identified as a driver of the 3q amplicon, the most frequent genomic alteration in squamous cell lung cancers [13]. These and many other example indicate that dysregulation of the function or the expression of RBPs has profound implications for cancer development.
Recently developed computational models that study gene expression in cancer have mainly focused on transcriptional regulation and miRNA-mediated regulation. For instance, Setty et al predicted expression changes in glioblastoma (GBM) with a lasso-regularized regression [14]. In addition to CNV and methylation changes, they included features that correspond to TF binding sites from TRANSFAC filtered by DNA hypersensitive regions, and miRNA bind-ing sites obtained from scannbind-ing with 7-mer seed sequences. Their model predicted a number of key regulators from TFs and miRNAs that are predictive of survival rate in GBM. Jacobsen et al focused on miRNA-based regulation, ignoring transcriptional-regulation [15]. They looked at the relation between the expression of miRNAs and mRNAs in tumors from 11 human cancer types in TCGA, and identified a pan-cancer miRNA-mRNA network. Li et al proposed a two-stage regression framework that combines data from TCGA and ENCODE to predict gene expression in Acute Myeloid Leukemia (AML) [16]. Their model revealed a num-ber of TFs and miRNAs as candidate regulators of AML. To the best of our knowledge, there is still no study that investigates the effects of RBP-mediated regulation in cancer.
In this study, we propose to explain gene expression in cancer with a statistical model that incorporates RBP-based regulation in addition to CNV, DNA methylation and the regulatory effects of transcription factors and miRNAs. As a case study, we applied our model to Lung squamous cell carcinoma (LUSC) dataset, as we found that there are a large number of differ-entially expressed RBPs in this cancer type. By comparing the performance of our full model with partial models that exclude one of the feature groups (e.g. TFs, CNV etc.), we show that the added predictive value of RBPs is higher than all the other feature groups. Following up on this result, we applied a feature selection procedure to identify the RBPs as well as other factors that play a key role in LUSC. Importantly, majority of our predicted candidate regulators are previously found to be associated with lung cancer, and are differentially expressed. Subse-quently, we determined the targets of these candidate regulators, and compared against experi-mentally determined targets. The results of this study suggest that future studies of gene regulation must consider the effects of RBP-mediated regulation.
Materials and Methods
Data integration and preprocessing
estimate data were multiplied by 106to obtain relative abundance (in Transcripts Per Million [TPM]). Genes that have0.1 TPM in more than 70% of the samples were removed. TPM val-ues were log2 transformed for subsequent analysis. For miRNA expression, Illumina HighSeq (387 samples) and Illlumina GA (136 samples) datasets were combined. GISTIC2-processed DNA copy-number data and DNA methylation (Level 4) data were retrieved from Firehose (http://gdac.broadinstitute.org/runs/analyses__2014_10_17)). For each gene, the methylation probe that shows the strongest negative correlation (Pearson correlation coefficient) between methylation“Beta-value”and mRNA expression across all samples was selected. We used Human Proteome Atlas to determine the RBPs and TFs that are expressed in lung cancer [18]. Human Proteome Atlas provides immunohistochemistry results on 12 tumors for each cancer type [19]. RBPs and TFs that show expression in at least one of these tumors were considered as expressed.
Differential expression analysis
We downloaded datasets for cancer types that have sufficient number of paired samples (i.e.,
>15 matched tumor-normal samples). According to this criteria, the following 13 cancer types
were selected: BLCA, BRCA, COAD, HNSC, KICH, KIRC, KIRP, LIHC, LUAD, LUSC, PRAD, THCA and UCEC (S1 Table). We downloaded raw counts from RNA-seq (level 3) datasets. We filtered out the genes that are not expressed in the majority of the samples by removing those genes with1 read count per million in more than 50% of samples [20]. We used edgeR to calculate the log fold changes (LFCs) of genes that code for RBPs within each cancer type [21]. In particular, we determined differential expression using the generalized linear model likelihood ratio test (usingglmFitandglmLRTfunctions). We defined differentially expressed RBPs as those genes with FDR cutoff<0.05 and |LFC|>0.5. We plotted the LFCs of RBPs
across the cancers as a heat map and performed row and column clustering usingheatmap.2 function in R (hierarchical clustering performed with Pearson correlation distance and average linkage). We performed a similar analysis to identify differentially expressed miRNAs after fil-tering miRNAs that have less than 1 read count per million miRNA reads in more than 70% of samples.
Target prediction of regulatory elements
Transcription factors. Promoters were defined as the ±2000 bp region around the tran-scription start sites (TSS) of genes based on Refseq annotation. Position frequency matrices (PFMs) of human transcription factors (for 382 TFs) were obtained from JASPAR database [22]. We used the motif scanning tool FIMO from MEME-Suite [23] to map the binding sites of transcription factors along the promoter regions (selected matches with p-value<1e−4).
Next, we counted the sites that intersect with DNaseI hypersensitive regions determined in A549 cells [24] to define the feature vectors of TFs.
MicroRNAs. We downloaded the human 3’UTRs compiled by Agarwal et al [25]. These 3’UTRs were derived by extending Gencode annotations (Harrow et al., 2012) with recent data on 3’UTR isoforms [26]. To define the miRNA target sites, we downloaded conserved targets from the recently released TargetScan database (v7, [25]). The input vector for a miRNA fea-ture includes the counts of target sites on each gene.
We downloaded CLIP-seq and PARCLIP data for a list of RBPs (ELAVL1, FMR1, FUS, FXR1, FXR2, hnRNPC, IGF2BP1-3, LIN28, PTBP1, PUM2, QKI, SRSF1, TIA1) from starBase data-base [28]. In addition to these RBP specific CLIP datasets, we downloaded gPARCLIP-deter-mined peaks that correspond to regions occupied by any of the expressed RBPs in HEK293 cells [1]. We intersected CLIP- and gPARCLIP-determined peaks with human 3’UTRs. To account for background binding bias in CLIP-based techniques (identified in [29]) we excluded the parts of peaks that overlap with regions that correspond to background binding. Next, we determined the RBP sites that are located in these peaks.
LUSC dataset
After compiling all the datasets for LUSC, we first intersected the CNV, DNA methylation and binding datasets of TFs, RBPs and miRNAs. This resulted in 12,436 genes and 362 tumor sam-ples in common. Then, we removed those regulatory factors that have no binding site in any of these genes. Finally, we merged the features that have identical input vectors (i.e., identical counts across the genes) to a single feature (S2 Table). In the end, we had 204 TFs, 164 miR-NAs, 49 RBPs as our regulatory features.
Feature selection
In order to determine candidate regulators in LUSC, we performed a feature selection proce-dure specifically developed for lasso-regularized regression models. We downloaded the Selec-tive Inference package from R and used thefixedLassoInffunction to calculate selective p-values for a given lambda (i.e. regularization constant) value. Here, we used the lambda that is selected withcv.glmnetfunction. We repeated this procedure for each sample independently, and calculated, for each feature, the number of times a significant p-value (p-val<0.05) is
obtained.
Identification of target gene sets of candidate regulators
We summed the changes in prediction error of each gene across the samples when a regulator is removed. To estimate the significance of the error changes, we repeated this calculation with shuffled feature matrices 5000 times [14]. The shuffling was done for each column indepen-dently. We calculated an empirical p-value (for a gene-regulator pair) by comparing the error change obtained from the original feature matrix with the distribution of error changes that are obtained from shuffled feature matrices. The target gene set of a regulator is defined as the genes with FDR-corrected p-value<= 2e−4. We compared the predicted target genes of RBPs
against CLIP-based targets. To evaluate the predicted targets of miRNAs, we downloaded experimentally verified targets from MirTarBase database [30]. We grouped the experimentally verified targets based on the type of evidence. Namely, targets identified with reporter assay, western blot and qPCR provide strong evidence; whereas targets identified with approaches such as microarray, NGS-based methods, pSILAC provide less strong or weak evidence.
Results
Differentially expressed RBPs in cancer
matched samples for each cancer (seeS3 Tablefor results).Fig 1shows the log fold changes (LFCs) of RBPs that are differentially expressed in at least one of these cancer types (LFC>0.5
or LFC<−0.5, FDR-corrected p-value<0.05). We observed that a number of well-known
RBPs (e.g. PTBP1, KHSRP, ELAVL1, PABPC1, PABPC3, HNRNPAB) display increased expression in majority of cancer types. Among these RBPs, ELAVL1 has been previously found to have elevated levels of expression in cancer [32]. On the other hand, RBPs such as CPEB4,
Fig 1. Differentially expressed RBPs in cancer.This heatmap shows the log fold expression changes of RBPs across matched tumor-normal samples (calculated with edgeR [21]). Rows are the RBPs that are differentially expressed in at least one cancer type. Columns correspond to different cancer types. Rows and columns are clustered with hierarchical clustering.
RBMS3, QKI and ZFP36 show decreased expression across the majority of cancer types. Inter-estingly, FXR1 is found to be overexpressed most in LUSC compared to the other cancer types. Indeed, a recent study revealed FXR1 as a driver for non-small cell lung cancer (NSCLC), and showed that increased FXR1 promotes tumor progression, and is associated with poor survival [13]. Lastly, we observed that IGF2BP2 and IGF2BP3 display strong up- or down-regulation of expression among the different cancer types. In particular, both IGF2BP2 and IGF2BP3 are overexpressed significantly in LUSC. Proteins that belong to the IGF2BP family are known to be expressed mainly in the embryo; however, they have been found to be re-expressed in sev-eral cancer types including lung cancer [33]. We also observe interesting patterns when we cluster the cancer types based on LFCs of RBPs. Interestingly, LUSC is found to be more simi-lar to head and neck squamous cell carcinoma compared to lung adenocarcinoma indicating the importance of cell type of origin. In parallel with our observation, these three cancer types have been previously assigned to a single Pan-Cancer subtype in terms of protein expression [34]. Another sub cluster is formed from bladder urothelial carcinoma and uterine corpus endometrial carcinoma, and the high similarity of these two cancer types in terms of protein expression has been also previously observed [34].
Predicting gene expression in cancer
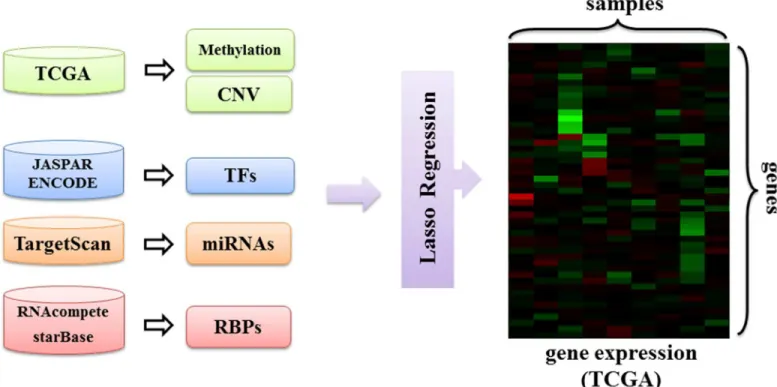
Having found that many RBPs are differentially expressed in LUSC, we set out to investigate the regulatory effects of RBPs in this cancer type in more detail. To this end, we developed a regression model that incorporates copy number variation, DNA methylation and the regula-tory effects of transcription factors, miRNAs and RBPs as features to predict gene expression in LUSC (Fig 2):
yg¼w0þwCCgþwMMgþ X
TF
wTFN TF g þ
X
miR
wmiRN miR
g þ
X
RBP
wRBPN RBP g
whereygis the expression of geneg,Cgis the CNV of geneg,Mgis the gene’s methylation level andNTF
g ,NgmiRandNgRBPare the counts of binding sites of TFs, miRNAs and RBPs for geneg,
respectively. As there are a large number of parameters in this model, we also included a lasso regularization term to enforce sparsity. In this way, we aimed tofind a small set of features that best explain gene expression. We used the glmnet package [35] to learn the model where we set the regularization constant using cross-validation (CV).
Performance evaluation
Candidate regulators of LUSC
Having found that regulatory factors can explain a significant portion of gene expression in LUSC, we used a feature selection procedure to determine the predominant regulators. A com-mon approach to test the importance of an additional feature between two nested linear models is to compare the change in error to a chi-square distribution or F-distribution. However, this approach becomes invalid when the additional feature is chosen adaptively as in lasso regular-ized regression [36]. Despite this fact, F-test has been previously used for lasso [16]. Here, we improve over previous studies by applying a significance test (i.e., covariance test) that accounts for adaptivity [37]. We applied the covariance test for each sample independently, and counted the number of times a significant p-value (p-value<0.05) is obtained for each
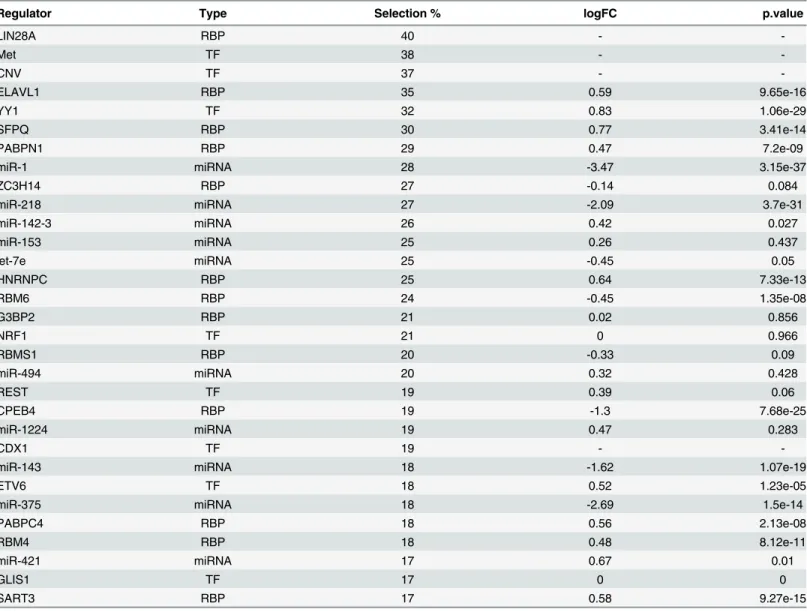
feature.Table 1shows the regulatory factors that are selected in more than 60 samples. In addi-tion to the name and type of the regulator, the log fold change and the associated FDR-cor-rected p-value are also displayed if the regulator is found to be differentially expressed
(complete list of candidate regulators is available inS5 Table). Among the candidate regulators, LIN28A is ranked the first as it was selected as a significant predictor in 40% of all samples. LIN28A is an evolutionarily conserved RBP that is known to increase proliferation by inhibit-ing let-7 biogenesis [38]. The next significant predictors are DNA methylation (38% of all sam-ples) and copy-number variation (37% of all samsam-ples). ELAVL1, which ranks fourth in our list of candidate regulators, has key functions in mRNA stability and translation. In fact, cyto-plasmic ELAVL1 expression has been previously found to be associated with high tumor grade and poor survival rate in non-small cell lung carcinoma [39]. Indeed, we found that ELAVL1 is upregulated in LUSC (LFC = 0.59). We see several other RBPs that are ranked on top of this list. For instance, SFPQ, which is selected as a significant regulator in a large number of Fig 2. Overview of the proposed regression model.DNA methylation, copy number variation and regulatory effects of transcription factors, miRNAs and RBPs are input to a lasso regularized regression model to predict gene expression in LUSC.
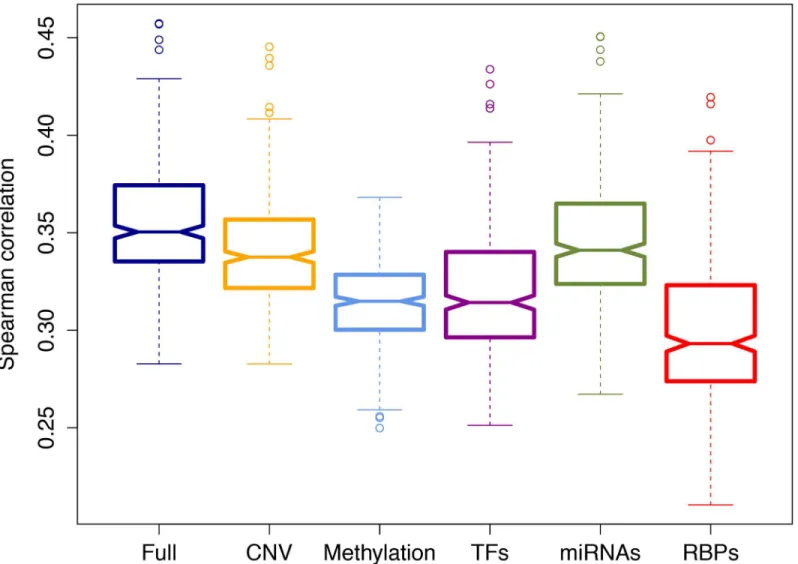
samples, has been recently found to interact with a long non-coding RNA called MALAT1 (metastasis-associated lung adenocarcinoma transcript 1) [40]. MALAT1 is overexpressed in several human cancers including non-small cell lung cancer, and has been identified as a criti-cal regulator of metastasis in lung cancer cells [41,42]. YY1 (Ying Yang 1) is the top ranking regulator among the TFs (LFC = 0.83). YY1 is highly expressed in various cancer types, and its depletion inhibits tumor formation of breast cancer cells [43,44]. We found that miR-1 is the top ranking miRNA regulator. A recent study revealed that miR-1 was significantly reduced in lung squamous cell carcinoma, and its restoration significantly reduced cancer cell progression [45]. The second ranking miRNA, miR-218, is significantly down regulated in lung squamous cell carcinoma and has been identified as candidate tumor suppressor [46]. The LFCs that are calculated with our differential expression analysis are in agreement with these studies (LFCs -3.47 and -2.09 for miR-1 and miR-218 respectively). Lastly, though located on the lower part of the list, FXR1 is one of the identified candidate regulators. A previous study has identified FXR1 as a key regulator of tumor progression and found that its overexpression is critical for nonsmall cell lung cancer (NSCLC) cell growth [13]. Similarly, we found that FXR1 is Fig 3. Added predictive value of regulator types.This box plot displays the Spearman rank correlation between the predicted and the actual held-out genes in 10-fold cross- validation (CV) averaged across all the samples. The full model that uses all features was compared with the partial models that lack one of the regulator groups: CNV (copy number variation), DM (DNA methylation), TFs, miRNAs, RBPs.
significantly upregulated in LUSC (LFC is 1.49). In summary, this table reveals that many of the candidate regulators are differentially expressed between cancer and normal samples. Alto-gether, the high correspondence between our predicted candidate regulators and previous liter-ature indicates that our model is accurate in inferring the key regulators of LUSC.
Target analysis of candidate regulators
The input feature matrix that we compiled by counting the number of binding sites of each reg-ulator in each gene provides a noisy approximation of functional targets of regreg-ulators. To iden-tify the targets of the regulators from our model robustly, we identified the genes for which the squared prediction error increases when a regulator is removed. We determined the signifi-cance of an increase in error by comparing it against a distribution of error changes that are obtained when the feature matrix is randomized (Materials and Methods). We evaluated our predicted target gene sets by comparing against experimentally verified interactions, when available. For RBPs, our validation set consists of the genes that are identified by CLIP Table 1. Selected candidate regulators.
Regulator Type Selection % logFC p.value
LIN28A RBP 40 -
-Met TF 38 -
-CNV TF 37 -
-ELAVL1 RBP 35 0.59 9.65e-16
YY1 TF 32 0.83 1.06e-29
SFPQ RBP 30 0.77 3.41e-14
PABPN1 RBP 29 0.47 7.2e-09
miR-1 miRNA 28 -3.47 3.15e-37
ZC3H14 RBP 27 -0.14 0.084
miR-218 miRNA 27 -2.09 3.7e-31
miR-142-3 miRNA 26 0.42 0.027
miR-153 miRNA 25 0.26 0.437
let-7e miRNA 25 -0.45 0.05
HNRNPC RBP 25 0.64 7.33e-13
RBM6 RBP 24 -0.45 1.35e-08
G3BP2 RBP 21 0.02 0.856
NRF1 TF 21 0 0.966
RBMS1 RBP 20 -0.33 0.09
miR-494 miRNA 20 0.32 0.428
REST TF 19 0.39 0.06
CPEB4 RBP 19 -1.3 7.68e-25
miR-1224 miRNA 19 0.47 0.283
CDX1 TF 19 -
-miR-143 miRNA 18 -1.62 1.07e-19
ETV6 TF 18 0.52 1.23e-05
miR-375 miRNA 18 -2.69 1.5e-14
PABPC4 RBP 18 0.56 2.13e-08
RBM4 RBP 18 0.48 8.12e-11
miR-421 miRNA 17 0.67 0.01
GLIS1 TF 17 0 0
SART3 RBP 17 0.58 9.27e-15
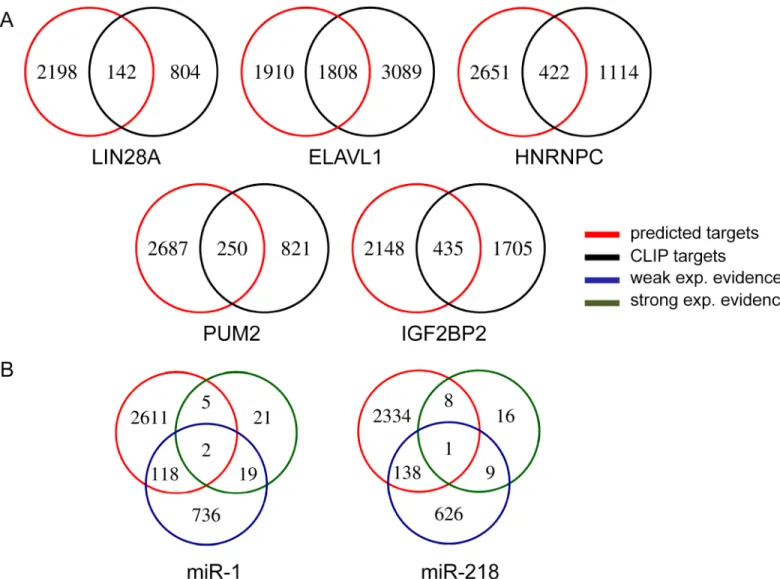
experiment. As such, we could evaluate the target sets of RBPs with CLIP data: LIN28A, ELAVL1, HNRNPC, PUM2 and IGF2BP2. We evaluated the target predictions for our top ranking miRNAs miR-1 and miR-218, by compiling experimentally verified targets (either with strong evidence or weak evidence) from MirTarBase database.Fig 4shows the number of genes that are shared between the set of our predicted targets and the set of experimentally veri-fied targets, for RBPs and miRNAs. We see a high overlap between the two sets for RBPs. In particular, almost 50% of the predicted target genes for ELAVL1 are also CLIP targets. The intersection is much smaller for miRNAs. A similar result has been previously obtained when miRNA target prediction methods were compared based on the number of validated targets in miRTarBase [16].
Next, we utilized a previously published ELAVL1 knockdown dataset that includes genome-wide measurements of transcripts upon ELAVL1 depletion in HEK293 cells [47]. ELAVL1 is known to increase the stability of its targets, so we expect ELAVL1 targets to have decreased expression upon its depletion. InFig 5Awe plot the cumulative distribution of LFCs of the
Fig 4. Intersection of predicted target genes with experimentally verified targets.A. Predicted target gene sets of RBPs are intersected with targets determined with CLIP method. B. Predicted targets of miRNAs are intersected with experimentally verified (with either weak or strong evidence) miRNA targets downloaded from miRTarBase.
following groups of genes: (i) CLIP-derived target genes, (ii) target genes predicted based on our model (predicted targets), (iii) genes that have at least one ELAVL1 motif but that do not appear in groups (i) and (ii) (motif-derived targets), (iv) genes with no ELAVL1 motif (no site). This analysis revealed that our predicted targets have lower LFCs than motif-derived targets and genes with no ELAVL1 site indicating that our predicted target genes are likely to be func-tional targets. Furthermore, we made a similar comparison between these groups based on expression changes of genes across matched tumor-normal samples. Namely, we plot the cumulative distribution of LFCs calculated with edgeR (Fig 5B). We observe that the distribu-tions of LFCs of our predicted target genes and CLIP-derived target genes are close. Since ELAVL1 is upregulated in LUSC (LFC = 0.59), we expect its targets to be upregulated as well. In line with this, our predicted target genes have larger LFCs than the groups (iii) and (iv). Altogether these results support the accuracy of our model in identifying the functional targets of ELAVL1.
Discussion
In this study, we investigated the mechanisms that account for gene expression regulation in LUSC. We initially assessed the alterations in expression of genes that encode for RBPs across a number of cancer types. To our knowledge, this is the first time differentially expressed RBPs are searched using a method that accounts for matched samples across several cancer types (i.e. edgeR). The results of this analysis revealed that several RBPs are differentially expressed with district profiles of up- or down-regulation across the cancers. Having found that the number of differentially expressed RBPs is largest in LUSC, we developed a lasso-regularized regression model to predict gene expression in LUSC by incorporating several features including the regu-lation mediated by RBPs. We were able to accurately predict the expression of genes in
Fig 5. Evaluation of predicted target genes of ELAVL1.A. Cumulative distribution of LFCs of genes upon ELAVL1 depletion in HEK293 cells. B. Cumulative distribution of LFCs that correspond to gene expression changes in tumor samples compared to normal samples.
held-out sets by incorporating a comprehensive set of regulatory elements that are bound by TFs, miRNAs and RBPs, as well as genetic and epigenetic alterations as features in our statisti-cal model. Importantly, compared to other regulatory classes, exclusion of RBPs results in the largest decrease in predictive performance revealing the influence of RBP-mediated regulation. This is one of the key novel observations of the current study that indicates the importance of RBPs in regulation gene expression in LUSC.
Next, we identified key regulators of LUSC by calculating the significance of each feature using a recently proposed statistical test that accounts for the adaptive nature of fitting lasso models. Inference of statistically significant features in adaptive models is an active research area in statistics, and we believe that our study will be instrumental in dissemination of this recent result to bioinformatics community. We found that the majority of the top ranking can-didate regulators are differentially expressed in LUSC, and have been previously identified to be associated with lung cancer. We have also identified additional regulators such as LIN28A and CPEBP4 that were not previously studied in the context of lung cancer. Also, the fact that many of the candidate regulators are RBPs agrees with our previous result on the added predic-tive value of RBPs.
As a follow-up analysis, we utilized our fitted model parameters to identify target genes of candidate regulators. We evaluated our predicted target gene sets by comparing against experi-mentally identified targets. We found that nearly*50% of our predicted ELAVL1 targets
overlap with CLIP-derived target genes. This overlap was relatively smaller for the other regu-lators. A reason for this observation could be the fact that these experiments were performed in other cell types than lung cancer cells. Furthermore, CLIP protocol and the experimental tech-niques that miRTarBase database considers only aim to identify whether the regulator of inter-est physically binds to an mRNA. As such, not all the target genes identified by these
techniques may correspond to functional targets. Our further analysis of ELAVL1 targets by utilizing a genome-wide ELAVL1 knockdown dataset allows us to investigate the functional relationship between ELAVL1 and our predicted targets.
Apart from the results on RBP regulation, our study is also amongst the first to incorporate the recently released JASPAR and TargetScan databases in predicting TF and miRNA binding sites, respectively. Identification of TF and miRNA target sites can become more accurate with the availability of ChiP-Seq and CLIP-seq datasets in lung cells. Similarly, CLIP experiments have been performed for a small number of RBPs, and increase in the number of such experi-ments would improve the definition of RBP target sets. Another possible improvement would be the consideration of alternative polyadenylation (APA) in defining RBP and miRNA sites. Recently developed computational models such as DaPars [48] and GETUTR [49] can perform de novo identification of APA events from standard RNA-seq data. These methods can be used to determine the 3’UTR isoform distribution for each sample (i.e., tumor) separately. Subse-quently, RBP and miRNA sites can be defined for each sample uniquely based on this distribu-tion. Furthermore, RNA secondary structure, which is an important factor for target
recognition of some RBPs, has been ignored in the current study. RNA secondary structure can be considered in the identification of RBP binding sites as more RBPs have characterized ondary structure preferences. Also, recent advances in experimental techniques to query sec-ondary structurein vivo[50,51] promise to generate a more accurate set of mRNA secondary structures compared to the computational prediction methods.
Lung cancer is one of the most difficult cancers to treat. Recently developed molecular ther-apies can be targeted to adenocarcinoma of the lung [53]. Such a treatment has not been pro-posed for squamous cell carcinoma yet. Therefore, identification of novel therapeutic agents is vital for this cancer type. Here, we applied our novel statistical model to infer gene regulatory mechanisms in LUSC, and identified a number of candidate regulators including RBPs. Further studies of these candidate regulators will provide insights into the molecular mechanisms of cancer development in LUSC.
Supporting Information
S1 Table. Summary of analyzed TCGA cancer types and datasets.This table lists the abbrevi-ations and full names of the analyzed cancer types together with the corresponding number of total and paired samples downloaded from TCGA database.
(PDF)
S2 Table. List of the features that are merged.Features that have identical count vector across the genes have been merged to a single factor before input to the regression.
(XLSX)
S3 Table. Differential expression of RBPs across the 13 cancer types.This table contains the log fold changes and the corresponding FDR-corrected p-values for RBPs (plotted inFig 2). (XLSX)
S4 Table. Comparison of models.This table displays the Spearman correlation coefficient of the full model and the five partial models where one feature group is removed. P-values indi-cate the significance of the difference between models (Wilcoxon sign-rank test).
(PDF)
S5 Table. List of all candidate regulators.Full list of the names, types and LFCs of candidate regulators are displayed.
(XLSX)
Acknowledgments
This work was supported by The Scientific and Technological Research Council of Turkey [113E159 to H.K.] and European Union Marie Curie Career Integration Grant [631986 to H. K.].
Author Contributions
Conceived and designed the experiments: AL HK. Performed the experiments: AL. Analyzed the data: AL HK. Wrote the paper: AL HK.
References
1. Baltz AG, Munschauer M, Schwanhausser B, Vasile A, Murakawa Y, Schueler M, et al. The mRNA-bound proteome and its global occupancy profile on protein-coding transcripts. Mol Cell. 2012; 46: 674–690. doi:10.1016/j.molcel.2012.05.021PMID:22681889
2. Castello A, Fischer B, Eichelbaum K, Horos R, Beckmann BM, Strein C, et al. Insights into RNA Biology from an atlas of mammalian mRNA-binding proteins. Cell. 2012; 149(6): 1393–1406. doi:10.1016/j.cell. 2012.04.031PMID:22658674
4. Ray D, Kazan H, Cook KB, Weirauch MT, Najafabadi HS, Li X, et al. A compendium of RNA-binding motifs for decoding gene regulation. Nature. 2013; 499: 172–177. doi:10.1038/nature12311PMID: 23846655
5. Kim MY, Hur J, Jeong S. Emerging roles of RNA and RNA-binding protein network in cancer cells. BMB Rep. 2009; 42(3): 125–30. doi:10.5483/BMBRep.2009.42.3.125PMID:19335997
6. Bielli P, Busa R, Paronetto MP, Sette C. The RNA-binding protein Sam68 is a multifunctional player in human cancer. Endocrine-Related Cancers. 2011; 18(4): R91–R102. doi:10.1530/ERC-11-0041
7. Liao WT, Liu JL, Wang ZG, Cui YM, Shi L, Li TT, et al. High expression level and nuclear localization of Sam68 are associated with progression and poor prognosis in colorectal cancer. BMC Gastroenterol. 2013; 13: 126. doi:10.1186/1471-230X-13-126PMID:23937454
8. Frisone P, Pradella D, Di Matteo A, belloni E, Ghigna C, Paronetto MP. SAM68: signal transduction and RNA metabolism in human cancer. BioMed Research International. 2015; 2015: 14. doi:10.1155/2015/ 528954
9. Abdelmohsen K, Gorospe M. Posttranscriptional regulation of cancer traits by HuR. Wiley Interdisciplin-ary Reviews. 2011; 1(2):214–229. doi:10.1002/wrna.4
10. Wang J, Guo Y, Chu H, Guan Y, Bi J, Wang B. Multiple functions of the RNA-binding protein HuR in cancer progression, treatment responses and prognosis. Int J Mol Sci. 2013; 14(5): 10015–41. doi:10. 3390/ijms140510015PMID:23665903
11. Bergalet J, Fawal M, Lopez C. HuR-Mediated control of C/EBPbeta mRNA stability and translation in ALK-Positive anaplastic large cell lymphomas. Molecular Cancer Research. 2011; 9(4): 485–496. doi: 10.1158/1541-7786.MCR-10-0351PMID:21343335
12. Bolognani F, Gallani AI, Sokol L. mRNA stability alterations mediated by HuR are necessary to sustain the fast growth of glioma cells. Journal of Neuro-Oncology. 2012; 106(3): 531–542. doi:10.1007/ s11060-011-0707-1PMID:21935689
13. Qian J, Hassanein M, Hoeksema MD, Harris BK, Zou Y, Chen H, et al. The RNA binding protein FXR1 is a new driver in the 3q26-29 amplicon and predicts poor prognosis in human cancers. Proc Natl Acad Sci U S A. 2012; 106(3): 3469–74.
14. Setty M, Helmy K, Khan AA, Silber J, Arvey A, Neezen F, et al. Inferring transcriptional and microRNA-mediated regulatory programs in glioblastoma. Mol Syst Biol. 2012; 8(605). doi:10.1038/msb.2012.37 PMID:22929615
15. Jacobsen A, Silber J, Harinath G, Huse JT, Schultz N, Sander C. Analysis of microRNA-target interac-tions across diverse cancer types. Nature Structural and Molecular Biology. 2013; 20: 1325–32. doi: 10.1038/nsmb.2678PMID:24096364
16. Li Y, Liang M, Zhang Z. Regression analysis of combined gene expression regulation in acute myeloid leukemia. PLoS Comput Biol. 2014; 10(10): e1003908. doi:10.1371/journal.pcbi.1003908PMID: 25340776
17. The Cancer Genome Atlas Research Network (2011) TCGA data portal;. Accessed: 2014-09-30. https://tcga-data.nci.nih.gov/tcga/.
18. Human Protein Atlas;. Accessed: 2014-12-30.http://www.proteinatlas.org.
19. Ponten F, Schwenk JM, Asplund A, Edqvist PHD. The Human Protein Atlas as a proteomic resource for biomarker discovery. J of Internal Medicine. 2011; 270(5): 428–441. doi:10.1111/j.1365-2796.2011. 02427.x
20. Anders S, McCarthy DJ, Chen Y, Okoniewski M, Smyth GK, Huber W, et al. Count-based differential expression analysis of RNA sequencing data using R and Bioconductor. Nat Protoc. 2013; 8(9): 1765– 86. doi:10.1038/nprot.2013.099PMID:23975260
21. Robinson M, McCarthy D, Smyth G. a Bioconductor package for differential expression analysis of digi-tal gene expression data. Bioinformatics. 2010; 26(1): 139–40. doi:10.1093/bioinformatics/btp616 PMID:19910308
22. Mathelier A, Fornes O, Arenillas D, Chen C, Denay G, Lee J, et al. a major expansion and update of the open-access database of transcription factor binding profiles. Nucleic Acids Res. 2016; 44(D1): D110– 5. doi:10.1093/nar/gkv1176PMID:26531826
23. Grant C, Bailey T, Noble W. scanning for occurrences of a given motif. Bioinformatics. 2011; 27(7): 1017–8. doi:10.1093/bioinformatics/btr064PMID:21330290
24. Consortium EP. A user’s guide to the encyclopedia of DNA elements (ENCODE). PLoS Biol. 2011; 9 (4): e1001046. doi:10.1371/journal.pbio.1001046
26. Nam J, Rissland O, Koppstein D, Abreu-Goodger C, Jan C, Agarwal V, et al. Global analyses of the effect of different cellular contexts on microRNA targeting. Mol Cell. 2014; 53(6): 1031–43. doi:10. 1016/j.molcel.2014.02.013PMID:24631284
27. Cook KB, Kazan H, Zuberi K, Morris Q, Hughes TR. RBPDB: a database of RNA-binding specificities. Nucleic Acids Res. 2011; 39(suppl 1): D301–D308. doi:10.1093/nar/gkq1069PMID:21036867
28. Jun-Hao L, Shun L, Hui Z, Liang-Hu Q, Jian-Hua Y. starBase v2.0: decoding ceRNA, miRNA-ncRNA and protein?RNA interaction networks from large-scale CLIP-Seq data. Nucleic Acids Res. 2013; 42(D1): 2380–8.
29. Friedersdorf MB, Keene JD. Advancing the functional utility of PAR-CLIP by quantifying background binding to mRNAs and lncRNAs. Genome Biol. 2014; 15: R2. doi:10.1186/gb-2014-15-1-r2PMID: 24393468
30. Hsu SD, Tseng YT, Shrestha S, Lin YL, Khaleel A, Chou CH, et al. miRTarBase update 2014: an infor-mation resource for experimentally validated miRNA-target interactions. Nucleic Acids Res. 2014; 42: D78–85. doi:10.1093/nar/gkt1266PMID:24304892
31. Wurth L. Versatility of RNA-binding proteins in cancer. Comp Func Genomics. 2012; doi:10.1155/ 2012/178525
32. Kim GY, Lim S, Kim YW. Expression of HuR, COX-2, and survivin in lung cancers; cytoplasmic HuR stabilizes cyclooxygenase-2 in squamous cell carcinomas. Modern Pathology. 2011; 24: 1336–1347. doi:10.1038/modpathol.2011.90PMID:21572400
33. Bell JL, Wachter K, Muchleck B, Pazaitis N, Kohn M, Lederer M, et al. Insulin-like growth factor 2 mRNA binding proteins (IGF2BPs):post-transcriptional drivers of cancer progression? Cell Mol Life Sci. 2013; 70: 2657–2675. doi:10.1007/s00018-012-1186-zPMID:23069990
34. Akbani R, Ng PK, Werner HMJ, Shahmoradgoli M, Zhang F, Ju Z, et al. A pan-cancer proteomic per-spective on The Cancer Genome Atlas. Nat Comm. 2014; 5 (3887).
35. Friedman J, Tibshirani R, Hastie T. Regularization paths for generalized linear models via coordinate descent. J Stat Softw. 2010; 33: 1–22. doi:10.18637/jss.v033.i01PMID:20808728
36. Lockhart R, Taylor J, Tibshirani RJ, Tibshirani R. A significance test for the lasso. Ann Statist. 2014; 42 (2): 413–468. doi:10.1214/14-AOS1175REJ
37. Taylor J, Tibshirani RJ. Statistical learning and selective inference. PNAS. 2015; 112(25): 7629–7634. doi:10.1073/pnas.1507583112PMID:26100887
38. Piskounova E, Polytarchou C, Thornton JE, Hagan JP, LaPierre RJ, Pothoulakis C, et al. Oncogenic Lin28A and Lin28B inhibit let-7 microRNA biogenesis by distinct mechanisms. Cell. 2011; 147(5): 1066–1079. doi:10.1016/j.cell.2011.10.039PMID:22118463
39. Wang J, Wang B, Bi J, Zhang C. Cytoplasmic HuR expression correlates with angiogenesis, lymphan-giogenesis, and poor outcome in lung cancer. Med Oncol. 2011; 28: S577–S585. doi: 10.1007/s12032-010-9734-6PMID:21046284
40. Ji Q, Zhang L, Liu X, Zhou L, Wang W, Han Z, et al. Long non-coding RNA MALAT1 promotes tumour growth and metastasis in colorectal cancer through binding to SFPQ and releasing oncogene PTBP2 from SFPQ/PTBP2 complex. Br J Cancer. 2014; 111: 736–748. doi:10.1038/bjc.2014.383PMID: 25025966
41. Ji P, Diederichs S, Wang W, Boing S, Metzger R, Schneider PM, et al. MALAT-1, a novel noncoding RNA, and thymosin beta4 predict metastasis and survival in early-stage non-small cell lung cancer. Oncogene. 2003; 22(39): 8031–8041. doi:10.1038/sj.onc.1206928PMID:12970751
42. Gutschner T, Hammerle M, Eissmann M, Hsu J, Kim Y, Hung G, et al. The noncoding RNA MALAT1 is a critical regulator of the metastasis phenotype of lung cancer cells. Cancer Res. 2013; 73(3): 1180– 1189. doi:10.1158/0008-5472.CAN-12-2850PMID:23243023
43. Castellano G, Torrisi E, Ligresti G, G M, Militello L, Russo AE, et al. The involvement of the transcription factor Yin Yang 1 in cancer development and progression. Cell Cycle. 2009; 8(9): 1367–1372. doi:10. 4161/cc.8.9.8314PMID:19342874
44. Wan M, Huang W, Kute TE, Miller LD, Zhang Q, Hatcher H, et al. Yin Yang 1 plays an essential role in breast cancer and negatively regulates p27. Am J Pathol. 2012; 180(5): 2120–2133. doi:10.1016/j. ajpath.2012.01.037PMID:22440256
45. Mataki H, Enokida H, Chiyomaru T, Mizuno K, Matsushita R, Goto Y, et al. Downregulation of the micro-RNA-1/133a cluster enhances cancer cell migration and invasion in lung-squamous cell carcinoma via regulation of Coronin1C. J Hum Genet. 2015; 53–61: 2120–2133.
47. Mukherjee N, Corcoran DL, Nusbaum JD, Reid DW, Georgiev S, Hafner M, et al. Integrative regulatory mapping indicates that the RNA-binding protein HuR couples pre-mRNA processing and mRNA stabil-ity. Mol Cell. 2011; 43(3): 327–339. doi:10.1016/j.molcel.2011.06.007PMID:21723170
48. Xia Z, Donehower LA, Cooper TA, Neilson JR, Wheeler DA, Wagner EJ, et al. Dynamic analyses of alternative polyadenylation from RNA-seq reveal a 3-UTR landscape across seven tumour types. Nat Comm. 2014; 5: 5274. doi:10.1038/ncomms6274
49. Kim M, You B, Nam J. Global estimation of the 3’untranslated region landscape using RNA sequenc-ing. Methods. 2015; 83: 111–117. doi:10.1016/j.ymeth.2015.04.011PMID:25899044
50. Rouskin S, Zubradt M, Washietl S, Kellis M, Weissman JS. Genome-wide probing of RNA structure reveals active unfolding of mRNA structures in vivo. Nature. 2014; 505: 701–705. doi:10.1038/ nature12894PMID:24336214
51. Spitale RC, Flynn RA, Zhang QC, Crisalli P, Lee B, Jung J, et al. Structural imprints in vivo decode RNA regulatory mechanisms. Nature. 2015; 519: 486–490. doi:10.1038/nature14263PMID:25799993
52. Ho JJ, Marsden PA. Competition and collaboration between RNA-binding proteins and microRNAs. Wiley Interdiscip Rev RNA. 2014; 5(1): 69–86. doi:10.1002/wrna.1197PMID:24124109
![Fig 1. Differentially expressed RBPs in cancer. This heatmap shows the log fold expression changes of RBPs across matched tumor- tumor-normal samples (calculated with edgeR [21])](https://thumb-eu.123doks.com/thumbv2/123dok_br/18428434.361834/5.918.138.850.254.865/differentially-expressed-heatmap-expression-changes-matched-samples-calculated.webp)