Article
Printed in Brazil - ©2011 Sociedade Brasileira de Química0103 - 5053 $6.00+0.00
A
*e-mail: [email protected]
A Monte Carlo Revisiting of N-Methylformamide and Acetone
Glauco G. Almeida and João M. M. Cordeiro*
Departamento de Física e Química, Universidade Estadual Paulista, Av. Brasil, 56, 15385-000 Ilha Solteira-SP, Brazil
Os líquidos N-metilformamida e acetona foram revisitados através de simulações Monte Carlo feitas no ensemble NPT, a 1 atm e 25 °C. As moléculas são rígidas com todos os átomos explicitados e o potencial intermolecular utilizado é o clássico 6-12 Lennard-Jones mais Coulomb. Os g(r)’s teóricos dos dois líquidos foram comparados com aqueles obtidos através de difratometria de nêutrons e simulação de refinamento de estrutura. Os resultados indicam a existência de ligações de hidrogênio determinando a estrutura da N-metilformamida, enquanto que na acetona as correlações são orientadas pelo momento dipolar. A estrutura do líquido N-metilformamida é guiada por um dímero preponderante, no qual as moléculas estão posicionadas de maneira que o ângulo entre os vetores de dipolo é 73°, enquanto que no líquido acetona, que é muito menos organizado, a orientação dos dipolos das moléculas muda de antiparalela a curtas distâncias para mais paralela à medida que a distância aumenta.
The pure liquids N-methylformamide and acetone have been revisited via Monte Carlo simulations in the NTP ensemble at 1 atm and 25 °C. The molecules are all-atom rigid structures, and the intermolecular potential used is the classical 6-12 Lennard-Jones plus Coulomb. The theoretical g(r)s of both liquids were compared with those obtained from neutron diffraction and empirical potential structure refinement simulations. The results point to the existence of H-bonds driving the N-methylformamide structure, while in acetone the correlations are dipole moment oriented. The structure of the liquid N-methylformamide is mainly guided by a dimer whose molecules are arranged in such a way that the angle between their dipole moments is 73°, while liquid acetone is much less organized and the orientation of the molecules changes from an antiparallel dipolar correlation at short distances to more parallel alignments of the molecular dipole moments for larger distances.
Keywords: Monte Carlo, acetone, N-methylformamide, hydrogen bonds, liquid structure
Introduction
N-methylformamide (NMF) and acetone (ACT) belong to a group of dipolar organic solvents, which are common media for a variety of important chemical reactions. Table 1 shows some of the most common physical-chemistry properties of the liquids to give an idea of the differences. NMF is one of the simplest molecules among those that include a peptide bond in their structure. The molecule has long been of great interest because of the presence of that structure as a repeat unit in proteins and peptides. The liquid, either pure or as a component of
mixtures, has been the subject of studies, theoretically2-10
as well as experimentally.11-18 The NMF molecules act
as proton donors and acceptors via their C=O and H–N
groups and consequently form C=O···H–N hydrogen
bonds (H-bond) with each other, the same type of H-bond that is known to play an important role in stabilizing the ordered intramolecular structure of peptides and
proteins.19 Moreover, these molecules could also form
weak C−H···O=C H-bonds, which might be important in
stabilizing many systems, as extensively reported.20 In the
pure liquid, molecules are hydrogen bonded to each other, leading to the formation of molecular chains throughout
the liquid bulk,13 which must be in the origin of the large
values of its properties (see Table 1).
Pure liquid ACT and some of its mixtures with other liquids have received a great deal of attention by diffraction
as well as computational simulation.21-33 ACT has a
triangular planar shape (C2v geometry) with the central
of the properties listed in Table 1. The dipole interaction among the molecules plays an important role in the liquid structure. The liquid shows a predominance of antiparallel alignments of molecular dipole moments at short distances, while at larger distances the alignments become more parallel, and the molecules adopt more of a head-to-tail
configuration.24,33 The C=O group acts as a proton acceptor,
rendering the H-bond formation with proton donor
molecules possible, and the two CH3 groups can originate
hydrophobic effects when in aqueous solution.21
Studying enzymatic stability and activity in non-aqueous medium is very important due to the substantial implications regarding basic enzyme science, and because
of the wide range of potential applications.34,35 Experiments
show that proteins are able to maintain their structure in
many organic solvents and remain catalytically active.36-38
Thus, enzymology in non-aqueous media has received much attention, and many of the influences to the behavior
of enzymes in nonaqueous solvents are now known.39-45
Notwithstanding, as this is a new field of study, many points remain to be clarified concerning the molecular events occurring in enzymes when performing catalysis under non-aqueous conditions.
Experimental structural investigations of proteins
dissolved in organic solvents are generally difficult.46
Molecular simulation methods are powerful tools for investigating molecular interactions, reaction mechanisms, and dynamics of molecular solvation. In the case of enzymes, however, it is difficult to start by looking into the real systems, due to the great computational effort required
to simulate such a system.47 Therefore, computationally
simpler systems are commonly used in order to investigate a particular feature of an interesting system, and the acquired knowledge is extended to the actual system. That is the motivation behind the investigation of the liquids NMF and ACT. The first is a good model for the peptide bond in peptides and proteins and the second an interesting organic solvent to investigate enzymatic activity in non-aqueous media. The mixture of the two liquids may be investigated in the future; however, to obtain detailed understanding of the role of a liquid in different chemical systems and environments, modeling the pure solvent and studying its structure are essential.
The problem of extracting reliable structural information about molecular arrangement and orientation experimentally in relatively simple molecular fluids such
as the present examples is well known.48 Computational
simulations are very useful techniques for studying the structure of molecular liquids since detailed radial distribution functions (rdf) of the liquids can be obtained. The insights given by site-site correlation functions calculated by computer simulations can be very useful in interpreting the liquid structure, because of the presence of many scattering centers in polyatomic molecules as well as in the neighborhood of molecules in the condensed
phase,49-51 making the experimental study of the liquid
structure difficult.
Molecular dynamics and Monte Carlo simulations52
have been widely used to investigate the properties of liquids. Knowledge about the structure, solvent effects, making and breaking structure effects, H-bonds and other details of the liquids have emerged from these studies. In the present paper, the results obtained with Monte Carlo simulations for both liquids were analyzed. The theoretical g(r)s obtained in this work were compared with those obtained from neutron diffraction with isotopic
substitution experiments53-57 using an empirical potential
structure refinement (EPSR) approach.58-62 EPSR is capable
of filling in the gaps of missing structural information by imposing reasonable constraints on atomic overlap and on the likely molecular geometries. By comparing the empirical potential and the data directly in the reciprocal space of the measurements, one has the best chance of avoiding the spurious structures and conclusions that might be generated by systematic effects in the data (such as inelasticity effects with neutron scattering or Compton
scattering with X-rays).33
Methodology
Molecular models and intermolecular potential function
Optimized potentials for liquid simulations (OPLS-AA) type potentials were used for ACT and NMF. The NMF
parameters were optimized in our laboratory,13 and the ACT
parameters were those optimized by Ferrario et al.23 Table 2
Table 1. Experimental values of some properties of the studied liquids
Liquid ε µ / D BP / °C ∆vapH / (kcal mol-1) ∆vapS / cal (mol K)-1 ρ / (g cm-3)
NMF 182 3.86 199.5 13.77 29.13 1.00
ACT 20.7 2.88 56.5 7.40 22.45 0.78
shows the potential parameters for each one. The molecular
geometries used were those reported previously.13,33 Both
liquids were simulated as rigid molecules; therefore, contributions from intramolecular relaxation effects were not considered, an approach customarily used in simulations of molecular liquids.
Following the usual procedures in force field calculations, the molecules were modeled with collections
of interacting sites and the energy Eab between molecules a
and b, represented by the sum of the Coulomb and Lennard
Jones potentials centered on the sites:
, (1)
where rij is the distance between site i in a and site j in b
and qi and qj are fractional charges located in the i and j molecular sites. For each site k, the parameters Akk and
Bkk were given by Akk= 4εkσk12 and Bkk= 4εkσk6, where
εk and σk are the Lennard-Jones parameters for the kth
site. Parameters Aij and Bij for non-diagonal interactions
[i,j] were obtained using the geometric combining rules Aij = (Aii Ajj)1/2 and Bij = ( Bii Bjj)1/2.52
Monte Carlo simulations
The simulations were carried out in the NPT ensemble
at 298 K and 1 atm, with Metropolis importance sampling
and periodic boundary conditions63 on systems consisting
of a cubic box containing 400 molecules. In calculating
the total configurational energy using equation 1, a full intermolecular interaction was considered whenever the rij site-to-site distance was inside a cutoff radius of 11 Å. Lennard-Jones potential contributions due to interactions beyond the cutoff radius were calculated using the
formalism presented elsewhere.52 Several methods have
been used to take into account long-range Coulombic interactions. In the present calculations, these interactions were not considered beyond the cutoff radius. The reasons
supporting this decision have been discussed previously.64,65
Such an approach is further justified taking into account that the molecular potential parameters are effective pair potentials, optimized at the same computational conditions of the simulations themselves. Therefore, they are a kind of mean force parameter that carries out information on Coulombic long-range corrections, many-body effects, molecule polarization and so on. In good agreement with this approach, the site-site pair correlations, thermodynamic properties and single particle dynamics of polar liquids have been reported to be quite insensitive to the long-range
forces in the system.66
Starting from the initial distribution of molecules in the central box, new configurations were generated by randomly translating and rotating a randomly chosen molecule along Cartesian co-ordinates. As the calculations were carried out in the NPT ensemble, new configurations were also generated through volume changes. A volume movement was tried on every 500th attempted molecular move. After the volume changes, the coordinates of the center of the mass of all molecules in the reference box
were scaled in the usual way.52 Ranges for translating and
rotating the molecules and for volume moves were adjusted to yield an acceptance/trial ratio between 0.40 and 0.45 for new configurations. Each calculation started with an
equilibration phase with 2.4 × 10⁷ configurations, and the
averages were then obtained after a new segment with
other 2.4 × 10⁷ configurations. Statistical uncertainties were
calculated from separate averages over blocks of 2.0 × 10⁵
configurations.
Results and Discussion
N-Methylformamide
To analyze the data, g(r) curves for some of the NMF site-site correlations obtained in the present work are plotted in Figure 1, and compared to the same plots obtained from the neutron diffraction with isotopic substitution and
EPSR simulations, reported previously.13 A comparison
of the curves clearly indicates that the NMF model used in the present simulations has a great ability to reproduce
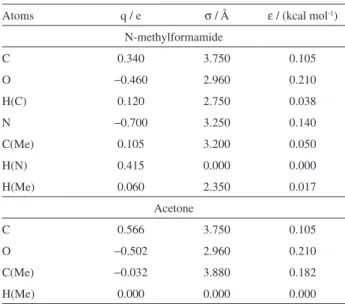
Table 2. Intermolecular potential parameters for the molecules studied in this work
Atoms q / e σ / Å ε / (kcal mol-1) N-methylformamide
C 0.340 3.750 0.105
O −0.460 2.960 0.210
H(C) 0.120 2.750 0.038
N −0.700 3.250 0.140
C(Me) 0.105 3.200 0.050
H(N) 0.415 0.000 0.000
H(Me) 0.060 2.350 0.017
Acetone
C 0.566 3.750 0.105
O −0.502 2.960 0.210
C(Me) −0.032 3.880 0.182
the structure of the liquid, even though the experimental results show that in the liquid the atoms are, in fact, a little closer together than in the model. However, the differences are, for all practical purposes, negligible. Although EPSR provides a model that is consistent with the measured diffraction data, it does not necessarily provide the only
possible interpretation of the experimental data.50,51,56 Thus,
obtaining a fit to the measured data does not ensure the potential model is correct, but it is a necessary condition for any chosen potential model of the liquid. However, the theoretical values obtained for the enthalpy of vaporization and the density of the liquid show a good agreement with the experimental values (the theoretical values obtained in
the simulations are, respectively, 13.72 ± 0.01 kcal mol-1 and
1.000 ± 0.007 g cm-3), showing that the theoretical model
not only is able to give a reasonable average distribution of the molecules but also represents the interactions between them with a good approximation.
As already discussed, the peaks are sharp and well
defined at relatively low values of r, which suggests that the
NMF is highly ordered in the liquid phase.13 The presence
of the narrow peak of the O–H(N) correlations at about 1.8 Å is a strong indication of H-bond linkage between the molecules. Moreover, the peak of the O–N correlation at about 2.8 Å points to an alignment of the O–H(N)–N atoms (since the H(N)–N bond has a length of about 0.96 Å), another result suggesting H-bonding between the molecules, according to criteria widely used in the study
of H-bonds.19
Thus, taking into account that from the point of view of the g(r) plots the model is able to reproduce the structure of the liquid, one may use the liquid simulations to further explore the intermolecular interactions. As a starting point, the pair energy distribution along the simulation pathway
for the intermolecular correlations was calculated, and the results are shown in Figure 2.
At first glance, the pairwise energy is significantly more negative than for other organic polar liquids, as for instance
ethanol,63 and the bimodal shape of the curve is characteristic
of liquids with H-bonding between the molecules, as
previously noticed19,67 (the comparison with the curve
obtained for acetone, shown later, will better illustrate this point). Thus, there are preponderantly two kinds of molecular correlation, molecules that are hydrogen-bonded to each other and molecules that are correlated through another kind of interaction. This finding points to a well-structured liquid. As the simulated molecular interactions are pairwise interactions, the simulation box was scanned for the most statistically representative dimer in the liquid. Figure 3 shows the species found. Some geometric parameters of that dimer are listed in the figure caption.
The remarkable agreement between the site-site distances obtained for the dimer and the positions of the corresponding peaks in the g(r) plots (Figure 1) implies that the population of that dimer must be significantly high in the
Figure 1. Site-site radial distribution functions derived with EPSR calculations (lines) and Monte Carlo simulations (circles) for NMF. H(N) is the hydrogen bonded to nitrogen, and C(Me) is the methyl carbon.
Figure 2. Pair energy distributions derived by the simulation for the NMF molecules in the liquid.
liquid. Moreover, the values obtained for the O···H distance and the N–H···O angle show a straight agreement with those values usually accepted as characterizing hydrogen
bonding: O···H distance in the range ca. 1.2-2.2 Å and the
N–H···O angle in the range ca. 130°-180°.19 Taking into
account these results, the scenario that emerges is that of a liquid with molecules hydrogen bonded to each other, in agreement with what has already been reported before,
achieved through other approaches.13
The distance O···H(C=) is 3.44 Å, which allows this interaction to be attributed to a weak H-bond, according
to criteria widely discussed previously.20 As has been
discussed previously,20 this interaction plays an important
role in the structure of many biomolecules. Those findings suggest that this interaction might play a significant role in stabilizing the dimer in particular and consequently be important for the liquid structure as a whole. Some
aspects of the structure of this dimer, exploited via ab initio
calculations, have been discussed in a previous paper.9
For a more detailed view of the liquids structure, the molecular dipole-dipole correlation between the molecules was calculated and the <cos θ> (where θ is the angle between
the molecular dipole moments of the two molecules under consideration) plotted as a function of the distance between the molecules. For the sake of clarity, Figure 4 shows the molecular geometry of both molecules under investigation with the molecular dipole moments drawn on it.
In Figure 5, the plot of the <cos θ> is shown as a
function of the distance between the molecules for NMF. To obtain that, in the computational routine we have to choose an atom in the molecule, as a function of which the distance between the molecules will be computed.
Note that the dipolar correlation follows a pattern that agrees remarkably with the C–C correlations in the g(r) plots (Figure 1); there is a strong dipolar correlation for C–C distances in the range of about 3-5 Å, with the molecules oriented in such a way that the molecular dipoles have an angle of about 73° with each other. There is agreement between this angle and the angle between the molecules
of the dimer shown in Figure 3. However, as pointed out
previously,63 the curve shows a bimodal shape, the same
pattern also observed for the pair distribution energy shown in Figure 2, which is a characteristic of H-bonding liquids. At larger distances, the molecules adopt more of a perpendicular configuration.
Acetone
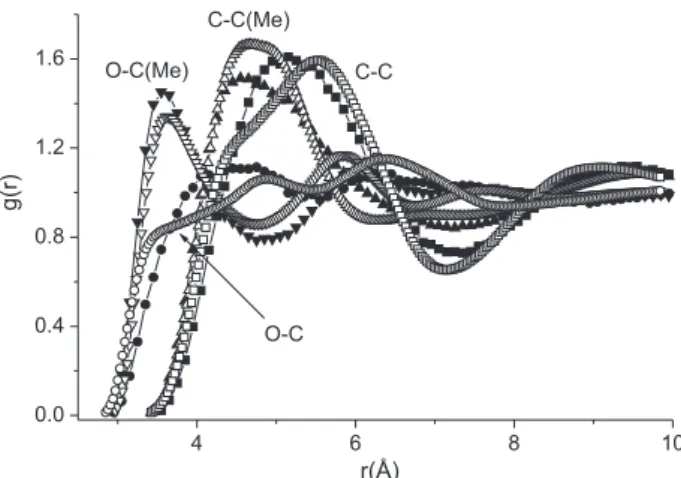
In this section, the paper will follow the same general presentation as for NMF. As the first step, g(r) curves for some of the ACT site-site correlations obtained in the present work are plotted in Figure 6, and compared to the same plots obtained from the neutron diffraction with
isotopic substitution studies, reported previously.33
The agreement between the experimental and the theoretical results does not have the same quality as that shown by the NMF theoretical model, but on average, the agreement is satisfactory. The theoretical model fails to represent the finer structure of the liquid, responsible for the shoulders verified in the experimental curves; however, the differences are sufficiently negligible to expect that the results obtained from the simulations might be in good agreement with the liquid behavior. The discussion of NMF concerning the limitations of the EPSR simulation in giving the correct structure of the liquids should be remembered. In agreement with what was discussed there, the theoretical values obtained for the liquid density and
the heat of vaporization are 0.776 ± 0.006 g cm-3 and
7.74 ± 0.01 kcal mol-1, respectively).
Thus, considering that the model is able to reproduce the structure of the liquid in a good approximation, the simulations are useful for further exploring intermolecular interactions. As was done above, let us start by analyzing
Figure 4. The molecular geometry for NMF (left) and ACT (right), with
the molecular dipole moment drawn on the molecules (blue arrow).
the pair energy distribution along the simulation pathway for the intermolecular correlations; the results are shown in Figure 7. The energy distribution is narrower and the most stable molecular correlations are not as attractive as for NMF, since the interaction energy in ACT is less negative. The humps on the left slope suggest that the molecules are correlated through the liquid bulk in somewhat different ways, which directly agrees with the characteristics of the bands seen in the g(r) plots (Figure 6).
The results strongly suggest a not very highly ordered liquid. The lack of any band in the range of energies below
−4 kcal mol-1 should be noted, in contrast to what was
observed for the NMF case. Due to this behavior, scanning
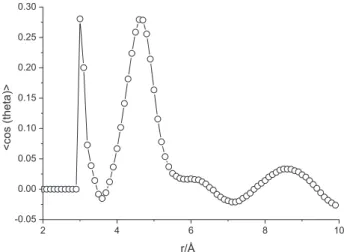
the simulation box for the most representative dimers is not suitable, since there would be no strongly predominant dimer in the liquid but rather a collection of randomly distributed dimers. That behavior is clearly reflected in the form of the curve of the dipole-dipole correlation between the molecules as a function of the C–C distance shown in Figure 8 (see Figure 4 for an idea of the molecular dipole position). A much broader band than that presented by NMF can be observed, a clear consequence of the spread in the molecular correlations. Thus, instead of looking for the most representative dimer in the liquid, we looked for representative dimers constraining the C–C distances to well-defined short ranges. Six dimers were collected, one for each of the ranges shown in Table 3, with the respective angle between the dipole moment for each one. For the sake of illustration, Figure 9 shows the drawings of the first 4 of those dimers.
The data analysis shows that the molecules get an antiparallel dipolar correlation at short distances, while when the distance between the molecules is enlarged they tend more to parallel alignments of the molecular dipole
Figure 6. Site-site radial distribution functions derived by the EPSR
calculations (empty) and by Monte Carlo simulations (fill) for ACT. C(Me) is the methyl carbon.
Figure 7. Pair energy distributions derived by the simulation for the ACT molecules in the liquid.
Figure 8. Average dipole-dipole correlation as a function of the carbon-carbon distance. Theta is the angle between the dipole moments of the two ACT molecules considered.
Figure 9. Geometries of ACT dimers as a function of the C-C distance.
Dimers a, b, c, and d correspond to the C-C distances listed in the four right columns of Table 3, respectively. Molecules drawn with Jmol.68
Table 3. Angles between the dipole moments for the ACT-ACT dimers obtained from the simulations at the C–C distances
Distance / Å 4-5 4.5-5.5 5-6 5.5-6.5 6-7 6.5-7.5
moments. This behavior is characteristic of liquids in which the molecular correlation is dipole orientated. That
is exactly the behavior found with neutron diffraction,33
and this agreement is a consequence of the ability of the molecular model to represent the liquid structure.
Conclusions
The structure of the liquids NMF and ACT has been revisited via Monte Carlo simulations in the NPT ensemble. The liquids are popular solvents for many organic processes; moreover, NMF has been of great interest due to the presence of the peptide bond in its structure. Thus, detailing the structure of these liquids is useful for studying the behavior of the peptides in non-aqueous medium. Both liquids were simulated through an all-atom OPLS type potential. As the first step, the theoretical g(r)s of the liquids were compared with those obtained from neutron diffraction and EPSR simulations to estimate the quality of the empirical potentials used. The comparison shows a good agreement between the theoretical and the experimental results indicating that the molecular models are quite able to mimic liquid behavior. The results point to the important role played by the H-bonds driving the NMF liquid structure, while in ACT the correlations are dipole moment oriented. Accordingly, the calculated intermolecular interaction energy is much more negative in NMF than in ACT. This scenario shows a perfect agreement with the liquid properties listed in Table 1. The structure of the liquid NMF is highly ordered and is preponderantly oriented by a dimer, whose molecules are arranged in such a way that the angle between its dipole moments is 73°. All these results can be useful or must be considered when analyzing the H-bonds formation between residues in peptides and the behavior of those H-bonds in different solvents. ACT, on the other hand, is much less organized, and the orientation of the molecules through the liquid changes from an antiparallel dipolar correlation at short distances to a more parallel alignment of the molecular dipole moments at larger distances. As emphasized in the discussions, the calculated intermolecular interaction energy is much less negative in ACT than it is in NMF, which clearly agrees with the properties reported for the liquid. Since the acetone molecules are weakly correlated with each other but acetone is an H-bond acceptor, it can be a good solvent for H-bond donors, such as NMF. Solvent effects must play an important role in this type of solution.
Acknowledgments
The authors are very grateful to Sylvia E. McLain for kindly providing the experimental acetone g(r) data. J. M.
M. C. is particularly grateful to FAPESP (Fundação de Amparo à Pesquisa do Estado de São Paulo, Brazil), for supporting a stay at RAL-ISIS (process No. 2007/07513-2).
References
1. Lide, D. R.; Handbook of Chemistry and Physics, 83rd ed.;
Wiley: New York, 2002.
2. Gao, J.; Pavelites, J. J.; Habibollazadeh, D.; J. Phys. Chem. A 1996, 100, 2689.
3. Hirst, J. D.; Hirst, D. M.; Brooks, C. L.; J. Phys. Chem. A1997,
101, 4821.
4. Desfrancois, C.; Periquet, V.; Carles, S.; Schermann, J.P.; Smith, D. M. A.; Adamowicz, L.; J. Chem. Phys.1999, 110, 4309.
5. Torii, H.; Tasumi, M.; J. Phys. Chem. A2000, 104, 4174. 6. Headley, A. D.; Nam, J.; THEOCHEM 2002, 589, 423.
7. Nandini, G.; Sathyanarayana, D. N.; THEOCHEM 2002,
579, 1.
8. Martinez, A. G.; Vilar, E. T.; Fraile, A. G.; Martinez-Ruiz, P.;
J. Phys. Chem. A2002, 106, 4942.
9. Cordeiro, J. M. M.; Cordeiro, M. A. M.; Bosso, A. R. S. A.; Politi, J. R. S.; Chem. Phys. Lett.2006, 423, 67.
10. Cordeiro, J. M. M.; Bosso, A. R. S. A.; J. Mol. Liq.2010, 154, 36.
11. Hammami, F.; Nasr, S.; Bellisent-Funel, M. C.; J. Chem. Phys. 2005, 122, 1.
12. Schoester, P. C.; Zeidler, M. D.; Radnai, T.; Bopp, P. A.;
Z. Naturforsch., A: Phys. Sci. 1995, 50, 38.
13. Cordeiro, J. M. M.; Soper, A. K.; J. Phys. Chem. B 2009, 113, 6819.
14. Shin, S.; Kurawaki, A.; Hamada, Y.; Shinya, K.; Ohno, K.; Tohara, A.; Sato, M.; J. Mol. Struct.2006, 791, 30.
15. Neuefeind, J.; Chieux, P.; Zeidler, M. D.; Mol. Phys.1992, 76, 143.
16. Neuefeind, J.; Zeidler, M. D.; Poulsen, H. F.; Mol. Phys. 1996,
87, 189.
17. Hammami, F.; Nasr, S.; Oumezzime, M.; Cortes, R.; Biomol. Eng. 2002, 19, 201.
18. Sathyanarayana, D. N.; Ganeshsrinivas, E.; Indian J. Chem., Sect. A: Inorg., Bio-inorg., Phys., Theor. Anal. Chem.2003, 41,
1564.
19. Geffrey, G. A.; An Introduction to Hydrogen Bonding; Oxford
University Press: New York, 1997.
20. Desiraju, G. R.; Steiner, T.; The Weak Hydrogen Bond; Oxford
University Press: Oxford, 1999.
21. Freitas, L. C. G.; Cordeiro, J. M. M.; Garbujo, F. L. L.; J. Mol. Liq. 1999, 79, 1.
22. Bertagnolli, H.; Hoffmann, M.; Ostheimer, M. Z.; Phys. Chem. 1989, 165, 165.
24. Cordeiro, J. M. M.; Phys. Chem. Liq.2007, 45, 31.
25. Richardi, J.; Fries, P. H.; Fischer, R.; Rast, S.; Krienke, H.; Mol. Phys. 1998, 93, 925.
26. Wheeler, D. R.; Rowley, R. L.; Mol. Phys.1998, 94, 555.
27. Radnai, T.; Bako, I.; Jedlovszky, P.; Palinkas, G.; Mol. Simul. 1996, 16, 345.
28. Jedlovszky, P.; Palinkas, G.; Mol. Phys.1995, 84, 217. 29. Weerasinghe, S.; Smith, P. E.; J. Chem. Phys. 2003, 118, 10663.
30. Venables, D. S.; Schmuttenmaer, C. A.; J. Chem. Phys.2000,
113, 11222.
31. Venables, D. S.; Schmuttenmaer, C. A.; J. Chem. Phys.2000,
113, 3249.
32. Jorgensen, W. L.; Briggs, J. M.; Contreras, M. L.; J. Phys. Chem. 1990, 94, 1683.
33. McLain, S. E.; Soper, A. K.; Luzar, A.; J. Chem. Phys.2006,
124, 74502.
34. Soares, C. M.; Teixeira, V. H.; Baptista, A. M.; Biophys. J.2003,
84, 1628.
35. Clark, D. S.; Phil. Trans. R. Soc. B2004, 359, 1299. 36. Dordick, J. S.; Biotechnol. Prog.1992, 8, 259.
37. Halling, P. J.; Curr. Opin. Chem. Biol.2000, 4, 74. 38. Klibanov, A. M.; Trends Biotechnol.1997, 15, 97.
39. Halling, P. J.; Phil. Trans. R. Soc. B 2004, 359, 1287. 40. Vidal, M.; Santos, A. M.; Barletta, G.; J. Am. Chem. Soc. 2001,
123, 5380.
41. Halling, P. J.; Blackwood, A. D.; Moore, B. D.; Ann. N. Y. Acad. Sci.1996, 799, 251.
42. Colombo, G.; Toba, S.; Merz, K. M.; J. Am. Chem. Soc. 1999, 121, 3486.
43. Klibanov, A. M.; Nature2001, 409, 241.
44. Peters, G. H.; Van Alten, D. M. F.; Edholm, O.; Toxvaerd, S.; Bywater, R.; Biophys. J. 1996, 71, 2245.
45. Toba, S.; Hartsough, D. S.; Merz, K. M.; J. Am. Chem. Soc. 1996, 118, 6490.
46. Yang, L.; Dordick, J. S.; Garde, S.; Biophys. J.2004, 87, 812. 47. Cordeiro, J. M. M.; Int. J. Quantum Chem.2006, 106, 652.
48. Gray, C. G.; Gubbins, K. E.; Theory of Molecular Liquids; Oxford University Press:New York, 1984.
49. Soper, A. K.; J. Phys.: Condens. Matter 1997, 9, 2399.
50. Soper, A. K.; Mol. Phys.2001, 99, 1503.
51. Soper, A. K.; Phys. Rev. B: Condens. Matter Mater. Phys. 2005, 72, 104204.
52. Allen, M.; Tildesley, D. J.; Computer Simulation of Liquids;
OxfordUniversity Press:Oxford, 1987.
53. Hulme, E. C.; Soper, A. K.; McLain, S. E.; Finney, J. L;
Biophys. J. 2006, 91,2371.
54. Mason, P. E.; Neilson, G. W.; Enderby, J. E.; Saboungi, M. L.; Brady, J. W.; J. Phys. Chem. B2005, 109, 13104.
55. Mason, P. E.; Neilson, G. W.; Enderby, J. E.; Saboungi, M. L.; Brady, J. W.; J. Phys. Chem. B2006, 110, 2981.
56. McLain, S. E.; Soper, A. K.; Watts, A.; J. Phys. Chem. B2006, 110, 21251.
57. McLain, S. E.; Soper, A. K.; Terry, A. E.; Watts, A.; J. Phys. Chem. B2007, 111, 2568.
58. Soper, A. K.; Silver, R. N.; Phys. Rev. Lett.1982, 49, 471.
59. Botti, A.; Bruni, F.; Imberti, S.; Ricci, M. A.; Soper, A. K.; J. Mol. Liq.2005, 117, 77.
60. Botti, A.; Bruni, F.; Imberti, S.; Ricci, M. A.; Soper, A. K.; J. Mol. Liq.2005, 117, 81.
61. Soper, A. K.; Finney, J. L.; Phys. Rev. Lett.1993, 71, 4346. 62. Soper, A. K.; Luzar, A.; J. Phys. Chem.1996, 100, 1357.
63. Freitas, L. C. G.; J. Braz. Chem. Soc.2009, 20, 1541. 64. Israelachvili, J. N.; Intermolecular and Surface Forces; Academic
Press: London, 1985.
65. Cordeiro, J. M. M.; Cordeiro, M. A. M.; J. Braz. Chem. Soc. 2004, 15, 351.
66. Ladanyi, B. M.; Skaf, M. S.; Annu. Rev. Phys. Chem., 1993, 44,
335.
67. Jorgensen, W. L.; Maxwell, D. S.; Tirado-Rieves, J.; J. Am. Chem. Soc. 1996, 118, 11225.
68. Jmol: An Open-Source Java Viewer for Chemical Structures in 3D; http://www.jmol.org.
Submitted: April 3, 2011
Published online: October 4, 2011