Article
Printed in Brazil - ©2012 Sociedade Brasileira de Química0103 - 5053 $6.00+0.00
A
*e-mail: [email protected]
§Present address: California Environmental Protection Agency (EPA), Air Resources Board Haagen-Smit Laboratory, MLD, Organic Analysis Section, 9528 Telstar Ave., El Monte, CA, USA
#Present address: Magee Scientific, 94704 Berkeley, CA, USA
High-Time Resolution Measurements of Black Carbon Particles in the Exhaust Emissions
of a Diesel Engine during Acceleration, Deceleration and Cruise Conditions
Antonio H. Miguel*,§,a and Anthony D. A. Hansen#,b
aCenter for Environmental Research & Technology, College of Engineering,
University of California, 92521 Riverside, CA, USA
bEngineering Division, Lawrence Berkeley National Laboratory, 94720 Berkeley, CA, USA
Carbono negro (BC) é o componente principal de emissões de motores a diesel. Aethalometer®
foi usado nas medições das concentrações de BC (com resolução temporal de 5 s) emitido pelo escapamento de uma caminhonete tipo pick-up a diesel Dodge RAM 2500 1995 equipada com catalisador de oxidação. As medições foram feitas com um dinamômetro de chassis durante os
modos de aceleração, desaceleração e de cruise (velocidade constante) do arranque a quente do
ciclo de ensaio MEC01 (versão 7.0). Partículas de exaustão foram coletadas em paralelo nos filtros de fibra de quartzo para a medição de carbono elementar (EC) e carbono orgânico (OC) pelo
método termo-óptico por reflectância(TOR), e em filtros de Teflon® para determinação gravimétrica
da massa total de partículas (PM). A rápida aceleração foi acompanhada por correspondentes aumentos nas emissões instantâneas de BC. Sob condições de aceleração totalmente aberta (WOT),
a concentração de BC medida pelo Aethalometer® atingiu um pico de 1,2 mg m-3, mas reduziu a
apenas 0,03 mg m-3 em condições cruise de 20 mph. Estes resultados mostram que é possível medir
as emissões especiadas de material particulado de motores a diesel em tempo real em função da carga do motor e outras condições de funcionamento.
Black carbon (BC) is a major constituent of diesel-engine exhaust emissions. Aethalometer®
was used in the measurements of the BC concentrations (with time resolution of 5 s) in the exhaust of a truck model 1995 Dodge RAM 2500 diesel pick-up equipped with an oxidation catalyst. The measurements were made from a chassis dynamometer during the acceleration, deceleration and cruise (constant speed) modes of the hot start of the MEC01 test cycle (version 7.0). Exhaust particles were collected in parallel on quartz fiber filters for elemental carbon (EC) and organic carbon (OC)
measurement by the thermal-optical reflectance (TOR) method, and on Teflon® filters for gravimetric
total particle mass (PM). Rapid acceleration was accompanied by corresponding instantaneous
increases in BC emissions. Under wide open throttle acceleration (WOT), Aethalometer® BC
concentrations peaked at 1.2 mg m-3,but reduced to only 0.03 mg m-3 under cruise conditions at
20 mph. These results show that it is possible to measure speciated diesel particulate emissions essentially in real time as a function of engine load and other operating conditions.
Keywords: high-time, black carbon, BC, diesel engine, exhaust emissions
Introduction
Combustion-derived aerosol consists mainly of solid carbonaceous particles, including BC (black carbon), sometimes denoted EC (elemental carbon), and OC (organic carbon) that is associated with a complex mixture of toxic organic species. BC emissions contribute significantly to
fine particle mass and are an important cause of atmospheric visibility impairment. They change the atmospheric radioactive balance and influence the nucleation and optical properties of clouds, leading to perturbation of rainfall and a very important component of the forcing for global climate change. In addition, carbonaceous particulate matter contains absorbed/adsorbed toxics such as polycyclic aromatic hydrocarbons,1 a class of compounds of concern
that includes several potent mutagens and carcinogens.2
Diesel exhaust particles are usually found with a trimodal, lognormal form size distribution.3 The coarse mode
accumulation mode, in the 0.1-0.3 µm dp range, contains most of the particle mass.3 The nucleation (or Aitken) mode
consists of particles in the 0.005-0.05 µm dp range, and contains more than 90% of the particle number.3,4 It has
been well established that ultrafine (dp <100 nm) particulate PAH measured in urban air and in roadway tunnels is found in the same size range as the black carbon component.5
Recent changes in the composition of gasoline and diesel fuel and, more importantly, improvements in engine and emission control technologies are likely to have affected vehicle emissions. In California, for instance, low-aromatic, low-sulfur diesel fuel6 has been used year-round since 1993,
and reformulated gasoline7 has been used year-round since 1996. The introduction of electronic diesel fuel injection systems and the increasing fraction of catalyst-equipped light-duty vehicles on the road are examples of shifts in vehicle technology that have influenced emissions. For instance, beginning in 1988, control measures to reduce PM (total particle mass) emissions from diesel engines led to dramatic reductions in the particle mass emitted. However, it has been reported that some low-emission diesel engines emit much higher concentrations of ultrafine particles than older engine designs.2 Particle in the nano-size range are formed
by nucleation, which occurs during dilution and cooling of the exhaust.3 Typically, these particles include hydrocarbons
and sulfate, while the accumulation mode consists mainly of soot agglomerates formed directly by combustion,3 in
addition to oily droplets as shown by Flagan4 and Miguel
and co-workers,5 and PAHs found both in the nuclei mode
(dp < 30 nm) and the accumulation modes.8
A common practice of measurements of carbonaceous emissions from motor engine exhaust is by collection on quartz fiber filters, as described in the 1995 Code of Federal Regulations,9 followed by laboratory analysis. These
filter-based methods are time consuming and do not provide the rapid time resolution that is essential for the understanding of the load-dependent temporal behavior of emissions. The major goal of this study was to provide means of measuring the concentration of BC with high time resolution in the exhaust emissions of a diesel-fueled truck, during fast-changing load conditions. As has been shown in many studies, the emissions are dominated by older vehicles. The 1995 model vehicle used in this study will have emissions relevant to the vehicle fleets found in countries such as Brazil.
Experimental
Vehicle description and testing
The diesel-fueled truck tested was procured by the Vehicle Emissions Research Laboratory (VERL) staff at
the University of California, Riverside Bourns College of Engineering Center for Environmental Research and Technology (CE-CERT), as part of an ongoing National Cooperative Highway Research Program (NCHRP) to evaluate the emissions from diesel engines.10 The vehicle
tested was a 1995 Dodge RAM 2500 diesel pick-up truck 5.9L V8 16 valve, fuel injection engine equipped with a 2-way oxidation catalyst, and is considered a normal emitter. It was operated on a Burke E. Porter 48” single-roll dynamometer, equipped with a Pierburgh CVS/dilution tunnel system, following phase one (hot start) of the MEC01 emission driving cycle (version 7.0) developed by Bart and co-workers,10 for the NCHRP
(Figure 1). A constant volume sampler (CVS) flow rate of 856 SCFM was used for the tests, and the vehicle was tested with the fuel in the tank at the time it was received, after an overnight soak at a temperature of 72 ± 2 oC. The
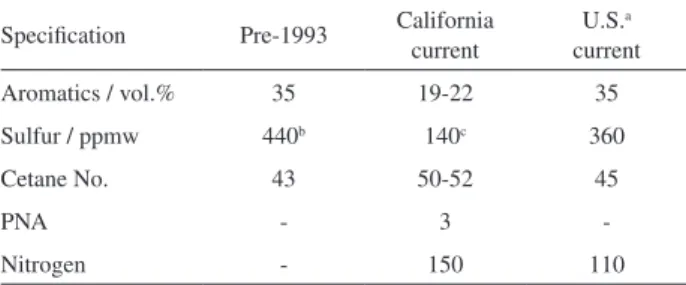
specifications of the California reformulated diesel are shown in Table 1.
Analytical procedures
Aethalometer BC and FID C3H8 measurements
A single-wavelength aethalometer11 (Magee Scientific,
Berkeley, CA USA, model AE-16) was used to measure BC concentrations in the dynamometer tunnel with 5 s time resolution. After dilution of the engine-out emissions by a factor of 18.2 in the dynamometer tunnel, the aethalometer sample stream was further diluted with 1.0 L min-1 of
particle-free ambient air. This secondary dilution was necessary to reduce BC concentrations to the normal working range of the instrument. Conductive silicone tubing of 0.25 inch OD was used to transfer the samples from the dynamometer tunnel to the aethalometer. This is critical for aerosol measurements because it reduces the buildup of static charge and minimizes particle loss to the tubing wall. The aethalometer uses a continuous filtration and optical transmission technique to measure Table 1. Average specifications of reformulated diesel fuel
Specification Pre-1993 California current
U.S.a current
Aromatics / vol.% 35 19-22 35
Sulfur / ppmw 440b 140c 360
Cetane No. 43 50-52 45
PNA - 3
-Nitrogen - 150 110
the concentration of BC in near-real-time. The sample was collected at flow rates of 3.3 L min-1 onto a 0.5 cm2 area
of quartz fiber filter material (Pallflex Tissuquartz type 2500QAO, which advances automatically to avoid optical saturation. Aerosol retention > 99.9% tested following ASTM D 2986-95A 0.3 µm (DOP) at 32 L min-1 per 100
cm2 filter media. Quartz filters were pre-fired for 30 min at
800 oC in air to remove all organic contamination.
The transmission measurement determines optical absorption at 880 nm, which is converted to concentration of BC in the sample stream. The aethalometer records data internally and its timing was synchronized with the dynamometer instrumentation to ± 1 s. Gas-phase C3H8
measurements, performed with 1 s time resolution using a Horiba flame ionization analyzer (FID detector) helped us to understand the relationship and dynamics of both gas- and particle-phase exhaust emissions.
EC, OC and PM measurements
In order to get a measure of the emitted carbonaceous species, aerosol particles were collected during the entire modal emission cycle onto 47 mm diameter filters. Quartz filters were used for the determination of EC and OC, and Teflon filters were used for the determination of total particle mass (PM) using a Mettler microbalance accurate to ± 3 µg. EC and OC concentrations on the quartz filters
were determined by combustion analysis using the thermal-optical reflectance (TOR) method.
Results and Discussion
Aethalometer and FID data
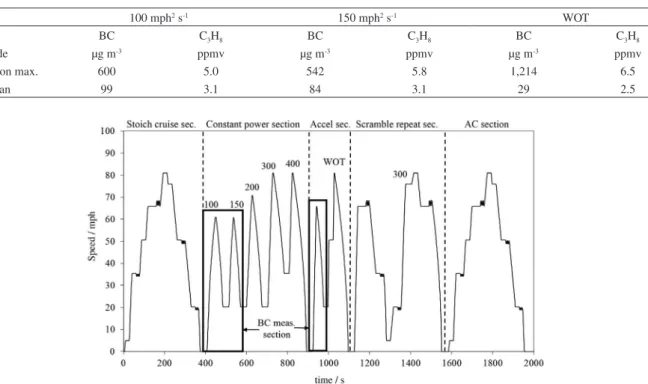
Table 2 summarizes the BC and C3H8 data taken under
the specific power (SP) conditions of 100 and 150 mph2
s-1 during the constant power and the WOT sections of the
MEC01 emission driving cycle (Figure 1).
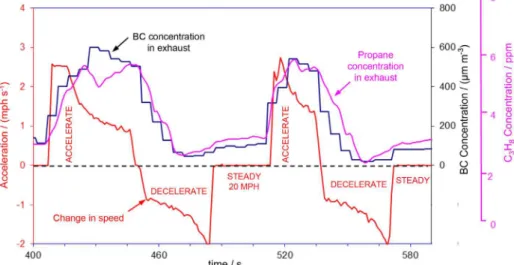
In the first event, occurring between ca. 400-470 s (Figure 2), the aethalometer BC and C3H8 concentrations
peaked, respectively, at 0.6 mg m-3 and 5.0 ppmv during
acceleration, and averaged 0.1 mg m-3 and 3.1 ppmv
under cruise conditions at 20 mph. In the second event, between 500-550 s (Figure 2), BC and C3H8 concentrations
peaked, respectively, at 0.5 mg m-3 and 5.8 ppmv during
acceleration, and averaged 0.08 mg m-3 and 3.1 ppmv
under cruise conditions at 20 mph. These data show several interesting features: first, fast accelerations are accompanied by corresponding instantaneous increases in BC and C3H8 emissions, which indicates that both
components result from incomplete combustion of the fuel. Second, BC and C3H8 concentrations track each other
quite well during acceleration, deceleration and cruise
Table 2. Aethalometer results for BC and C3H8 measurements made during the constant power and the WOT sections of the MEC01 emission driving cycle
100 mph2 s-1 150 mph2 s-1 WOT
Species BC C3H8 BC C3H8 BC C3H8
Cycle mode µg m-3 ppmv µg m-3 ppmv µg m-3 ppmv
Acceleration max. 600 5.0 542 5.8 1,214 6.5
Cruise mean 99 3.1 84 3.1 29 2.5
conditions at 20 mph. Third, during cruise conditions at 20 mph, there is a slow, but continuous increase in the concentration of both components, rising slowly up to the point where acceleration is re-started. One possible explanation of this observation is that, when acceleration is ceased, the immediate decrease in the exhaust temperature is accompanied by a reduction in the thermophoretic losses to the walls of the dilution tunnel. Although thermophoretic forces are small, the high mobility of nano- and ultrafine- size diesel exhaust particles is high enough to promote losses of particles to the tunnel walls, a phenomenon routinely observed when sampling with Teflon bags.12
For instance, McMurry and Rader13 showed that the
maximum (stirred tank) and the minimum (gentle mixing) thermophoretic deposition rates for a 16 K difference are 851 K cm-1 and 62 K cm-1, respectively, for diesel particle
collection onto a Teflon bag. During the dynamometer test, the difference in temperature between the dynamometer cell compartment and the interior of the dilution tunnel averaged 26 K. For this reason, it is reasonable to assume that the largest particle losses are expected to occur during the fast acceleration modes (stirred tank) of operation of the MEC01 emission driving cycle, when the engine operates at higher temperatures than under deceleration and cruising conditions.
Under wide open throttle acceleration (WOT), BC and C3H8 concentrations peaked, respectively, at 1.2 mg m-3 and
6.5 ppmv, although they averaged only 0.03 mg m-3 and
2.5 ppmv during cruise conditions at 20 mph (Figure 3). The same concentration profiles and features are observed under this condition, which corresponds to the fastest acceleration mode of the modal emission cycle.
Figure 2. Results of aethalometer BC and FID C3H8 concentrations during the acceleration, deceleration and cruise conditions of the constant power section of the MEC01 emission driving cycle.
OC, EC and PM filter data for phase 1 of the MEC01 emission driving cycle
Filter measurements of EC concentrations using the TOR method generally agree quite well with aethalometer BC concentrations.14 These parallel filter measurements
provide additional information on the concentrations of the important major classes of carbonaceous species present. For this reason, it was measured EC, along with OC and PM concentrations (Table 3) during the entire phase 1 of the MEC01 emission driving cycle.
Taking into consideration a (constant) dilution factor of 18.2 for phase 1 of the MEC01 emission driving cycle, the calculated mean EC, OC, TC and PM engine-out exhaust and diluted concentrations are shown in Table 3. EC represented 49% of TC, i.e., 41% of the gravimetric particle mass, while TC accounted for 85% of the PM (Table 3). The remaining 15% contains ash, sulfate, and other components typically found in diesel engine exhaust.3 The EC/PM ratios
observed in the present study are consistent with EC/PM2.5 average ratios of 0.52 found by Kirchstetter et al.15 for 1977
California HD diesels in the Caldecott Tunnel, located in a commuter route east of Berkeley. Dallmann et al.16
measured PM2.5 emissions, but with an un-calibrated instrument. Their results suggest a BC/PM2.5 ratio between 0.5 and 1, i.e., that the direct diesel particulate emissions were primarily composed of BC.
Conclusions
Aerosol black carbon concentrations were measured by an aethalometer with 5 s time resolution in the exhaust emissions of a diesel-engine pick up truck during acceleration, deceleration and cruise operating conditions of the first phase (hot start) of the MEC01 emission driving cycle. Rapid increases in vehicle speed during acceleration were accompanied by corresponding instantaneous increases in BC (and C3H8) concentrations,
reaching a (diluted) value of 1.2 mg m-3 under wide open
throttle acceleration, and dropping down to 0.03 mg m-3
under cruising conditions at 20 mph. Fast acceleration
under a specific power of 100 mph2 s-1 produced a BC
concentration peak of 0.6 mg m-3, and 0.1 mg m-3 under
cruising conditions at 20 mph. A slow increase in the BC concentration from the beginning to the end of the cruise conditions at 20 mph suggests the occurrence of a decrease in thermophoretic losses to the walls of the dilution tunnel as a result of decreased exhaust temperature during deceleration. Gas-phase propane emission concentrations measured concurrently with 1 s time resolution closely followed the BC concentrations, suggesting that both components result from incomplete combustion of the fuel. These results show that it is possible to measure speciated diesel particulate emissions essentially in real time, as a function of engine load and other operating conditions.
Acknowledgments
The authors are indebted to several CE-CERT individuals: J. M. Norbeck, ex-director, for providing internal CE-CERT research funds used to carry out this study, to D. J. Martis, T. D. Durbin, R. L. Rettig, W. J. Calhoun and K. Stieglitz for running the dynamometer tests and providing the propane data reported in this study; Matt Barth, Mike Todd, and G. A. Scora for helpful discussions regarding the MEC01 emission driving cycle.
References
1. Odum, J. R.; YU, J. Z.; Kamens, R. M.; Environ. Sci. Technol.
1994, 28, 2278; Jang, M.; Kamens, R. M.; Leach, K. B.; Strommen, M. R.; Environ. Sci. Technol. 1997, 31,2805; Liang, C. K.; Pankow, J. F.; Odum, J. R.; Seinfeld, J. H.; Environ. Sci. Technol. 1997, 31, 3086;Marr, L. C.; Kirchstetter, T. W.; Harley, R. A.; Miguel, A. H.; Hering, S. V.; Environ. Sci. Technol.1999,
33, 3091; Miguel, A. H.; Kirchstetter, T. W.; Harley, R. A.; Hering, S. V.; Environ. Sci. Technol.1998, 32, 450; Pankow, J. F.; Atmos. Environ. 1994, 28, 185;Strommen, M. R.; Kamens, R. M.; Environ. Sci. Technol. 1997, 31,2983.
2. Nauss, K. M. In Diesel Exhaust: A Critical Analysis of Emissions, Exposure and Health Effects; Health Effects Institute: Cambridge, MA, 1995, pp. 11-61.
Table 3. Results of EC, OC and PM filter measurements of engine-out and diluted (18.2 times) exhaust concentrations obtained during the entire phase 1 (hot start) of the MEC01 emission driving cycle
Component Engine-out / (mg m-3) Diluted / (µg m-3) EC/TC OC/TC TC/PM EC/PM
EC concentration 14.1 774
OC concentration 14.8 814
TC (EC+OC) conc. 28.9 1,588
PM concentration 34.0 1,686
3. Kittelson, D. B.; J. Aerosol Sci.1998, 29, 575. 4. Flagan, R. C.; Aerosol Sci. Technol.1999, 30, 556.
5. Miguel, A. H.; Friedlander, S. K. In Aerosols; Liu, B. Y. H.; Pui, D.; Fissan, H., eds.; Elsevier Science: New York, 1984, pp. 407-410; Venkataraman, C.; Friedlander, S. K.; Environ. Sci. Technol.1994, 28,563; Venkataraman, C.; Lyons, J. M.; Friedlander, S. K.; Environ. Sci. Technol.1994, 28,555. 6. CARB; CaRFG Performance Compatibility Test Program,
California Air Resources Board: Sacramento, CA, 1996. 7. CARB; Proposed Adoption of Regulations Limiting the Sulfur
Content and the Aromatic Hydrocarbon Content of Motor Vehicle Diesel Fuel, Stationary Source Division, California Air Resources Board: Sacramento, CA, 1988.
8. Eiguren-Fernandez, A.; Miguel, A. H.; Environ. Sci. Technol.
2012, 46, 2607.
9. Code of Federal Regulations; Exhaust Gas Sampling System; Diesel Vehicles, Title 40 - Protection of the Environment 40 CFR 86, 1995, 110-82, 542.
10. Bart, M.; An, F.; Younglove, T.; Scora, G. A.; Levine, C.; Ross, M.; Wenzel, T.; Development of a Comprehensive Modal Emission Model,Draft Final Report, National Cooperative Highway
Research Program, 1999, NCHRP Project 25-11; Barth, M.; Younglove, T.; Wenzel, T.; Scora, G.; An, F.; Ross, M.; Norbeck, J.;
Transp. Res. Rec. 2007, 1587, 73.
11. Hansen, A. D. A.; McMurry, P. H.; J. Air Waste Manage. Assoc.
1990, 40, 894.
12. Pierce, J. R.; Engelhart, G. J.; Hildebrandt, L.; Weitkamp, E. A.; Pathak, R. K.; Donahue, N. M.; Robinson, A. L.; Adams, P. J.; Pandis, S. N.; Aerosol Sci. Technol.2008, 42, 1001. 13. McMurry, P. H.; Rader, D. J.; Aerosol Sci. Technol.1985, 4,
249.
14. Hansen, A. D. A.; Rosen, H.; Novakov, T.; Sci. Total Environ.
1984, 36, 191; Allen, G. A.; Lawrence, J.; Koutrakis, P.; Atmos. Environ. 1999, 33, 817.
15. Kirchstetter, T. W.; Harley, R. A.; Kreisberg, N. M.; Stolzenburg, M. R.; Hering, S. V.; Atmos. Environ.1999, 33, 2955. 16. Dallmann, T. R.; Harley, R. A.; Kirchstetter, T. W.; Environ.
Sci. Technol.2011, 45, 10773.