Article
Printed in Brazil - ©2012 Sociedade Brasileira de Química0103 - 5053 $6.00+0.00
A
*e-mail: [email protected]
Kinetic Modeling of the Alkaline Decomposition of Potassium Arsenojarosite
Mizraim U. Flores,Francisco Patiño,* Iván A. Reyes, Isauro Rivera, Martín Reyes and Julio C. Juárez
Centro de Investigaciones en Materiales y Metalurgia, Universidad Autónoma del Estado de Hidalgo, Carretera Pachuca, Tulancingo km 4.5, CP 42184, Mineral de la Reforma, Hidalgo, México
Uma amostra de arsenojarosita de potássio foi sintetizada e completamente caracterizada. A amostra obtida é uma solução sólida de arsenojarosita de potássio, cuja fórmula aproximada é [K0,75(H3O)0,25]Fe1,84[(SO4)1,82(AsO4)0,18][(OH)2,34(H2O)3,66]. O processo de decomposição em meio alcalino foi estudado no período de indução e de conversão progressiva, e a ordem de reação e a energia de ativação foram determinadas para cada caso. Nas condições experimentais utilizadas, os resultados são consistentes com modelo de partícula esférica com núcleo decrescente e controle químico. Em ambos os processos, quatro modelos parciais e dois modelos globais foram desenvolvidos para descrever seu comportamento básico. Os modelos foram validados, e foi provado que descrevem favoravelmente o processo de decomposição em meio alcalino.
A sample of potassium arsenojarosite was synthesized and thoroughly characterized. The obtained sample is a solid solution of potassium arsenojarosite, whose approximate formula is [K0.75(H3O)0.25]Fe1.84[(SO4)1.82(AsO4)0.18][(OH)2.34(H2O)3.66]. The decomposition process in alkaline medium was studied in the induction and progressive conversion periods, and the reaction order and activation energy were determined for each case. Under the used experimental conditions, results are consistent with the spherical particle model with decreasing core and chemical control. In both processes, four partial models and two global models were developed in order to describe their basic behavior. The models were validated, and it was proved that they favorably describe the decomposition process in alkaline medium.
Keywords: potassium arsenojarosite, alkaline decomposition, kinetic modeling, activation
energy, reaction order
Introduction
In many parts of the world, potable water is polluted with arsenic. This element is disposed of by mining and
chemical industries, refineries, etc.1 The presence of
arsenic in ground waters can be also natural because of the
leaching of rocks and sediments that contain this element.2
These ground waters contain great amounts of arsenic, and they are consumed by millions of people around the world, in countries like Bangladesh, Cambodia, China, India,
Laos, Myanmar, Nepal, Pakistan and Vietnam in Asia.3
This problem is also present in the American continent, in countries such as Argentina, Mexico, Chile, Peru,
United States, Brazil and Canada.4,5 For these reasons, the
U. S. Environmental Protection Agency has set the amount
of 10 µg L−1 as the maximum level of pollution allowed
in potable water.6 Thus, several alternatives have been
studied in order to solve this problem.7 Jarosite technology
has been applied for 40 years in the zinc industry as a way to control Fe and other impurities, such as As. Therefore, arsenic can be incorporated into the structure of the jarosites, which work as an inerting medium for this
toxic element. Regarding this, Dutrizac et al.8,9 studied
the incorporation of arsenic as AsO43− in the lattice of
potassium, sodium and lead jarosite at 97 and 150 oC.
Patiño et al.10-14 have thoroughly studied the alkaline
reactivity of argentian jarosites in alkaline medium. Although there are several studies related to the alkaline decomposition of jarosite type compounds, only few ones
are related to jarosite type compounds with arsenic.15,16
These works are focused on the characterization of the dissolution residues and on the kinetic study of these
compounds. However, regarding the latter,16 the obtained
For this reason, in this research work, a kinetic study, which allows to describe and to predict the behavior of this compound, was carried out at different experimental conditions. Reaction rates and dependencies were compared in a wide range of experimental conditions of concentration, temperature and particle size. Partial and global kinetic models of the induction and progressive conversion periods were developed for the alkaline decomposition of the
potassium arsenojarosite in NaOH and Ca(OH)2 media.
Experimental
The potassium arsenojarosite samples were synthesized using the parameters previously described by
Dutrizac et al.8,9 and characterized by different techniques.
The alkaline decomposition experiments in NaOH and
Ca(OH)2 media were carried out under the following
conditions: 0.2 g potassium arsenojarosite (38 ± 2 µm) in
an initial volume of 0.5 L, stirring rate of 500 min−1, varying
the concentration of OH−, temperature and particle size.
The pH value was kept constant during all the experiment in both media by adding small amounts of concentrated
NaOH and Ca(OH)2, respectively. The OH− concentration
was determined by considering the ionization constant of water and pH of the alkaline solution according to the
temperatures used in a previous work.17
Figure 1 shows a scanning electron microscopy (SEM) image (JEOL JSM-5900 LV) of almost spherical particles, which are formed by soundly soldered rhombohedral crystals.
The alkaline decomposition kinetics was monitored by atomic absorption spectroscopy (AAS) of potassium using a Perkin Elmer Analyst 200 equipment. For all of the performed
experiments, the induction period (tind) was determined and
the experimental rate constant (kexp) was calculated. The
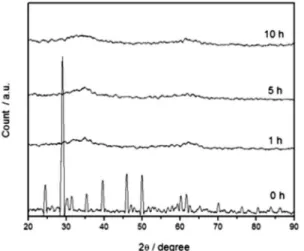
kinetic modeling was carried out with the experimental results of the alkaline decomposition of potassium arsenojarosite. The solids at different decomposition times, as well as those submitted to high temperatures, were analyzed by X-ray diffractometry (SIEMENS D-500), SEM with an accelerating voltage of 20 kV and microanalysis by energy-dispersive X-ray spectroscopy (SEM-EDS in an Oxford Equipment). The objective was to determine their evolving process. Tables 1 and 2 summarize the experimental data that were used in the modeling.
Results and Discussion
Topology of the reaction
The decomposition of potassium arsenojarosite in
NaOH and Ca(OH)2 media presents an induction period
(tind), during which the arsenojarosite does not react.
Therefore, the SO42− and K+ concentrations are found at
negligible levels in the solution (Figure 2). The induction period has been observed in the decomposition of jarosites synthesized in the laboratory, as well as in those coming
from industrial plants.18 The ion concatenation of the
medium with the surface of the particle creates active sites until a reaction front is established, and through which the
Figure 1. Particle size distribution of the synthesized potassium
arsenojarosite.
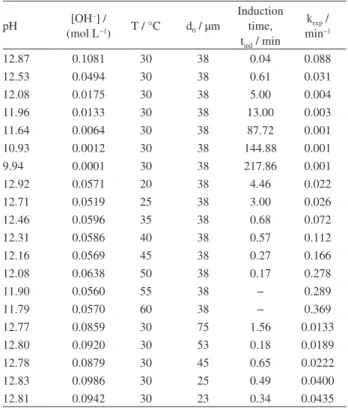
Table 1. Decomposition of potassium arsenojarosite in NaOH medium: n = 2.65, Ea = 84.7 kJ mol−1 for the induction period; n = 1.86, Ea = 60.3 kJ mol−1 for the progressive conversion period
pH [OH
−] /
(mol L−1) T / °C d0 / µm
Induction time, tind / min
kexp / min−1
12.87 0.1081 30 38 0.04 0.088
12.53 0.0494 30 38 0.61 0.031
12.08 0.0175 30 38 5.00 0.004
11.96 0.0133 30 38 13.00 0.003
11.64 0.0064 30 38 87.72 0.001
10.93 0.0012 30 38 144.88 0.001
9.94 0.0001 30 38 217.86 0.001
12.92 0.0571 20 38 4.46 0.022
12.71 0.0519 25 38 3.00 0.026
12.46 0.0596 35 38 0.68 0.072
12.31 0.0586 40 38 0.57 0.112
12.16 0.0569 45 38 0.27 0.166
12.08 0.0638 50 38 0.17 0.278
11.90 0.0560 55 38 − 0.289
11.79 0.0570 60 38 − 0.369
12.77 0.0859 30 75 1.56 0.0133
12.80 0.0920 30 53 0.18 0.0189
12.78 0.0879 30 45 0.65 0.0222
12.83 0.0986 30 25 0.49 0.0400
ions of the medium and the potassium arsenojarosite start to diffuse. This is followed by a progressive conversion period,
when the concentrations of SO42− and K+ progressively
increase until reaching stabilization (Figure 2), indicating the end of the reaction.
Figure 3a is an SEM image of a partially decomposed potassium arsenojarosite particle, showing an unreacted core surrounded by a reaction front, which is wrapped in an amorphous gel of iron hydroxide with arsenic. This can be confirmed in Figure 3b, which shows a linescan (indicated in Figure 3a) of the partially decomposed particle, from the core to the halo of the amorphous gel. This figure shows how the amount of sulfur and potassium decreased, indicating that these species have diffused from the core to the solution, while iron and arsenic are still distributed throughout the particle. The relative amounts of all the species are constant in the core, which means that it did not react. The residues do not evolve into new crystal phases, not even after reaching total decomposition (0-10 h). This was evidenced by the X-ray diffractograms in Figure 4, in which the decomposition product is observed
as an amorphous material. Therefore, the process is given by the following reaction:
[K0.75(H3O)0.25]Fe1.84[(SO4)1.82(AsO4)0.18][(OH)2.34(H2O)3.66]
+ 3.43 OH−
(aq)→ 0.75 K
+
(aq) + 1.82 SO4 2−
(aq) +
1.84 Fe(OH)3 0.18 AsO43−(gel) + 4.16 H2O (l)
The decomposition solids were exposed to high
temperatures. At 110 and 400 oC, there is no formation
of new crystal phases, but sharp diffraction peaks, Figure 2. Alkaline decomposition curve of the potassium arsenojarosite, pH 12.78, 38 ± 2 µm, 30 °C.
Figure 3. (a) Potassium arsenojarosite particle partially decomposed in NaOH medium, pH 12.78, 38 ± 2 µm, 30 °C and (b) linescan of the particle shown in figure 3A.
Table 2. Decomposition of potassium arsenojarosite in Ca(OH)2
medium: n = 0.24, Ea = 88.3 kJ mol−1 for the induction period; n = 1.14, Ea = 74.4 kJ mol−1 for the progressive conversion period
pH [OH
−] /
(mol L−1) T / °C d0 / µm
Induction time, tind /
min
kexp / min−1
12.53 0.0494 30 38 28.5 0.006
12.48 0.0441 30 38 28.6 0.005
12.43 0.0393 30 38 28.6 0.004
12.33 0.0312 30 38 29.3 0.003
12.12 0.0192 30 38 33.2 0.002
11.87 0.0108 30 38 41.0 0.002
11.25 0.0026 30 38 56.0 0.002
11.06 0.0017 30 38 65.0 0.002
12.8 0.0434 20 38 52.0 0.002
12.55 0.0359 25 38 39.5 0.003
12.03 0.0221 35 38 22.0 0.003
11.95 0.0256 40 38 19.6 0.008
11.74 0.0216 45 38 16.6 0.009
11.58 0.0202 50 38 11.7 0.013
11.44 0.0194 55 38 9.2 0.018
11.24 0.0161 60 38 3.5 0.020
11.12 0.0158 65 38 0.9 0.041
10.93 0.0131 70 38 − 0.043
12.24 0.0254 30 75 40.0 0.0010
12.22 0.0242 30 53 31.5 0.0020
12.27 0.0272 30 45 29.7 0.0026
12.29 0.0284 30 28 23.2 0.0039
characteristic of crystalline hematite, Fe2O3 (01-089-8103),
were observed after thermal treatment at 600 °C (Figure 5).13
All results in NaOH and Ca(OH)2 media, it can be
explained using the spherical particle model with decreasing core, in which the process is controlled by the chemical
reaction according to the following expressions:19-21
kexpt = 1 – (1 – X)1/3 (2)
where
(3)
kexp is the experimental rate constant, X is the fraction that
reacted, VM is the molar volume of the solid, cA represents the
reactant concentration, r0 stands for the initial radius of the
particle, kq is the rate constant of the chemical reaction and
n is the reaction order. Figure 6 presents the experimental results from Figure 2 after applying equation 2, and it can be observed that they are consistent with the chemical control expression as the stage that controls the reaction rate.
Modeling
Arsenojarosite decomposition in alkaline medium
Tables 1 and 2 summarize the experimental results,
in which the induction period (tind) and experimental rate
constant are presented within a wide range of experimental
conditions, such as NaOH and Ca(OH)2 concentrations,
temperature and particle size. The initial pH was kept
constant along the reaction, and the [OH−] was calculated
according to the ionic constant of water at the working temperature of each reaction, as previously mentioned in
the Experimental section.17
Induction period (tind)
Fo r t h e i n d u c t i o n p e r i o d o f t h e p o t a s s i u m arsenojarosite decomposition in NaOH medium with [OH−] > 6.4 × 10⁻³ mol L−1, a fractional reaction order of
n = 2.65 was obtained. The calculated activation energy
in NaOH medium is Ea = 84.7 kJ mol−1. In the case of the
Ca(OH)2 with [OH
−] > 3.1 × 10⁻² mol L−1, the fractional
reaction order is n = 0.24. The calculated activation energy
in Ca(OH)2 medium is Ea = 88.3 kJ mol
−1. According to
these results, the induction period for NaOH is defined by the following expressions.
For [OH−] > 6.4 × 10⁻³ mol L−1:
(4)
For the induction period in Ca(OH)2 medium with
[OH] > 3.1 × 10⁻² mol L−1, the expression is the following:
(5) Figure 6. Representation of the decreasing core model with chemical control of the data in Figure 2.
Figure 5. X-ray diffractograms of the total decomposition product heated at 110, 400 and 600 oC for 1 h, including the identification of the phase formed at 600 oC.
Progressive conversion period
For the progressive conversion period corresponding to the potassium arsenojarosite decomposition in
NaOH medium with [OH−] > 6.4 × 10⁻³ mol L−1, a
fractional reaction order of n = 1.86 was obtained. The activation energy calculated in NaOH medium is
Ea = 60.3 kJ mol−1. Therefore, the kinetic expression for
the progressive conversion period in NaOH medium is as follows.
For [OH−] > 6.4 × 10⁻³ mol L−1:
(6)
For the progressive conversion period corresponding
to the potassium arsenojarosite decomposition in Ca(OH)2
with [OH−] > 1.92 × 10⁻² mol L−1, a fractional reaction
order of n = 1.14 was obtained. The activation energy
calculated in Ca(OH)2 medium is Ea = 74.4 kJ mol−1, so the
kinetic expression for the progressive conversion period in
Ca(OH)2 is as follows.
For [OH−] > 1.92 × 10⁻² mol L−1:
(7)
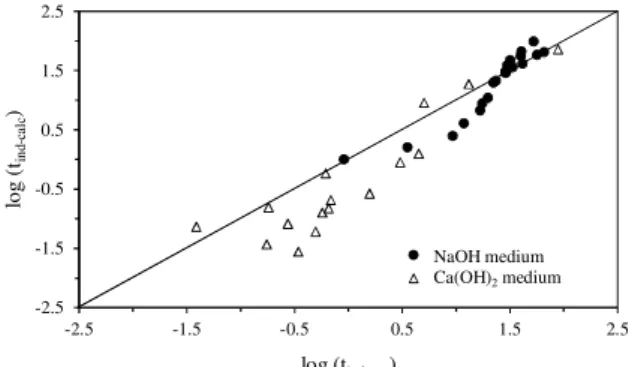
Figure 7 is a plot of the development of the kinetic model according to equations 4 and 5, showing the experimental
induction period (tind-exp (min)) vs. the calculated induction
period (tind-calc (min)). Since the induction and progressive
conversion periods are at different magnitude orders, the base 10 logarithms of the calculated and experimental induction periods were plotted.
Figure 8 presents the development of equation 6, being
a plot of the experimental rate constant vs. the calculated
rate constant, e.g., kexp (min
−1) vs. k calc (min
−1) in NaOH
medium. Likewise, Figure 9 depicts the development of
equation 7, which represents the behavior of the progressive
conversion period in Ca(OH)2 medium.
In all the kinetic expressions: vM = 153.07 cm
3 mol−1,
R = 8.3144 J mol−1 K−1, r
0 in cm, T in Kelvin, [OH−] in
mol L−1 and t in minutes.
From equations 4 and 6, corresponding to the alkaline decomposition in NaOH medium with
[OH−] > 6.4 × 10⁻³ mol L−1, a general expression can be
established in order to determine the total reaction time needed for obtaining a definite conversion of the potassium arsenojarosite. The kinetic model is the following:
(8)
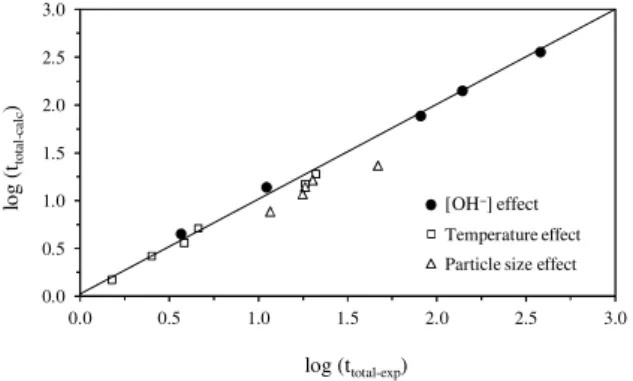
Figure 10 shows the total reaction time needed for obtaining a potassium arsenojarosite conversion of
X = 0.75 (calculated according to equation 8) vs. the same
experimentally obtained parameters. It can be concluded that equation 8 is consistent with the experimental results because the experimental and the calculated data do not show any considerable differences.
For equations 5 and 7, corresponding to the
decomposition in Ca(OH)2 medium, an expression was
Figure 7. Induction period. Alkaline decomposition of the potassium arsenojarosite. Comparison between the calculated and experimental data in NaOH and Ca(OH)2 media.
Figure 8. Progressive conversion period. Alkaline decomposition of the potassium arsenojarosite in NaOH medium. Comparison between the calculated and experimental data, [OH−] > 6.4 × 10⁻³ mol L−1.
established in order to determine the total reaction time needed for obtaining a definite conversion of the potassium arsenojarosite. The kinetic model is the following:
(9)
Figure 11 shows the total reaction time needed for obtaining a conversion of X = 0.75 (calculated according
to equation 9) vs. the same parameter (experimentally
obtained). It can be concluded, therefore, that equation 9 is consistent with the experimental results of the
decomposition in Ca(OH)2 medium.
Conclusions
The decomposition solids do not evolve into new crystal phases after reaching total decomposition. However,
after being heated at 600 oC, the decomposition product
evolves into a new crystal phase, which was identified as
hematite (Fe2O3). The general mathematical models for the
decomposition of potassium arsenojarosite in NaOH and
Ca(OH)2 media during the induction and progressive
conversion periods are presented as follows:
NaOH
Ca(OH)2
These models describe the process of alkaline decom-position of the potassium arsenojarosite. They will also allow to predict its behavior at different temperature (20-60 °C) and
concentration conditions (0.1-2.7 × 10⁻⁴ mol L−1 for
NaOH and 2.3 × 10⁻²-7 × 10⁻⁴ mol L−1 for Ca(OH)
2).
References
1. Korngold, E.; Belayev, L. A.; Desalination2001, 141, 81. 2. Thomas, S. Y.; Choong, T. G.; Chuah, Y. R.; Gregory K.; Azni, I.;
Desalination2007, 217, 139.
3. Brammer, H.; Environ. Int. 2009, 35, 856.
4. Mandal, B. K.; Suzuki, K. T.; Talanta2002, 58, 201. 5. Ning, R. Y.; Desalination2002, 143, 237.
6. EPA Office of groundwater and drinking water. Implementation guidance for the arsenic rule. EPA 2002, report-816-D-02-005-,
Cincinnati, USA.
7. Katsoyiannis, I. A.; Zouboulis A. I.; Water Res.2004, 38, 17. 8. Dutrizac, J. E.; Jambor, J. L.; Can. Metall. Q. 1987, 26, 91.
9. Dutrizac, J. E.; Jambor, J. L.; Chen, T. T.; Can. Metall. Q. 1987,
26, 103.
10. Patiño, F.; J. Mex. Chem. Soc. 1993, 37, 51.
11. Patiño, F.; Cruells, M.; Roca, A.; Salinas, E.; Perez, M.;
Hydrometallurgy2003, 70, 153.
12. Patiño, F.; Salinas, E.; Cruells, M.; Roca, A.; Hydrometallurgy
1998, 49, 323.
13. Patiño, F.; Roca, A.; Reyes, M.; Cruells, M.; Rivera, I.; Hernández, L. E.; J. Mex. Chem. Soc. 2010, 54, 216.
14. Patiño F.; Reyes, I.; Rivera, I.; Reyes, M.; Hernández, J.; Pérez, M.; J. Mex. Chem. Soc. 2011, 55, 197.
15. Smith, A. M. L.; Dubbin, W. E.; Wright, K.; Hudson-Edwards, K. A.; Chem. Geol.2006, 229, 344.
16. Reyes, I. A.; Patiño, F.; Rivera I.; Flores, M. U.; Reyes, M.; Hernández, J.; J. Braz. Chem. Soc. 2011, 22, 2260.
17. Lide, D. R; Handbook of Chemistry and Physics, 89th ed.; CRC
Press: Boston, 2009, ch. 8.
18. Roca, A.; Cruells, M.; Patiño, F.; Rivera, I.; Plata, M.;
Hydrometallurgy2006, 81, 15.
19. Levenspiel, O.; Ingeniería de las Reacciones Químicas, 3th ed.;
Reverte: Barcelona, 2010, ch. 25.
20. Ballester, A.; Verdeja, L. F.; Sancho, J.; Metalurgia Extractiva Fundamentos, vol. 1; Editorial Síntesis: Madrid, 2000, ch. 7.
21. Sohn, H. Y.; Wadsworth, M. E.; Cinética de los Procesos de la Metalurgia Extractiva; Trillas: México, 1986, ch. 1.
Submitted: December 15, 2011
Published online: April 26, 2012
Figure 10. Alkaline decomposition in NaOH medium. Plot of the reaction total time obtained at an X = 0.75 conversion (experimental vs. calculated).