THE 2004 SUMATRA TSUNAMI EFFECT ON THE ITAJAÍ-AÇU ESTUARY WATER
LEVEL, SANTA CATARINA, BRAZIL
Eliane Cristina Truccolo1*, Carlos Augusto França Schettini2 and Demerval Almeida3
1Universidade Federal do Ceará - Instituto de Ciências do Mar (LABOMAR)
Departamento de Oceanografia
(Av. Abolição, 3207, 88165-081 Fortaleza, CE, Brasil)
2
Universidade Federal de Pernambuco Departamento de Oceanografia
(Av. Prof. Moraes Rego, 1235, 50670-901 Recife, PE, Brasil)
3
FUGRO Brasil Serviços Submarinos e Levantamentos Ltda
(Rua do Geólogo, 76, 28890-000 Zona Especial de Negócios/ZEN, Rio das Ostras, RJ, Brasil)
*Corresponding author: [email protected]
The tsunami of 26th December, 2004 off the coast of Sumatra, in the Indian Ocean, was generated by a megathrust earthquake of magnitude 9.3 on the Richter scale, and felt worldwide (Fig. 1A; TITOV et al., 2005). It was the longest-lasting ever recorded in history, of around 600 seconds, giving rise to a 1,500 km long failure in the seabed (NIO, 2011). The earthquake produced the largest trans-oceanic tsunami in over 40 years, and killed more people than any other tsunami in recorded history (NOAA, 2010), in Indonesia, Sri Lanka, India, Thailand, Myanmar and Somalia. According to Titov et al. (2005), the recorded worldwide effects revealed the unprecedented, truly global reach of the waves generated on 26th December 2004. Its effects were clearly observed nearly two days later in the Itajaí-Açu estuary, on the northern coast of Santa Catarina State, about 15,000 km away from the epicenter (Fig. 1B).
The phenomenon called “tsunami” is constituted by a series of waves, of long wave length and period, generated in a body of water by its violent displacement. It may be generated in an ocean by earthquake, volcanic eruption or landslide. Earthquakes in major subduction zones can produce giant tsunamis like the Sumatra one (DALRYMPLE et al., 2006) and, more recently, that of March 11th, 2011, in Japan. The waves can cross the ocean almost unnoticeably, but when they approach the continental shelf and coastal areas, their velocities decrease leading to an increase in their height due to energy conservation. The Sumatra tsunami generated wave amplitudes of the order of 3 m around the Indian Ocean, far away from its epicenter (Fig. 2A) and which arrived attenuated off southern South-America with an average height of about 0.6 m (Fig. 2B). The Sumatra tsunami was particularly felt on the southern
Atlantic shores of South America, since the mid-ocean ridges guided the wave energy as shown in Figure 1 (TITOV et al., 2005). The observations of the effects of the tsunami on the water level were reported locally by Dragani et al. (2006) for the Rio de La Plata estuary, by França and Mesquita (2007) for three gauges on the Brazilian southeast coast, and more extensively along the Atlantic shores of South America by Candella et al. (2008), among other
unpublished reports found in
http://nctr.pmel.noaa.gov/sumatra20041226.html. The observations agree basically as to the time of arrival of the wave trains, despite the time uncertainties found in the analog records furnished by most of the records available (CANDELLA et al., 2008).
Fig. 1. (A) Global chart showing energy propagation of the 2004 Sumatra tsunami resulting from model applications. Colors show maximum computed tsunami heights. Contours show computed arrival time of tsunami waves (source: TITOV el al., 2005). The red circle indicates the Santa Catarina coast; (B) the Lower Itajaí-Açu estuary with the location of the gauge.
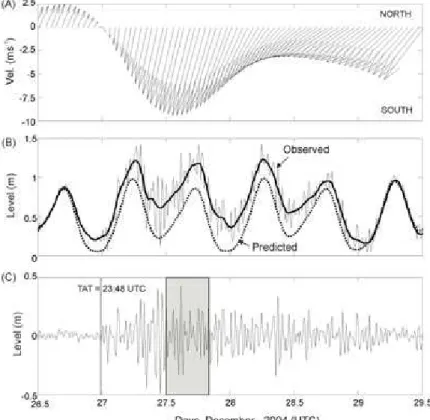
Figure 3 shows the time series of (A) hourly wind vector, (B) observed, filtered and predicted water level, and (C) water level residuals, during the period fromDec 26 toDec 29. All temporal references in this note are in Coordinated Universal Time – UTC. The tsunami signal was described on the basis of the observed water level records by filtering the series with Fourier high pass filter in the frequency domain, with cutoff at 180 minutes, thus eliminating the fluctuations above these limits. The cutoff frequency was chosen in the light of the visual inspection of the time series and of the results of the wavelet decomposition undertaken by Titov et al. (2005). The filtered signal was subtracted from the observed signal to provide the above-tsunami-frequency signals, both the tidal and the sub-tidal ones. The predicted tidal signal was calculated based on harmonic constituents determined by tidal harmonic analysis of 6 months of water level data, using Matlab routines in accordance with Pawlowicz et al. (2002).
The wind time series is presented here to show that on days Dec 27 and 28 the winds were
northerly and relatively strong (Fig. 3A). Northerly winds and the resulting Ekman transport induce a fall in the coastal sea level in the region. Applying a predictive water level model based on wind/atmospheric pressure response (TRUCCOLO et al., 2006), a sub-tidal sea level fall of the order of 0.1 m was expected under these wind conditions. The Itajaí-Açu river discharge can also affect the lower estuary's water level, although only when it is above 1,000 m3s-1. On 26 to 28 Dec, as well as on the preceding days, the river discharge was of the order of 150 m3s-1. The observed sub-tidal water level on Dec 27 and 28 was about 0.2 m above the predicted water level. Adding the meteorological forcing (-0.1 m), the sea-level rise caused by the tsunami was of the order of 0.3 m. The water level set-up was not reported for other sites, although it can be distinguished from the records presented by França and Mesquita (2007; Figure 2B) and Melo and Rocha (2005), but not in the records presented by Dragani et al. (2006) for the northern coast of Argentina.
Fig. 3. Time series of (A) hourly wind vector, (B) 10-minute water level observed (thin line), high-frequency removed (bold line) and predicted (dashed line), and (C) high frequency residuals for the period of December 26 to 29, 2004. TAT: tsunami arrival time. The shadowed area in the lower panel indicates the 1-minute records shown in Figure 5.
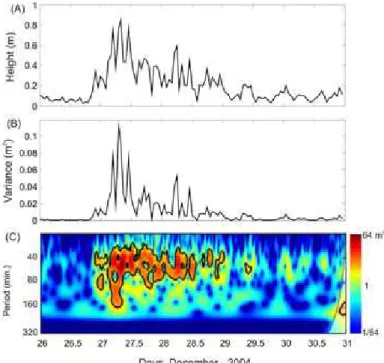
The tsunami arrival time was taken to be that of the first steep rise in the water level with height
having occurred off Sumatra at 00:59 on that same day, thus the time elapsed was of 22 hours 49 minutes. The highest wave was recorded at 10:55 on Dec 27. The wave height was calculated using a 60-minute running window over the data, to find the maximum and minimum values of the residual water level, as well as the variance (Fig. 4A and B). Based on this procedure, the highest wave was of 0.89 m. The local mean tidal height is 0.8 m (SCHETTINI, 2002), which gives a nearly 1:1 rate between the tsunami's and astronomical effects. Figure 4C shows the wavelet energy density spectrum (e.g. GRINSTED et al., 2004) performed over the water level residuals (Fig. 3C). The wavelet results highlight the complexity of the pattern and wave interactions, showing energy peaks at two periods simultaneously at many instants. The tsunami water level disturbance presented an increasing wave height pattern during the first half of Dec 27, decaying during Dec 28, but still showing some disturbance of small magnitude on Dec 29. Figure 5 shows the 1-minute record overlying the 10-minute record to illustrate the complex wave behavior and the effect of frequency sampling (e.g. CANDELLA et al., 2008). The analysis of Figure 5 and the wavelet spectrum for these data brings out the variable duration of the wave period (30 to 52 minutes), the wave height (0.15 to 0.77 m) and its approximately 2-day duration.
The general wave pattern is approximately similar to that of the other relatively close records
(FRANÇA and MESQUITA, 2007; CANDELLA et al., 2008), with the arrival time matching that observed by Ubatuba (23:38, SP, Brazil) and Rio de Janeiro (23:20, RJ, Brazil) gauges to the north, and La Paloma (23:45, Uruguay) to the south, although nearly 40 minutes earlier than those recorded by other gauges (00:30 at Santos, 00:48 at Cananéia, 00:30 at Paranaguá). The time of the arrival of the highest wave varied greatly between the records. The time of maximum height is most probably related to the highly complex wave interactions in shallow waters, affected by diffraction, refraction, reflection and interactions with currents (PUGH, 1987). This pattern seems to be related to the topographical effects and transformation processes which affect these waves. According to Titov et al. (2005), the duration of tsunami and maximum waves arriving later in the first wave train demonstrated an increased input from waves that reached the gauge locations after being scattered or refracted by shallow submarine features and reflected from the coasts. They also argue that, in the case of topographical effects, the multiple refraction and slower propagation of waves constrained by mid-ocean ridge wave guides (such as the Mid-Atlantic Ridge) led to both the later arrival of the largest amplitude waves and the prolonged duration of tsunami activity associated with distinct bathymetric features.
Fig. 5. Time series of residual water level from 1-minute record (full line) over the 10-minute record (dashed line), with indications of individual wave period (at the bottom) and height (at the top).
No direct major damage has been reported in the Itajaí-Açu estuary. However, in the Camboriú river estuary (e.g. SIEGLE et al., 2009), about 20 km south, damage to boats moored in marinas and one case of a boat's being overturned were reported in newspapers. Considering that the Camboriú estuary is shallower and located within a coastal bight, it is likely that the tsunami's effects were amplified there. The Itajaí-Açu estuary is a narrow system with a mean width of 200 m in its lower reach and tidal currents of about 1 m/s (SCHETTINI et al., 2006). There is a very active port straddling the estuary, accessible to Panamax sized ships. It was providential that there was no large-ship movement on Dec 27 or 28, as it might have provoked a local catastrophe, at least in economic and social terms. As an example, in the late 1990’s a container ship ran aground in the estuary mouth closing the harbor for nearly a week. That incident was due to extreme river discharge associated with a storm surge and storm waves. In the case of the 2004 tsunami no warning was emitted. Even though there have been a sequence of huge trans-oceanic events during the last three years, including Samoa (2009), Chile (2010) and Japan (2011), ocean basin scale tsunamis are rare, occurring at an average of 10-12 years in the Pacific (NOAA, 2010), and even more rarely in the Atlantic, local port authorities should be aware of such a risk, as the present case showed.
A
CKNOWLEDGEMENTSWe express our thanks to Vannord/Somar Ltda, who kindly provided the water level records, and to all anonymous reviewers. CAFS – Grant CNPq PQ 306772/2010-8.
R
EFERENCESCANDELLA, R. N.; RABINOVICH, A. B.; THOMSON, R. E. The 2004 Sumatra tsunami as recorded on the Atlantic coast of South America. Adv. Geosci., v. 14, p. 117-128, 2008.
DALRYMPLE, R. A.; GRILLI, S. T.; KIRBY, J. T. Tsunamis and challenges for accurate modeling. Oceanography, v. 19, n. 1, p.142-151, 2006.
DRAGANI, W. C.; D’ONOFRIO, E. E.; GRISMEYER, W.; FIORE, M. E. Tide-gauge observation of the Indian Ocean tsunami, December 26, 2004, in Buenos Aires coastal waters, Argentina. Cont. Shelf Res., v. 26, p. 1543-1550, 2006.
FRANÇA, C. A. S.; MESQUITA, A. R. The December 26th 2004 tsunami recorded along the southeastern coast of Brazil. Nat. Hazards, v. 40, p. 209-222, 2007.
GRINSTED, A.; MOORE, J. C.; JEVREJEVA, S. Application of the cross wavelet transform and wavelet coherence to geophysical time series. Nonlinear Proc. Geoph., v. 11, p. 561-566, 2004.
MELO, E.; ROCHA, C. Sumatra tsunami detected in
Southern Brazil. 2005.
<http://www.pmel.noaa.gov/tsunami/sumatra20041226.h tml>. Accessed May 2011.
NIO - National Institute of Oceanography – India. 2010. <http://www.nio.org/index/option/com_nomenu/task/sho w/tid/85/sid/92/id/146>. Accessed March 2011. NOAA - National Oceanic and Atmospheric Administration.
2010. <http://wcatwc.arh.noaa.gov/about/physics.htm>. Accessed April 2010.
PAWLOWICZ, R.; BEARDSLEY, B.; LENTZ, S. Classical tidal harmonic analysis including error estimates in Matlab using T_Tide. Comput. Geosci., v. 28, p. 929-937, 2002.
PUGH, D. T. Tides, surges and mean sea-level. New York: John Wiley & Sons, 1987. 472 p.
SCHETTINI, C. A. F.; RICKLEFS, K.; TRUCCOLO, E. C.; GOLBIG, V. 2006. Synoptic hydrography of a highly stratified estuary. Ocean Dynam., v.56, p. 308-319, 2006.
SIEGLE, E.; SCHETTINI, C. A. F.; KLEIN, A. H. F.; TOLDO JR., E. E. Hydrodynamics and suspended sediment transport in the Camboriú estuary - Brazil: pre jetty conditions. Braz. J. Oceanogr., v. 57, p. 123-135, 2009.
TITOV, V.; RABINOVICH, A.; MOFJELD, H.; THOMSON, R.; GONZÁLEZ, F. The global reach of the 26 December 2004 Sumatra tsunami. Science, v. 309, n. 5743, p. 2045-2048, 2005.
TRUCCOLO, E. C.; FRANCO, D.; SCHETTINI, C. A. F. The low frequency sea level oscillations in the northern coast of Santa Catarina, Brazil. J. Coast. Res., SI, v. 39, p. 547-552, 2006.
(Manuscript received 25 October 2011; revised