Short Report
Printed in Brazil - ©2017 Sociedade Brasileira de Química0103 - 5053 $6.00+0.00*e-mail: [email protected]
Rosmarinic and Cinnamic Acid Derivatives of
in vitro
Tissue Culture of
Plectranthus
ornatus
: Overproduction and Correlation with Antioxidant Activities
Héctor H. Medrado,a Edlene O. dos Santos,a Erika M. O. Ribeiro,a Jorge M. David,a
Juceni P. David,*,a,b José Fernando Araújo,b Ademir E. do Vale,b Moema C. Bellintani,c
Hugo N. Brandãod and Paloma R. Meirad
aInstituto de Química, bFaculdade de Farmácia and cInstituto de Biologia, Universidade Federal da
Bahia, Campus de Ondina, 40170-290 Salvador-BA, Brazil
dUniversidade Estadual de Feira de Santana, Av. Transnordestina, S/N, Bairro Novo Horizonte,
44036-900 Feira de Santana-BA, Brazil
This work describes the tissue culture of Plectranthus ornatus Codd. (Lamiaceae) on Murashige and Skoog (MS) medium with naphthalene acetic acid (NAA) (1.0, 2.0 and 4.0 mg L-1) and
6-benzylaminopurine (BAP) (1.0, 2.0 and 4.0 mg L- 1) as growth regulators to obtain the overproduction
of rosmarinic acid. The content of rosmarinic acid and its biosynthetic precursors were determined by high performance liquid chromatography (HPLC). The antioxidant activities (AA) of the extracts were also evaluated by 2,2-diphenyl-1-picrylhydrazyl (DPPH) assay. The best growing condition was observed with the addition of 1.0 mg L-1 of both NAA and BAP in the culture medium yielded an
increase of 94 times of rosmarinic acid comparing with the wild plant. All extracts diplayed antioxidant activity, as evidenced by the DPPH free radical scavenging assay. However, those with 2.0 mg L-1
NAA and, 1.0 mg L-1 NAA and BAP in culture medium showed the lowest EC
50 (26.0 and 29.8 µg
mL-1, respectively). At concentration higher than 10 µg mL-1 of rosmarinic acid it was not observed
the correlation with AA, suggesting some other anti-oxidant mechanism acting.
Keywords: rosmarinic acid, Plectranthus ornatus, in vitro tissue culture, caffeic acid
Introduction
Lamiaceae family embraces many important
commercial species, such as sage (Salvia officinalis),
basil (Ocimum basilicum L.) and mint (Mentha sp.).1
Plectranthus is an important genus of this family once their species have been used in folk medicine against a range
of disorders. Plectranthus ornatus Codd is an aromatic
herb known in Brazil as “boldo”, “boldo-de-jardim”, or “boldo-do-Brasil”. This species is used in folk medicine to treat liver failure and dyspepsia. Studies on the chemical
composition of the essential oils of the Plectranthus genus
show that species of this genus are rich in monoterpenes
and sesquiterpenes.2
Their species also contain compounds showing
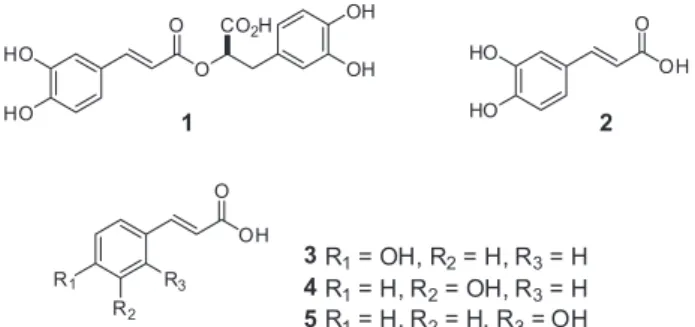
significant biological activity,3 among them rosmarinic
acid (Figure 1) which has attracted the attention due to its broad spectrum of biological activities which include neuroprotective, anti-inflammatory, antimutagenic,
antibacterial and antiviral.4 The cinnamic acid derivatives
are also compounds commonly found in Lamiaceae species and, antioxidant activity is the most characteristic one of
these compounds.5
These bioactive compounds are mostly produced by intact plants in very small yield. Therefore, combining biotechnology techniques for the production of secondary metabolites, especially active compounds by cell culture, provides a new reliable source of natural compounds of
pharmaceutical or commercial interests. So, plant cell culture prospections provide an alternative approach which may be interesting when the cultivation of an specific plant is difficult, it produces significant bioactive compounds and, in some cases, mass cultivation of the source plant may not be possible due to environmental, ecological or climatic conditions. Depending on the type of the vegetal material, extraction of secondary metabolites directly from cultivated plant tissue may be an option. In this context, the callus cultures are the first stage in plant biomass cultivation
processes.6 This work describes a method of in vitro tissue
culture of Plectranthus ornatus for overproduction of
rosmarinic acid (1) and its relation to synthesis of caffeic
and o-, m- and p-hydroxycinnamic acids (2-5) enabling
P. ornatus to become one source of rosmarinic acid.
Experimental
Plant material
Wild P. ornatus were collected nearby of the Instituto
de Química of Universidade Federal da Bahia (UFBA) and identified by Prof Maria L. S. Guedes and a voucher has been previously deposited at the Herbarium of Museu Nacional of Universidade Federal do Rio de Janeiro under number R196538.
Preparation of extracts
The extracts were prepared from in natura specimens
after the leaves, stems and inflorescences separation. The extracts obtained from the callus were obtained from the entire plant material with no distinction between organs
and seedling of P. ornatus. Then, each of these materials
were washed and dried in oven with aeration at 40 °C, and subsequently ground. The ground plant material (5.0 g) was immersed in hot water (80 °C) infusion under stirring for 30 minutes and then filtered. The infusion process was repeated once more with the remaining solid residue from filtration. The two filtrates were combined and added HCl 25% (v/v) until the mixture reached pH 2-3 in order to maintain the compounds of interest in acidic form. Thereafter, the mixture was partitioned three times between
ethyl ether and H2O. The ether portions were dried and
submitted to high performance liquid chromatography with diode array detector (HPLC-DAD) analysis.
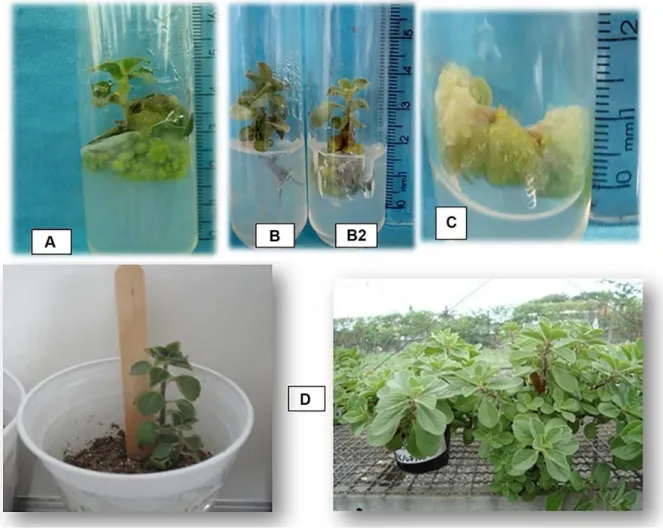
In vitro culture productionand establishmentof P. ornatus
All the explants were obtained from nodal segments, internodes with or without axillary buds, and leaves from
mother (matrices) plants and they were disinfested by washing them in running water for 40 minutes in order to remove possible parasites or insects. Then, in a laminar flow chamber, the parts were immersed in ethanol 70% (v/v) for 1 minute followed by sodium hypochlorite (2.0% of active chlorine) and 3 drops of neutral detergent for 15 minutes. The segments were washed three times in sterile distilled water during 3 min each, after the first rinsed water 1 mL of alcoholic solution of acetic acid was added in order to neutralize the action of the hypochlorite solution.
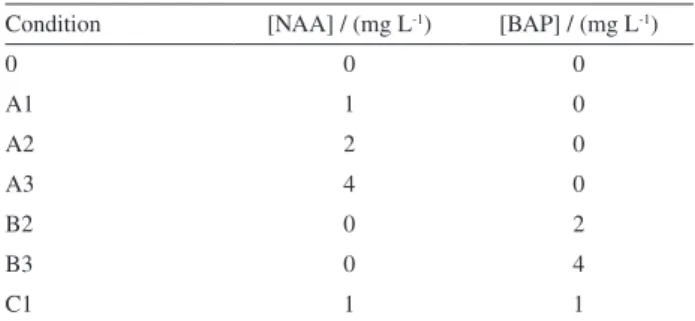
The explants were inoculated into test tubes containing culture medium solidified with agar, sucrose and they were supplemented with auxins (Table 1) NAA (naphthalene acetic acid) and cytokinin BAP (6-benzylaminopurine). The pH was adjusted to 5.7 before autoclaving and, the test tubes containing the medium and the explants were kept in a dark room for eight days. Sequentially, during 30 days they were submitted to the photoperiod of 16 hours/day employing cold white light (Figure 2).
Determination of rosmarinic and cinnamic acid derivatives
The prepared extracts were analyzed in a HPLC equipment (Dionex mod. 3000 Ultimate) with DAD scan range from 200 to 400 nm employing a Shimadzu VP-ODS C-18 chromatography column (150 mm of length, internal diameter 2 mm, and 5 µm particle size). The best HPLC separation was reach with a gradient of MeOH (28 to 62%) and 0.1% acetic acid aqueous solution as mobile phase, in
10 min running time, flow rate of 1.0 mL min-1, at room
temperature and 5 µL of injection volume. The nuclear magnetic resonance (NMR) spectra were recorded in a performed using a Bruker mod. Avance III (resonance
frequencies 300 MHz for 1H and 75 MHz for 13C).
Method validation
The analytical method was validated for each pattern according to the parameters of selectivity, linearity,
Table 1. Concentration in mg L-1 of NAA and BAP in different cultivation conditions
Condition [NAA] / (mg L-1) [BAP] / (mg L-1)
0 0 0
A1 1 0
A2 2 0
A3 4 0
B2 0 2
B3 0 4
precision, and accuracy, limit of detection (LOD) and limit
of quantification (LOQ) according to literature (Table 2).7
Selectivity was determined by comparing the peaks of standards and samples, considering retention time, UV spectra and mass spectra of at least three different points of the chromatograms (beginning, half and end of peaks). Linearity was obtained by calibration curves using a
correlation coefficient (R2). Calibration curves were
obtained by triplicate injections of different concentrations of three solutions of external standards. Standard solutions
were prepared, covering the range from 5.0 to 100.0 g mL-1
for all standard compounds. Peak areas were correlated with the averages of each concentration, and a graph was plotted using the least squares method.
Precision was determined by injection in triplicate of three solutions of the standards. This parameter was expressed as the relative standard deviation according to the equation RS(%) = SD / AC × 100, where SD is the standard deviation and AC is the average concentration
determined. The accuracy was verified by recovery factor, where samples with no analytes were spiked with standard solutions of low, medium and high concentrations. The spiked samples were subjected to the whole process of extraction and were injected into HPLC.
The accuracy was determined by the following equation: Rec(%) = [obtained concentration] / [real concentration] × 100.
The LOD and LOQ were estimated by the ratio of standard deviations and slopes of calibration curves, according to the equations LOD = SDa × 3 / S and LOQ = SDa × 10 / S, where SDa is the standard deviation obtained from the calibration curve and S is the curve’s slope.
Determination of antioxidant activity by DPPH test
The radical scavenging activity of the extracts were
based on protocol previously described.8 The antioxidant
activity was measured at 517 nm using a PerkinElmer UV-Vis Spectrophotometer mod. Lambda 25 and the
activity was expressed as EC50. Briefly, 200 µL of ethanol
extract was added in 3 mL of 60 µmol L-1 by
2,2-diphenyl-1-picrylhydrazyl (DPPH) methanol solution freshly prepared. Standards of pure rosmarinic and caffeic acids (Sigma, 97%) were employed as positive controls and in the control was the blank.
Results and Discussion
All the leaves, stem and root extracts of P. ornatus
were submitted to HPLC-DAD analyses in order to identify the presence of rosmarinic (RA), caffeic (CA),
o-hydroxycinnamic (o-OH-CIN), p-hydroxycinnamic
(p-OH-CIN) and m-hydroxycinnamic (m-OH-CIN) acids
through comparison with pure standards. The choice of these compounds was based on the chemical composition of Plecthrantus genus. Except for the m-hydroxycinnamic acid, all compounds were detected in the extracts obtained
from the innatura and in vitro plant materials. All samples
obtained from different conditions (A1, A2, A3, B2, B3
and C1) of in vitro cultivation are also analyzed. The
chromatograms showed (Figure 3) retention time (tR) of
significant peaks of rosmarinic (tR = 6.3 min) and caffeic
(tR = 2.1 min) acids. Table 3 summarizes the quantification
of all samples prepared.
Despite some samples showed an additional peak at
tR = 4.2 min, with the same tR peak of m-hydroxycinnamic
acid, the UV spectra pattern recorded for this peak showed they were different compounds. Thus it was possible to
confirm that no sample contained m-hydroxycinnamic acid.
The results indicated that rosmarinic and caffeic acids were found in higher concentrations in all samples
analyzed (Table 3). The p-hydroxycinnamic acid was
quantified in much lower concentration compared to
others. The o-hydroxy-cinnamic acid was just detected
with concentrations above LOQ. The matrix plants indicate much lower levels of rosmarinic acid and caffeic acid when compared to all other growing conditions, including the
control sample cultured in vitro without growth regulators
addition (condition 0). Thus, the in vitro cultivated samples of
Plectranthus ornatus showed increased production of these two compounds (increment of 4.5 to 50 times) as shown by the overlap of chromatograms of extracts of both samples, in scale and under the same conditions (Figure 3).
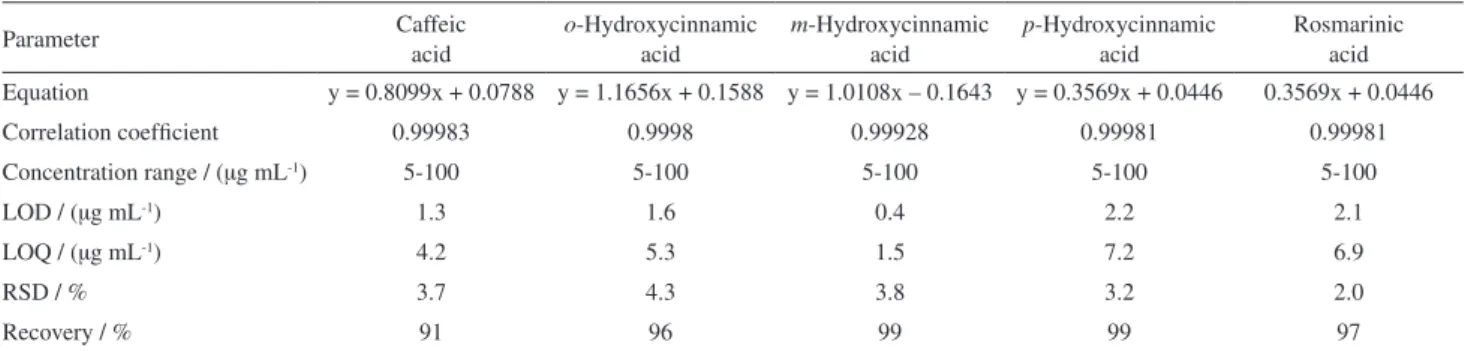
Table 2. Overview of the validation parameters of the cinnamic acid derivatives and rosmarinic acid
Parameter Caffeic
acid
o-Hydroxycinnamic acid
m-Hydroxycinnamic acid
p-Hydroxycinnamic acid
Rosmarinic acid
Equation y = 0.8099x + 0.0788 y = 1.1656x + 0.1588 y = 1.0108x – 0.1643 y = 0.3569x + 0.0446 0.3569x + 0.0446
Correlation coefficient 0.99983 0.9998 0.99928 0.99981 0.99981
Concentration range / (µg mL-1) 5-100 5-100 5-100 5-100 5-100
LOD / (µg mL-1) 1.3 1.6 0.4 2.2 2.1
LOQ / (µg mL-1) 4.2 5.3 1.5 7.2 6.9
RSD / % 3.7 4.3 3.8 3.2 2.0
Recovery / % 91 96 99 99 97
LOD: limit of detection; LOQ: limit of quantification; RSD: relative standard deviation.
The established plants which NAA was employed as growth regulator show that the increasing production of caffeic acid is directly related with the increment concentration of this regulator. Moreover, the synthesis
of rosmarinic acid under A1 (1 mg L-1 NAA) and
A2 (2 mg L-1 NAA) growth conditions showed no
significant change in their concentrations, since the confidence intervals are overlapping. In the samples under B2 and B3 conditions, it was found that the concentration
of BAP in the 2 to 4 mg L-1 intervals favored increment of
40% in the caffeic acid production and reduced 60% the biosynthesis of rosmarinic acid.
The best culture condition was obtained with 1 mg L-1
NAA and 1 mg L-1 BAP addition, which besides producing
callus, decreased the production of caffeic acid and provided the highest yield of rosmarinic acid. This condition among all analyzed samples, exceeding in 96 times the matrix for the production of rosmarinic acid, accumulating 6.2 g of this metabolite for each kilogram of dry plant material.
To confirm these findings, 1H and 13C NMR spectra of
this extract were recorded. Data analyses of them and
comparison with literature data9 permitted to attest it
consists in the majority by rosmarinic acid and also with caffeic acid.
Compared to previous works aiming the production of
rosmarinic acid through in vitro cultivation of plants,10 this
study showed the highest percentage of rosmarinic acid production in relation to the wild mother plant.
The evaluation of the quenching of radical DDPH (EC50)
of the matrix extract, controls (condition 0) and extracts of the different cultivation conditions employing NAA (A1, A2 and A3) and, BAP (B2 and B3) and C1 (BAP + NAA) are described in the Table 4. All evaluated extracts showed
antioxidant activity, and the extracts obtained from in vitro
establishment of P. ornatus exceeded the antioxidant
capacity of the wild plant. The extraction method showed to be adequate to rosmarinic acid and cinnamic acids, since
some extracts concentrated more than 30% of the former compound, combined with high recovery rates shown in accuracy assay method.
In the presence of growth regulators, samples exclusively cultured with NAA (conditions A1, A2 and A3) showed higher antioxidant activity in comparison with the matrix or control. Among the samples grown with BAP, the B2 condition showed higher antioxidant activity. Though the extracts of cultivation conditions B2 and B3 had lower antioxidant activities than those of NAA conditions, they exhibited higher AA than those of matrix and control (condition 0). The results are in accordance with the concentrations of rosmarinic and caffeic acid in these extracts (Table 5). The concentration of rosmarinic acid in the matrix plant extract was lower than caffeic acid,
but higher in all in vitro cultivations.
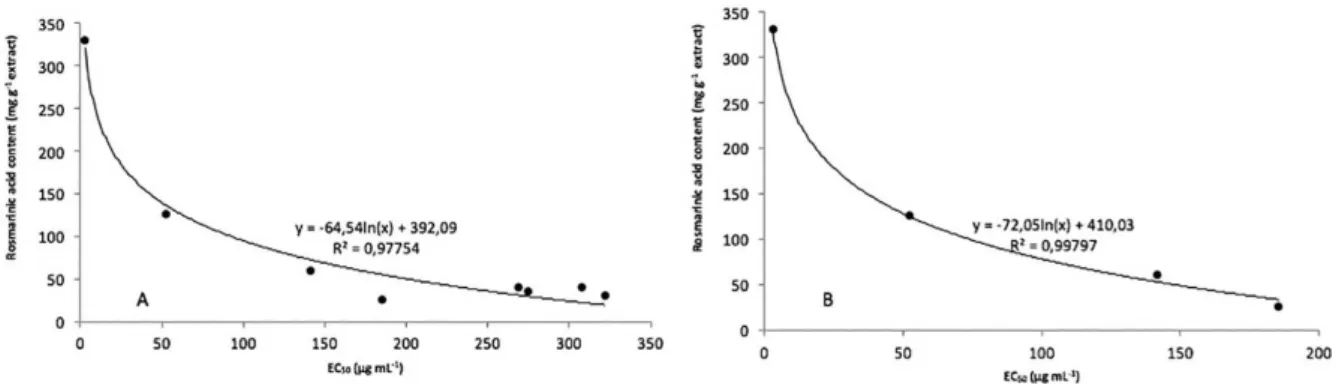
The Figure 4A shows rosmarinic acid contents present
in the extracts and EC50 have a strong correlation of the
logarithmic type (R2 > 0.95). However, it was possible to
observe that extracts with concentrations of rosmarinic
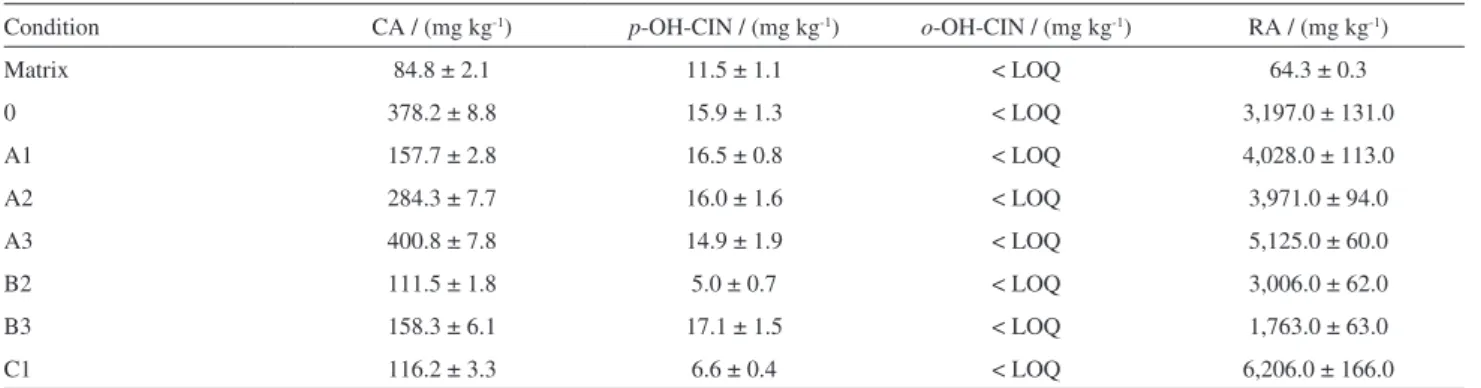
Table 3. Analyte levels (mg kg-1)ain nature and in vitroPlecthrantus ornatus samples
Condition CA / (mg kg-1) p-OH-CIN / (mg kg-1) o-OH-CIN / (mg kg-1) RA / (mg kg-1)
Matrix 84.8 ± 2.1 11.5 ± 1.1 < LOQ 64.3 ± 0.3
0 378.2 ± 8.8 15.9 ± 1.3 < LOQ 3,197.0 ± 131.0
A1 157.7 ± 2.8 16.5 ± 0.8 < LOQ 4,028.0 ± 113.0
A2 284.3 ± 7.7 16.0 ± 1.6 < LOQ 3,971.0 ± 94.0
A3 400.8 ± 7.8 14.9 ± 1.9 < LOQ 5,125.0 ± 60.0
B2 111.5 ± 1.8 5.0 ± 0.7 < LOQ 3,006.0 ± 62.0
B3 158.3 ± 6.1 17.1 ± 1.5 < LOQ 1,763.0 ± 63.0
C1 116.2 ± 3.3 6.6 ± 0.4 < LOQ 6,206.0 ± 166.0
aWeight of dried plant material. CA: caffeic acid; OH-CIN: hydroxy-cinnamic acid; RA: rosmarinic acid.
Table 4. DPPH EC50 of matrix and cultivated P. ornatus extracts, rosmarinic and caffeic acids (results calculated with 95% confidence)
Cultive condition EC50 / (µg mL-1)
Matrix 330.5 ± 7.2
0 126.5 ± 3.0
A1 39.7 ± 2.4
A2 26.0 ± 1.1
A3 35.1 ± 1.4
B2 40.3 ± 2.1
B3 60.3 ± 2.8
C1 29.8 ± 1.5
RA 9.7 ± 0.8
Figure 4. Rosmarinic acid contents and the DPPH (A), rosmarinic acid content (< 190 mg g-1, B) and antioxidant activities of extracts.
Table 5. Rosmarinic (RA) and caffeic (CA) acids contents in the extracts (mg g-1 of extract)
Sample RA / (mg g-1 of extract) CA / (mg g-1 of extract)
Matrix 3.0 ± 0.2 4.1 ± 0.1
0 52.4 ± 2.1 6.2 ± 0.1
A1 308.0 ± 8.6 12.1 ± 0.2
A2 185.4 ± 4.4 13.3 ± 0.4
A3 274.5 ± 3.2 21.5 ± 0.4
B2 268.8 ± 5.6 10.0 ± 0.2
B3 141.4 ± 5.1 12.7 ± 0.5
C1 321.9 ± 8.6 6.0 ± 0.2
acid above 190 mg g-1 the EC
50 values do not respond
proportionally to the increasing concentration (Figure 4B). However, excluding the point of extracts with rosmarinic
acid concentrations above 190 mg g-1 (A1, A3, B2, C1) the
correlation is much stronger (R2 > 0.99).
The lack of linear and logarithmic proportion or any other function can be attributed to the increment of concentration of caffeic acid and other phenolic compounds or, in a specific concentration this compound present pro-oxidative action instead of quenching the radical.
The EC50 values for free radical DPPH scavenging
of rosmarinic and caffeic acid are 9.7 and 6.8 µg mL-1,
respectively. None of the extracts reached EC50 similar
than RA and CA values, which is consistent with the composition of these compounds in extracts.
Conclusions
The in vitro P. ornatus cultivation method for the overproduction of rosmarinic acid was effective with a considerable increasing in rosmarinic acid production comparing with the matrix plant. The best culture condition was obtained with NAA and BAP regulators addition, both
at a concentration of 1 µg mL-1 with a content equal to
6.2 g of rosmarinic acid per kilogram of dry plant material.
So, this method is a contribution to the production of this bioactive natural compound. Free radical DPPH scavenging
assays showed that all extracts of Plectranthus ornatus
were rich in antioxidant compounds. The EC50 values
were correlated with the levels of rosmarinic acid up
to the concentration of 190 mg g-1 of extract. In higher
concentrations of extracts a random variation of EC50 was
observed with increasing concentration of rosmarinic acid. This fact could be attributed to other effects rather than the presence of rosmarinic acid, caffeic acid and other phenolic compounds in the extracts.
Supplementary Information
Supplementary information (1H and 13C NMR spectra
of MeOH extracts of shoots induced from nodal segments cultivated supplemented with BAP and NAA ) is available free of charge at http://jbcs.sbq.org.br as PDF file.
Acknowledgments
The authors thank CNPq (Conselho Nacional do Desenvolvimento Científico e Tecnológico), CAPES (Coordenação de Aperfeiçoaento de Pessoal de Nível Superior) and FAPESB (Fundação de Apoio à Pesquisa do Estado da Bahia) for the grants and scholarships.
References
1. Zgorka, G.; Glowniak, K.; J. Pharm. Biomed. Anal.2001, 26, 79.
2. Passinho-Soares, H. C.; Meira, P. R.; David, J. P.; Mesquita, P. R. R.; do Vale, A. E.; Rodrigues, F. M. R.; Pereira, P. A. P.; de Santana, J. R. F.; de Oliveira, F. S.; de Andrade, J. B.; David, J. M.; Molecules2013, 18, 10320.
3. Lukhoba, C. W.; Simmonds, M. S. J.; Paton, A. J.;
J. Ethnopharmacol. 2006, 103, 1.
5. Liu, G.; Ruedi, P.; Phytochemistry1996, 41, 1563.
6. Yesil-Celiktas, O.; Gurel, A.; Vardar-Sukan, F.; Large Scale Cultivation of Plant Cell and Tissue Culture in Bioreactors,
1st ed.;Transworld Research Network: Kerala, India, 2010. 7.
http://www.ich.org/products/guidelines/quality/quality- single/article/validation-of-analytical-procedures-text-and-methodology.html, accessed in November 2016.
8. Alves, C. Q.; David, J. M.; David, J. P.; Bahia, M. V.; Aguiar, R. M.; Quim. Nova2010, 33, 2202; http://www.cnpat.embrapa.br/ download_publicacao.php?id=210, accessed in August 2016.
9. http://www.bmrb.wisc.edu, accessed in November 2016. 10. Mohagheghzadeh, A.; Shams-Ardakani, M.; Ghannadi,
A.; Minaeian, M.; Fitoterapia2004, 75, 315; Fattahia, M.; Nazerib, V.; Torras-Claveriac, L.; Sefidkond, F.; Cusidoc, R. M.; Zamanib, Z.; Palazonc, J.; Ind. Crops Prod. 2013, 50, 256.
Submitted: September 5, 2016