Inequalities in health in Latin America and
the Caribbean: descriptive and exploratory
results for self–reported health problems
and health care in twelve countries
J. Norberto W. Dachs,
1Marcela Ferrer,
2Carmen Elisa Florez,
3Aluisio J. D. Barros,
4Rory Narváez,
5and Martín Valdivia
6Objective. To explore and describe inequalities in health and use of health care as revealed by self-report in 12 countries of Latin America and the Caribbean.
Methods. A descriptive and exploratory study was performed based on the responses to questions on health and health care utilization that were included in general purpose house-hold surveys. Inequalities are described by quintile of househouse-hold expenditures (or income) per capita, sex, age group (children, adults, and older adults), and place of residence (urban vs. rural area). For those who sought health care, median polishing was performed by economic status and sex, for the three age groups.
Results. Although the study is exploratory and descriptive, its findings show large eco-nomic gradients in health care utilization in these countries, with generally small differences between males and females and higher percentages of women seeking health care than men, al-though there were some exceptions among the lower economic strata in urban areas.
Conclusions. Inequalities in self-reported health problems among the different economic strata were small, and such problems were usually more common among women than men. The presence of small inequalities may be due to cultural and social differences in the percep-tion of health. However, in most countries included in the study, large inequalities were found in the use of health care for the self-reported health problems.
It is important to develop regional projects aimed at improving the questions on self-reported health in household interview surveys so that the determinants of the inequalities in health can be studied in depth. The authors conclude that due to the different patterns of eco-nomic gradients among different age groups and among males and females, the practice of standardization used in constructing concentration curves and in computing concentration indices should be avoided. At the end is a set of recommendations on how to improve these sources of data. Despite their shortcomings, household interview surveys are very useful in understanding the dimensions of health inequalities in these countries.
Health inequalities, use of health services, self-reported health, household sur-veys, Latin America, Caribbean.
ABSTRACT
1 Program on Public Policy and Health, Division of
Health and Human Development, Pan American Health Organization, Washington, D.C., United States of America. Please send all correspondence to either of the following addresses: Pan American Health Organization, 525 Twenty-third Street
N.W., Washington, D.C. 20037, United States of America. E-mail: [email protected]
2 Universidad de Chile, Santiago, Chile.
3 Universidad de los Andes, Santa Fe de Bogotá,
Colombia.
4 Universidade Federal de Pelotas, Pelotas, Rio
Grande do Sul, Brazil.
5 Unidad de Análisis de Políticas Económicas y
Sociales, Ministry of Finance, La Paz, Bolivia.
6 Grupo de Análisis para el Desarrollo (GRADE),
Lima, Peru.
Inequalities in health in Latin Amer-ica and the Caribbean are large and, in some countries, they are increasing, although most average health indica-tors are improving. Most multi-purpose surveys used to measure living stan-dards include a module on health with at least two types of questions: whether a health problem was experienced by anyone in the household and whether health care was sought for the problem. Since these surveys also contain infor-mation from which to compute indica-tors of socioeconomic status for house-holds and individuals, it is possible to relate the observed differences in the responses to these questions to the eco-nomic status of the individuals (1, 2).
Because the question(s) on self-reported health problems evoke sub-jective responses (3) that differ across cultures and socioeconomic strata (4), it is not possible to use them to com-pare results from different countries. However, the responses to the ques-tions on the health care sought for the self-reported health problems are less prone to subjectivity (8), although they do have other limitations, such as re-call bias (5). Notwithstanding all these shortcomings, the exploratory and de-scriptive study presented in this paper shows that much can be learned about these inequalities by a careful analy-sis of these questions. The inequalities found in the utilization of the health system are very large, and would be even larger, perhaps, if these biases were factored into the analysis and the reliability of the data collection instruments used in the surveys were improved.
Data sources and the survey questions
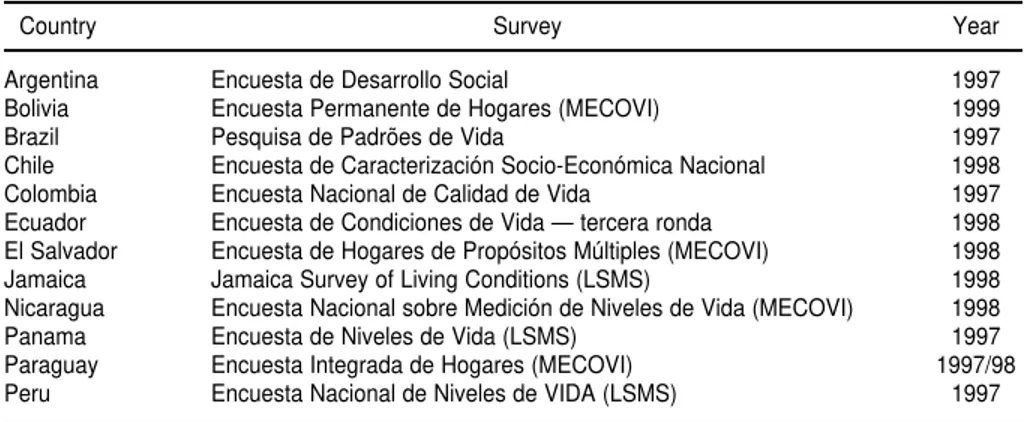
The analysis was based on sec-ondary data obtained from general purpose household surveys that were carried out in 1997, 1998, and 1999 in 11 Latin American countries as well as Jamaica in the Caribbean. With the ex-ception of Argentina, where the sur-vey covered only urban populations (close to 85% of the total population of
the country), and Brazil, where it cov-ered only two areas of the country (the Northeast and Southeast, which to-gether account for approximately 70% of the country’s population), all other surveys were nationwide. Some of them were conducted as part of the World Bank’s Living Standards Mea-surement Study, several others as part of the MECOVI7program of the Inter-American Development Bank, the World Bank, and the Economic Com-mission for Latin America and the Caribbean (ECLAC), and the remain-ing ones within the context of national projects and programs of the various national institutes of statistics or, in Chile, of the Ministry of Planning. Table 1 lists the countries, the names of the surveys, and the years they were conducted.
The question on self-reported illness or injury (“health problem”)
The questions were different in each country, as shown in Appendix 1. The period covered by the question (or
questions) differed greatly, along with the type of disease, sickness, illness, accident, injury, and other condi-tions included. Even if we disregard the fact that self-reporting of illness and accidents varies across cultures and socioeconomic strata (6–7), it is impossible to make comparisons be-tween countries in terms of relative percentages.
There are two countries, Chile and Paraguay, for which the reference pe-riod is “the past three months.” This is a long period and the recall bias is pos-sibly high in these cases. In four other countries—Ecuador, El Salvador, Nic-aragua and Panama—the reference pe-riod is one month, specifically “the past month”. In three countries— Argentina, Brazil and Colombia—the reference period is 30 days, and in the three remaining countries—Bolivia, Jamaica, and Peru—it is four weeks. Questions that refer to “the past month” or the “past three months” are unclear as to the period to which they refer. If the interview was conducted, for example, on September 10, one does not know whether “the past month” refers to the period from Au-gust 10 to September 9 or to the month of August.
What is covered by the question also varies a great deal. All countries in-quire about illnesses and accidents, but several explicitly provide other response choices. In Brazil, the term 7 The acronym MECOVI stands for the name of the
Program in Spanish: Mejoramiento de las En-cuestas y Medición de las Condiciones de Vida. In 2001, the Pan American Health Organization was incorporated as an associate member of this Pro-gram to work specifically in the area of health toward improving the instruments of data collec-tion and stimulating utilizacollec-tion of health services and its determinants.
TABLE 1. Countries, names of the surveys, and years, for 12 countries of Latin America and the Caribbean
Country Survey Year
Argentina Encuesta de Desarrollo Social 1997
Bolivia Encuesta Permanente de Hogares (MECOVI) 1999
Brazil Pesquisa de Padrões de Vida 1997
Chile Encuesta de Caracterización Socio-Económica Nacional 1998
Colombia Encuesta Nacional de Calidad de Vida 1997
Ecuador Encuesta de Condiciones de Vida — tercera ronda 1998
El Salvador Encuesta de Hogares de Propósitos Múltiples (MECOVI) 1998
Jamaica Jamaica Survey of Living Conditions (LSMS) 1998
Nicaragua Encuesta Nacional sobre Medición de Niveles de Vida (MECOVI) 1998
Panama Encuesta de Niveles de Vida (LSMS) 1997
Paraguay Encuesta Integrada de Hogares (MECOVI) 1997/98
“health problems” is used, with differ-ent connotations for differdiffer-ent respon-dents; in Chile, pregnancy is explicitly included; in Colombia and Ecuador, dental problems and aches are response options; and in El Salvador and Ja-maica, crime- or violence-related inju-ries are included among the responses. For the analysis only two categories will be considered: with a “health prob-lem” and without a “health problem.”
The question on seeking health care
In this section, the questions used to define the health care that was sought, as shown in Appendix 1, are discussed. There are important differences across countries that must be considered. In most cases, “health care” was consid-ered a visit to a physician, dentist, or nurse, or, in some cases, a psycholo-gist, a health promoter, or a commu-nity health worker. Commucommu-nity health workers and similar personnel were in-cluded under the assumption that a re-ferral system was in place, something which may not be true in many set-tings, especially in rural areas. There are other countries where different cat-egories had to be used because of the way the question and response options were presented. In Chile, the category was “health care”, and the results will depend on how people in that country interpret this term. In Ecuador, it is not possible to tell whether care was sought from a physician, a nurse, or a traditional healer, and in Jamaica, all potential caregivers, from physician to healer to pharmacist, are lumped to-gether in one category.
In all but two of the countries, El Sal-vador and Jamaica, the questions on “health care” applied only to those members of the household that re-ported having had a “health problem” during the reference period. The analysis in this study was restricted to persons who had a “health problem,” as indicated by a “yes” response to the question.
In Brazil, restricting the question only to those cases in which, besides declar-ing an illness or an accident, there was
also an interruption of normal every-day activities brought down the num-ber of cases available, and it was not possible to perform the analysis for two of the age groups and for rural areas.
Because of all the discrepancies mentioned above, the responses to these questions do not allow for com-parisons among countries in terms of health care services utilization.
The distribution variable
The two variables—presence or ab-sence of a health problem and health care utilization—were analyzed by sex, age group, place of residence (urban vs. rural), and a distribution variable representing the economic status of members of the household. In nine of the countries the distribution variable was total household expendi-ture per capita, and in the remaining three (Argentina, Chile, and Paraguay) it was total household income per capita. When available, household ex-penditure is preferable to income for several reasons. It tends to be less bi-ased, is less prone to seasonal varia-tions, particulary in rural areas, and is considered a better indicator of house-hold economic status overall (15).
This variable was broken down into quintiles, and the percentages of people who reported health problems and having sought health care by age group and sex, as well as by age group and place of residence, were distributed across those quintiles. For Bolivia and Colombia, total household expenditure per capita had to be computed from the original data. For the other 10 countries, total household income or expenditure per capita had already been computed by the institution that conducted the survey. In most cases this was the coun-try’s national institute of statistics, but in Argentina it was SIEMPRO (Sistema de Información, Monitoreo y Evalua-ción de Programas Sociales), a divi-sion of the Ministry of the Economy; in Chile, it was the Ministry of Plan-ning (MIDEPLAN), and in Jamaica, it was the Planning Institute of Jamaica (PIOJ).
The age groups included in the analy-sis were not the same in all countries for two reasons. In Nicaragua, the ques-tions were not asked for children under 6, and in Panama for children under 5. Sample size was the other factor that determined the age groups included in the analysis. In some cases, the sam-ple sizes for some categories ended up being too small in some age groups.
RESULTS
Self-reported “health problem”
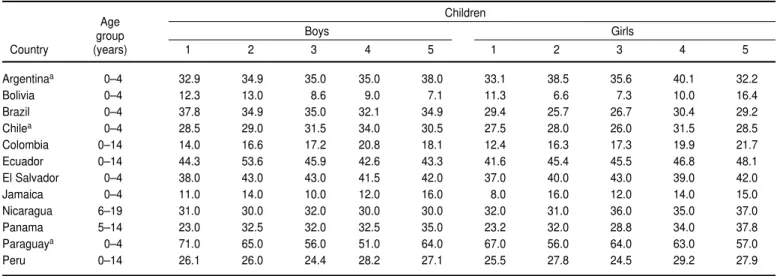
Table 2 shows the percentages of people who declared having had a health problem or an accident, accord-ing to the categories presented above, by quintiles of household expenditure (or income) per capita, for three age groups that were loosely classified as children, adults, and older adults. The table also shows what age groups were included in each country. The choice of age groups was dictated in each country by two different factors. In some countries (see above) the question was not asked for children; in others, the sample sizes would be too small for some categories if the age groups were not increased. Table 3 shows the percentage of people who reported having had a health problem in each of the categories presented above, by quintiles of household ex-penditure (or income) per capita, in urban and rural areas. Sample sizes were not large enough to perform the data analysis by age group, quintiles of household expenditure (or income) per capita, and place of residence com-bined. In Argentina, the survey only covered urban areas, and in Panama the country was divided into four areas classified as urban, rural, hard-to-reach rural, and indigenous.
Self-reported health care
de-TABLE 2. Percentages of persons who were reported as having had a health problem or an accident, by quintile of household expenditure (or income) per capita and by sex, for three age groups in 12 countries of Latin America and the Caribbean
Age Children
group Boys Girls
Country (years) 1 2 3 4 5 1 2 3 4 5
Argentinaa 0–4 32.9 34.9 35.0 35.0 38.0 33.1 38.5 35.6 40.1 32.2
Bolivia 0–4 12.3 13.0 8.6 9.0 7.1 11.3 6.6 7.3 10.0 16.4
Brazil 0–4 37.8 34.9 35.0 32.1 34.9 29.4 25.7 26.7 30.4 29.2
Chilea 0–4 28.5 29.0 31.5 34.0 30.5 27.5 28.0 26.0 31.5 28.5
Colombia 0–14 14.0 16.6 17.2 20.8 18.1 12.4 16.3 17.3 19.9 21.7
Ecuador 0–14 44.3 53.6 45.9 42.6 43.3 41.6 45.4 45.5 46.8 48.1
El Salvador 0–4 38.0 43.0 43.0 41.5 42.0 37.0 40.0 43.0 39.0 42.0
Jamaica 0–4 11.0 14.0 10.0 12.0 16.0 8.0 16.0 12.0 14.0 15.0
Nicaragua 6–19 31.0 30.0 32.0 30.0 30.0 32.0 31.0 36.0 35.0 37.0
Panama 5–14 23.0 32.5 32.0 32.5 35.0 23.2 32.0 28.8 34.0 37.8
Paraguaya 0–4 71.0 65.0 56.0 51.0 64.0 67.0 56.0 64.0 63.0 57.0
Peru 0–14 26.1 26.0 24.4 28.2 27.1 25.5 27.8 24.5 29.2 27.9
Age
Adults
group Men Women
Country (years) 1 2 3 4 5 1 2 3 4 5
Argentinaa 15–64 18.3 18.0 18.9 18.6 17.9 24.4 23.4 23.9 23.8 20.7
Bolivia 15–44 16.7 14.6 10.3 11.3 11.6 28.9 17.1 16.0 14.6 12.4
Brazil 15–44 17.8 16.5 14.1 16.9 17.0 23.1 19.9 18.0 20.5 17.2
Chilea 15–49 15.0 15.0 15.0 15.3 15.9 21.5 20.3 20.5 20.7 20.9
Colombia 15–49 12.2 14.1 14.9 15.6 19.6 14.7 17.8 19.5 20.4 21.2
Ecuador 15–49 40.4 39.9 42.2 40.0 34.9 50.7 48.3 49.7 47.8 46.0
El Salvador 15–49 23.3 21.1 20.9 20.1 19.0 24.3 23.8 23.6 23.4 21.5
Jamaica 15–49 3.0 5.0 3.0 4.0 6.0 6.0 6.0 8.0 7.0 8.0
Nicaragua 20–49 30.0 30.0 32.0 24.0 29.0 36.0 39.0 34.0 35.0 34.0
Panama 15–64 28.0 26.3 26.0 28.8 25.0 37.8 37.3 37.0 39.0 39.3
Paraguaya 15–49 27.4 23.4 18.8 22.1 21.9 32.9 25.7 25.6 26.3 27.8
Peru 15–44 40.3 40.1 28.4 24.8 21.8 24.8 22.9 18.0 17.5 22.0
Age
Older adults
group Men Women
Country (years) 1 2 3 4 5 1 2 3 4 5
Argentinaa 65+ 35.3 40.3 43.0 33.3 26.5 42.8 43.9 42.2 42.5 44.2
Bolivia 65+ 47.4 48.0 47.8 40.9 42.7 51.5 46.8 54.1 42.2 47.7
Brazil 65+ 36.4 37.2 38.1 19.5 18.5 37.9 32.6 34.8 28.0 31.4
Chilea 65+ 33.7 34.2 33.0 30.5 24.9 38.4 40.0 40.3 40.3 43.0
Colombia 50+ 19.0 24.7 25.1 22.8 31.4 23.8 29.2 30.3 34.8 34.7
Ecuador 50+ 56.8 64.5 60.1 56.8 46.5 67.5 71.7 66.2 71.5 59.9
El Salvador 50+ 31.1 29.8 26.3 27.2 26.0 33.5 33.3 37.2 31.5 31.9
Jamaica 65+ 25.0 19.0 24.0 19.0 20.0 30.0 32.0 28.0 25.0 33.0
Nicaragua 50+ 47.0 53.0 57.0 45.0 46.0 48.0 58.0 56.0 60.0 63.0
Panama 65+ 46.3 50.5 42.0 42.0 28.5 52.0 57.0 45.3 49.5 42.0
Paraguaya 50+ 45.8 38.7 33.0 30.2 23.4 52.2 42.4 49.2 43.8 35.7
Peru 65+ 26.6 24.2 24.3 27.2 26.4 44.2 41.1 37.4 32.5 30.1
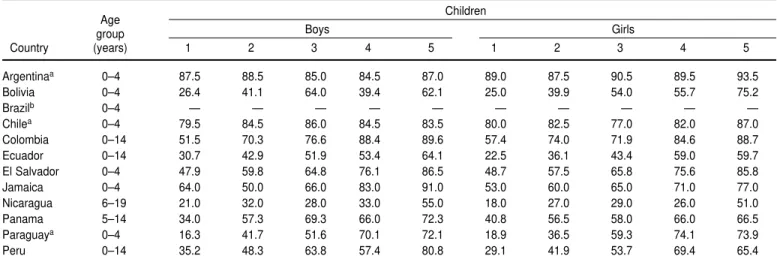
fined for “health problem” above, as well as by sex and quintile of house-hold expenditure (or income) per capita. For Brazil, the results for chil-dren and older adults are not shown since sample sizes were too small in some cells.8Table 5 shows the percent-ages of people who sought health care, by sex, in urban and rural areas. Once again, in Argentina the survey only covered urban areas, and in Panama the country was divided into four areas classified as urban, rural, hard-to-reach rural, and indigenous. In
Brazil the sample sizes were too small in rural areas.
DISCUSSION
Self-reported health problem
Self-reporting of health problems, including accidents, is fraught with difficulties. The first of them is recall bias, which tends to differ depending on social and economic status, sex, and urban and rural residence, and which is impossible to estimate from inter-view survey data. The second one is the fact that in all the surveys included in this study, the reporting was done in most cases by only one member of
the household, usually an adult woman who was more likely to be pre-sent when the interviewer came to ob-tain the data. Reporting minor ail-ments for other adult members of the household is seldom done because the individual providing the information is not always aware they occurred. Another difficulty stems from the fact that culture and the amount of infor-mation people have play a part in the perception of disease. So do an in-dividual’s educational level and eco-nomic status, which determine his/ her access to facts, myths, and so forth. The questions on health problems covered a different period of time in each country; in some cases this was very explicit, and in others quite TABLE 3. Percentages of persons in urban and rural areas who were reported as having had a health problem or an accident, by quintile of household expenditure (or income) per capita and by sex, in 10acountries of Latin America and the Caribbean
Urban Area
Males Females
Country 1 2 3 4 5 1 2 3 4 5
Bolivia 21.5 13.5 10.2 13.3 13.1 20.4 11.7 12.4 14.6 14.3
Brazil 23.8 20.3 20.9 19.0 19.0 25.0 21.2 21.7 21.8 18.9
Chileb 20.0 20.0 20.0 19.5 19.0 24.9 24.2 24.0 24.3 25.5
Colombia 17.0 17.0 17.0 18.0 21.0 18.0 22.0 23.0 27.0 25.0
Ecuador 42.3 45.9 43.7 39.3 37.1 50.0 47.5 48.5 48.6 48.2
El Salvador 22.1 22.7 23.8 23.9 22.3 21.7 25.7 24.4 25.4 24.0
Jamaica 5.4 7.2 5.5 5.3 7.3 5.8 9.0 8.5 7.9 8.1
Nicaragua 27.0 30.0 30.0 25.0 28.0 32.0 34.0 35.0 35.0 37.0
Paraguayb 40.4 30.5 27.7 27.8 28.2 43.9 33.9 31.5 33.2 32.6
Peru 27.7 24.0 17.7 18.7 19.2 30.0 24.3 21.7 22.9 24.8
Rural Area
Males Females
Country 1 2 3 4 5 1 2 3 4 5
Bolivia 20.7 19.7 21.4 18.9 29.6 26.8 21.7 25.4 26.3 40.9
Brazil 23.3 25.1 24.2 31.8 16.1 25.0 27.3 26.3 31.5 12.8
Chileb 22.2 19.5 19.0 18.7 15.2 23.4 22.0 23.0 21.8 20.4
Colombia 12.0 17.0 16.0 22.0 22.0 16.0 20.0 23.0 25.0 31.0
Ecuador 44.9 49.5 50.3 55.5 56.5 50.4 54.7 56.5 58.3 59.2
El Salvador 27.6 28.3 28.7 27.6 32.1 28.2 28.6 32.1 31.6 37.3
Jamaica 8.3 8.9 8.1 8.4 8.9 11.5 11.2 11.9 11.6 16.9
Nicaragua 33.0 34.0 42.0 37.0 47.0 37.0 41.0 42.0 48.0 52.0
Paraguayb 39.3 33.0 26.7 27.5 24.7 40.2 32.6 36.6 33.9 34.6
Peru 25.8 25.3 25.4 20.1 28.5 25.5 30.0 27.9 30.2 33.8
aIn Argentina, the survey covered only urban areas, and in Panama it covered four areas categorized as urban, rural, hard-to-reach rural, and indigenous. bIn Chile and Paraguay, the distribution variable was income per capita.
8 Some cells were too small because they included
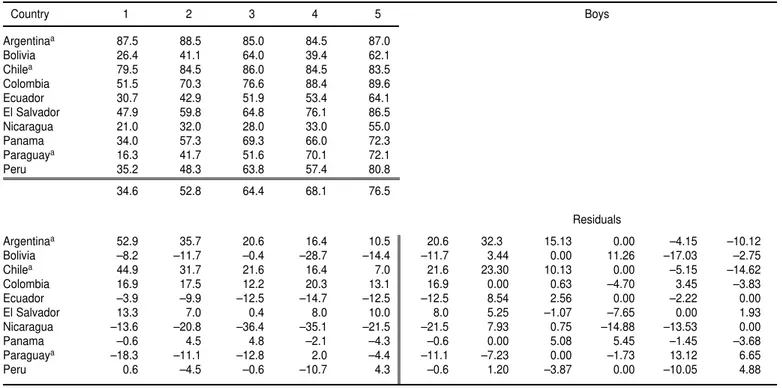
TABLE 4. Percentages of persons who received health care among those who were reported as having had a health problem or an acci-dent, by quintile of household expenditure (or income) per capita and sex, for three age groups, in 12 countries of Latin America and the Caribbean
Age Children
group Boys Girls
Country (years) 1 2 3 4 5 1 2 3 4 5
Argentinaa 0–4 87.5 88.5 85.0 84.5 87.0 89.0 87.5 90.5 89.5 93.5
Bolivia 0–4 26.4 41.1 64.0 39.4 62.1 25.0 39.9 54.0 55.7 75.2
Brazilb 0–4 — — — — — — — — — —
Chilea 0–4 79.5 84.5 86.0 84.5 83.5 80.0 82.5 77.0 82.0 87.0
Colombia 0–14 51.5 70.3 76.6 88.4 89.6 57.4 74.0 71.9 84.6 88.7
Ecuador 0–14 30.7 42.9 51.9 53.4 64.1 22.5 36.1 43.4 59.0 59.7
El Salvador 0–4 47.9 59.8 64.8 76.1 86.5 48.7 57.5 65.8 75.6 85.8
Jamaica 0–4 64.0 50.0 66.0 83.0 91.0 53.0 60.0 65.0 71.0 77.0
Nicaragua 6–19 21.0 32.0 28.0 33.0 55.0 18.0 27.0 29.0 26.0 51.0
Panama 5–14 34.0 57.3 69.3 66.0 72.3 40.8 56.5 58.0 66.0 66.5
Paraguaya 0–4 16.3 41.7 51.6 70.1 72.1 18.9 36.5 59.3 74.1 73.9
Peru 0–14 35.2 48.3 63.8 57.4 80.8 29.1 41.9 53.7 69.4 65.4
Age Adults
group Men Women
Country (years) 1 2 3 4 5 1 2 3 4 5
Argentinaa 15–64 60.3 62.9 75.2 69.4 65.4 70.8 76.8 74.8 76.5 83.4
Bolivia 15–44 29.0 63.6 53.2 68.1 81.7 37.8 52.7 70.2 53.6 86.0
Brazil 15–64 43.8 62.0 61.8 69.6 80.4 53.6 55.7 46.0 74.4 67.2
Chilea 15–49 59.2 65.0 77.5 79.7 78.7 70.2 71.2 71.7 72.0 79.0
Colombia 15–49 56.4 63.0 77.9 79.1 81.4 72.8 74.1 84.4 85.6 87.0
Ecuador 15–49 29.2 39.4 34.2 48.7 50.8 31.4 36.2 36.4 50.6 51.3
El Salvador 15–49 22.5 31.3 40.3 48.8 53.2 31.5 45.2 51.5 59.0 60.8
Jamaica 15–49 57.0 56.0 50.0 68.0 52.0 61.0 54.0 53.0 67.0 62.0
Nicaragua 20–49 22.0 34.0 40.0 43.0 49.0 29.0 35.0 42.0 46.0 50.0
Panama 15–64 33.3 44.3 60.0 61.0 55.3 37.5 54.3 60.5 58.8 60.8
Paraguaya 15–49 23.0 41.5 54.5 60.0 64.5 31.0 42.5 52.5 64.0 66.0
Peru 15–44 22.7 26.9 30.7 37.1 34.1 25.6 34.1 41.1 44.3 45.1
Age Older adults
group Men Women
Country (years) 1 2 3 4 5 1 2 3 4 5
Argentinaa 65+ 71.0 79.0 78.5 82.0 86.5 83.0 85.0 81.5 83.5 87.0
Bolivia 65+ 26.8 40.6 58.0 57.2 75.8 28.3 41.9 59.4 55.5 72.4
Brazilb 65+ — — — — — — — — — —
Chilea 65+ 73.5 80.5 84.5 81.5 89.5 77.0 81.0 83.0 87.0 86.5
Colombia 50+ 57.3 77.9 77.7 93.0 90.2 69.4 79.4 86.3 90.3 92.4
Ecuador 50+ 35.5 44.4 50.5 60.7 63.5 37.4 45.6 42.4 62.0 68.6
El Salvador 50+ 26.3 30.8 41.5 44.6 71.8 35.1 41.5 49.4 53.9 73.5
Jamaica 65+ 54.0 44.0 66.0 66.0 62.0 63.0 57.0 69.0 77.0 78.0
Nicaragua 50+ 34.0 43.0 36.0 48.0 49.0 34.0 37.0 44.0 48.0 54.0
Panama 65+ 35.5 61.5 78.5 78.0 61.3 52.0 66.0 80.0 83.8 79.8
Paraguaya 50+ 31.6 49.2 59.9 63.4 67.1 42.6 44.6 60.5 71.6 86.7
Peru 65+ 36.2 36.6 49.1 60.8 66.4 25.9 37.8 48.8 52.7 64.2
vague. This explains to a large extent the observed differences in the aver-age percentaver-ages of people for whom a health problem was reported, which range from close to 12% in Jamaica and Bolivia to over 60% in Paraguay among children, from 5% in Jamaica to almost 40% in Ecuador among adults, and from close to 20% in Jamaica to al-most 60% in Ecuador among older adults. Interestingly, the percentages were not highest in Chile and Nicara-gua, the two countries having the long-est reference period (three months). In most countries, there was little urban/ rural variation for the averages, but there were large disparities according to economic status.
One of the reasons for the much lower percentages observed in Jamaica, the only English-speaking country in the study, may have been the phrasing of the question regarding a perceived health problem—“Have you had any illness?”—and gave a cold and diar-rhea as response options. This may have kept individuals who had a chronic illness or other health problems from answering yes to the question. The Jamaican survey also included questions about how long the illness lasted and how many days the individ-ual who was ill had to interrupt his/her “normal activities” because of it. The average number of days the ill-ness or injury lasted was 11, and the
av-erage number of days of inactivity due to this illness or injury was 6 (8). These figures suggest that only the more se-vere cases were being reported by the persons interviewed in this survey.
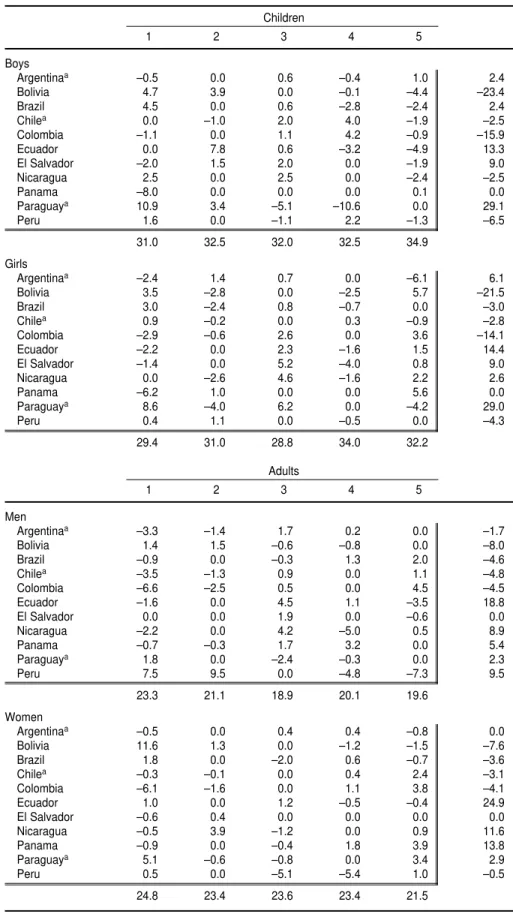
Tables 6 and 7 show the results of median polishing for the data in Tables 1 and 2 (see Appendix 2 for a technical description of the method). Jamaica was excluded from the polish-ing partly because in that country the percentages for the five quintiles of ex-penditure per capita behaved errati-cally, perhaps because the two ques-tions asked in the interview survey were worded in a complicated way.
In general, there is very little varia-tion across expenditure (or income) TABLE 5. Percentages of people in urban and rural areas who sought health care among those who were reported as having had a health problem or an accident, by quintile of household expenditure (or income) per capita and sex, in 10acountries of Latin America and the Caribbean
Urban area
Males Females
Country 1 2 3 4 5 1 2 3 4 5
Bolivia 52.8 55.5 60.4 57.4 72.0 26.5 37.6 56.8 60.7 79.8
Brazil 50.5 61.0 57.2 71.9 67.3 58.3 59.3 55.0 68.5 75.7
Chileb 71.5 74.2 74.7 74.7 78.4 74.5 74.9 75.0 76.9 82.2
Colombia 59.0 73.0 82.0 87.0 85.0 74.0 80.0 83.0 88.0 89.0
Ecuador 37.5 46.4 43.0 51.5 55.9 34.5 38.8 37.7 54.1 57.5
El Salvador 42.3 44.7 50.8 57.6 66.0 35.1 49.7 52.8 59.5 68.5
Jamaica 67.4 45.0 59.6 63.1 61.5 62.5 46.4 53.6 71.3 64.6
Nicaragua 21.0 38.0 37.0 37.0 47.0 22.0 32.0 36.0 44.0 51.0
Paraguayb 27.6 38.0 56.9 56.6 63.4 33.6 40.0 58.8 68.7 74.4
Peru 25.6 38.2 40.9 45.1 50.1 20.2 39.6 44.2 50.5 54.8
Rural area
Males Females
Country 1 2 3 4 5 1 2 3 4 5
Bolivia 26.1 34.0 58.0 46.6 75.0 25.6 40.3 56.8 49.6 71.2
Brazil 43.1 49.3 53.0 63.1 78.7 37.3 49.7 63.2 59.1 100.0
Chileb 57.7 63.0 63.7 66.0 61.4 65.0 70.7 73.2 73.9 71.4
Colombia 51.0 63.0 63.0 75.0 84.0 64.0 66.0 77.0 78.0 84.0
Ecuador 29.1 37.4 40.3 53.5 63.2 28.8 37.8 42.8 55.4 52.0
El Salvador 28.5 35.5 42.3 49.1 57.3 34.3 44.8 51.1 63.9 63.3
Jamaica 55.3 49.1 56.0 67.8 57.6 60.7 62.7 65.4 72.7 71.1
Nicaragua 24.0 34.0 34.0 37.0 49.0 27.0 34.0 38.0 38.0 50.0
Paraguayb 19.2 35.0 45.4 57.9 50.4 24.4 36.4 51.7 55.5 64.5
Peru 28.5 26.9 38.3 43.5 39.3 25.5 29.7 44.6 47.2 35.6
TABLE 6. Results of median polishing for percentages of persons who were reported as having had a health problem by quintile of household expenditure (or income) per capita and by sex, for three age groups in 11 countries of Latin America
Children
1 2 3 4 5
Boys
Argentinaa –0.5 0.0 0.6 –0.4 1.0 2.4
Bolivia 4.7 3.9 0.0 –0.1 –4.4 –23.4
Brazil 4.5 0.0 0.6 –2.8 –2.4 2.4
Chilea 0.0 –1.0 2.0 4.0 –1.9 –2.5
Colombia –1.1 0.0 1.1 4.2 –0.9 –15.9
Ecuador 0.0 7.8 0.6 –3.2 –4.9 13.3
El Salvador –2.0 1.5 2.0 0.0 –1.9 9.0
Nicaragua 2.5 0.0 2.5 0.0 –2.4 –2.5
Panama –8.0 0.0 0.0 0.0 0.1 0.0
Paraguaya 10.9 3.4 –5.1 –10.6 0.0 29.1
Peru 1.6 0.0 –1.1 2.2 –1.3 –6.5
31.0 32.5 32.0 32.5 34.9
Girls
Argentinaa –2.4 1.4 0.7 0.0 –6.1 6.1
Bolivia 3.5 –2.8 0.0 –2.5 5.7 –21.5
Brazil 3.0 –2.4 0.8 –0.7 0.0 –3.0
Chilea 0.9 –0.2 0.0 0.3 –0.9 –2.8
Colombia –2.9 –0.6 2.6 0.0 3.6 –14.1
Ecuador –2.2 0.0 2.3 –1.6 1.5 14.4
El Salvador –1.4 0.0 5.2 –4.0 0.8 9.0
Nicaragua 0.0 –2.6 4.6 –1.6 2.2 2.6
Panama –6.2 1.0 0.0 0.0 5.6 0.0
Paraguaya 8.6 –4.0 6.2 0.0 –4.2 29.0
Peru 0.4 1.1 0.0 –0.5 0.0 –4.3
29.4 31.0 28.8 34.0 32.2
Adults
1 2 3 4 5
Men
Argentinaa –3.3 –1.4 1.7 0.2 0.0 –1.7
Bolivia 1.4 1.5 –0.6 –0.8 0.0 –8.0
Brazil –0.9 0.0 –0.3 1.3 2.0 –4.6
Chilea –3.5 –1.3 0.9 0.0 1.1 –4.8
Colombia –6.6 –2.5 0.5 0.0 4.5 –4.5
Ecuador –1.6 0.0 4.5 1.1 –3.5 18.8
El Salvador 0.0 0.0 1.9 0.0 –0.6 0.0
Nicaragua –2.2 0.0 4.2 –5.0 0.5 8.9
Panama –0.7 –0.3 1.7 3.2 0.0 5.4
Paraguaya 1.8 0.0 –2.4 –0.3 0.0 2.3
Peru 7.5 9.5 0.0 –4.8 –7.3 9.5
23.3 21.1 18.9 20.1 19.6
Women
Argentinaa –0.5 0.0 0.4 0.4 –0.8 0.0
Bolivia 11.6 1.3 0.0 –1.2 –1.5 –7.6
Brazil 1.8 0.0 –2.0 0.6 –0.7 –3.6
Chilea –0.3 –0.1 0.0 0.4 2.4 –3.1
Colombia –6.1 –1.6 0.0 1.1 3.8 –4.1
Ecuador 1.0 0.0 1.2 –0.5 –0.4 24.9
El Salvador –0.6 0.4 0.0 0.0 0.0 0.0
Nicaragua –0.5 3.9 –1.2 0.0 0.9 11.6
Panama –0.9 0.0 –0.4 1.8 3.9 13.8
Paraguaya 5.1 –0.6 –0.8 0.0 3.4 2.9
Peru 0.5 0.0 –5.1 –5.4 1.0 –0.5
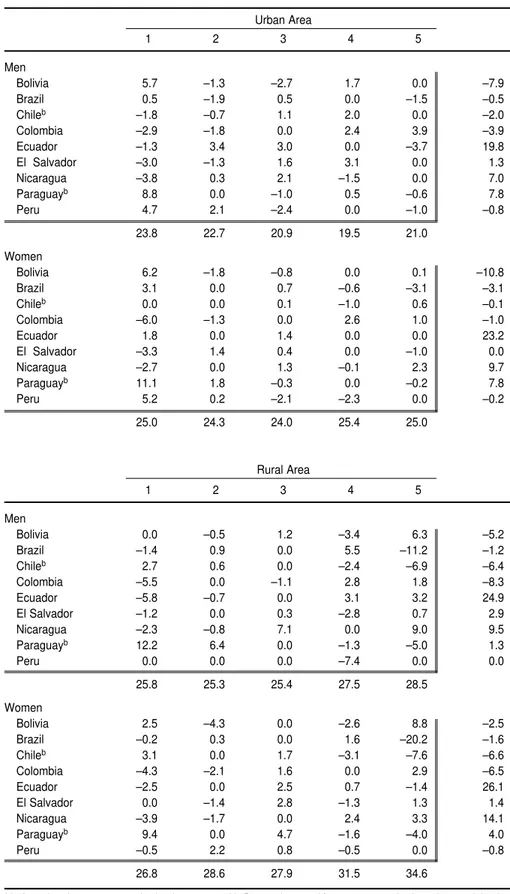
quintiles for all age groups in urban and rural areas, with the exception of women in rural areas, who showed higher percentages in the quintiles of greater expenditure per capita. Al-though our analysis is merely ex-ploratory and descriptive in nature, the fact that the residuals are “small” in almost every case supports the statement that there are no important differences across the various eco-nomic strata in the frequency of self-reported health problems in these countries.
The differences by sex are also gener-ally small, except among older adults. In this group, the percentage of women with a self-reported health problem was between 5 and 15 points higher than for men, which is partly due to the
fact that women live longer than men and thus, in older age groups, there are proportionately more women in poor health.
Again no comparisons across coun-tries can be made for the reasons al-ready explained.
Health care
The percentages of children who sought health care for their reported health problems ranged from close to 30 in Nicaragua to over 80 in Chile and Argentina. These differences are due in part to greater access to health care in some countries than others, but also to the seriousness of the “problem” being reported, which may differ, in
turn, depending on the phrasing of the questions asked to obtain that in-formation. If the problems were more serious in one case than another, the percentage of health care utilization would be higher in the country report-ing the more serious problems, even for similar levels of access to care. An-other factor that can influence these results is the perception of health and disease, which varies according to cul-tural and socioeconomic background. Colombia and Peru are good exam-ples. The questions included in the sur-veys were similar in both countries. The percentage of children that were reported as having had a health prob-lem was close to 10% higher in Peru than in Colombia across all quintiles of expenditure per capita (see Tables 2 TABLE 6. (Continued)
Older Adults
1 2 3 4 5
Men
Argentinaa –2.7 0.0 3.3 1.2 –1.6 1.6
Bolivia 0.6 –1.1 –0.6 0.0 5.9 10.4
Brazil 1.5 0.0 1.5 –9.5 –6.4 –1.5
Chilea 0.0 –1.8 –2.3 2.8 1.2 –2.8
Colombia –4.5 –1.0 0.0 5.3 17.9 –13.0
Ecuador –1.7 3.7 0.0 4.3 –2.0 22.1
El Salvador 0.0 –3.6 –6.4 2.1 4.9 –5.4
Nicaragua –3.9 –0.2 4.4 0.0 5.0 14.5
Panama 0.0 2.0 –5.9 1.7 –7.8 9.8
Paraguaya 9.7 0.3 –4.8 0.0 –2.8 –0.3
Peru 0.0 –4.7 –4.0 6.5 9.8 –9.8
36.4 38.7 38.1 30.5 26.5
Women
Argentinaa –1.8 1.2 –0.3 0.0 1.8 0.3
Bolivia 1.5 –1.3 6.2 –5.7 0.0 5.7
Brazil 3.4 0.0 2.4 –4.4 –0.8 –9.8
Chilea –4.0 –0.5 0.0 0.0 2.9 –1.9
Colombia –8.6 –1.4 0.0 4.5 4.6 –11.8
Ecuador –0.8 5.3 0.0 5.3 –6.1 24.0
El Salvador –0.6 1.0 5.2 –0.6 0.0 –10.2
Nicaragua –11.8 0.0 –1.8 2.2 5.4 15.6
Panama 0.4 7.3 –4.2 0.0 –7.3 7.3
Paraguaya 6.3 –1.6 5.4 0.0 –7.9 1.6
Peru 4.8 3.5 0.0 –4.9 –7.1 –4.8
44.2 42.4 42.2 42.2 42.0
TABLE 7. Results of median polishing for the percentages of persons in urban and rural areas who were reported as having had a health problem, by quintile of household expen-diture (or income) per capita and sex, in nineacountries of Latin America
Urban Area
1 2 3 4 5
Men
Bolivia 5.7 –1.3 –2.7 1.7 0.0 –7.9
Brazil 0.5 –1.9 0.5 0.0 –1.5 –0.5
Chileb –1.8 –0.7 1.1 2.0 0.0 –2.0
Colombia –2.9 –1.8 0.0 2.4 3.9 –3.9
Ecuador –1.3 3.4 3.0 0.0 –3.7 19.8
El Salvador –3.0 –1.3 1.6 3.1 0.0 1.3
Nicaragua –3.8 0.3 2.1 –1.5 0.0 7.0
Paraguayb 8.8 0.0 –1.0 0.5 –0.6 7.8
Peru 4.7 2.1 –2.4 0.0 –1.0 –0.8
23.8 22.7 20.9 19.5 21.0
Women
Bolivia 6.2 –1.8 –0.8 0.0 0.1 –10.8
Brazil 3.1 0.0 0.7 –0.6 –3.1 –3.1
Chileb 0.0 0.0 0.1 –1.0 0.6 –0.1
Colombia –6.0 –1.3 0.0 2.6 1.0 –1.0
Ecuador 1.8 0.0 1.4 0.0 0.0 23.2
El Salvador –3.3 1.4 0.4 0.0 –1.0 0.0
Nicaragua –2.7 0.0 1.3 –0.1 2.3 9.7
Paraguayb 11.1 1.8 –0.3 0.0 –0.2 7.8
Peru 5.2 0.2 –2.1 –2.3 0.0 –0.2
25.0 24.3 24.0 25.4 25.0
Rural Area
1 2 3 4 5
Men
Bolivia 0.0 –0.5 1.2 –3.4 6.3 –5.2
Brazil –1.4 0.9 0.0 5.5 –11.2 –1.2
Chileb 2.7 0.6 0.0 –2.4 –6.9 –6.4
Colombia –5.5 0.0 –1.1 2.8 1.8 –8.3
Ecuador –5.8 –0.7 0.0 3.1 3.2 24.9
El Salvador –1.2 0.0 0.3 –2.8 0.7 2.9
Nicaragua –2.3 –0.8 7.1 0.0 9.0 9.5
Paraguayb 12.2 6.4 0.0 –1.3 –5.0 1.3
Peru 0.0 0.0 0.0 –7.4 0.0 0.0
25.8 25.3 25.4 27.5 28.5
Women
Bolivia 2.5 –4.3 0.0 –2.6 8.8 –2.5
Brazil –0.2 0.3 0.0 1.6 –20.2 –1.6
Chileb 3.1 0.0 1.7 –3.1 –7.6 –6.6
Colombia –4.3 –2.1 1.6 0.0 2.9 –6.5
Ecuador –2.5 0.0 2.5 0.7 –1.4 26.1
El Salvador 0.0 –1.4 2.8 –1.3 1.3 1.4
Nicaragua –3.9 –1.7 0.0 2.4 3.3 14.1
Paraguayb 9.4 0.0 4.7 –1.6 –4.0 4.0
Peru –0.5 2.2 0.8 –0.5 0.0 –0.8
26.8 28.6 27.9 31.5 34.6
aIn Argentina, the survey covered only urban areas and in Panama it covered four areas categorized as urban, rural,
hard-to-reach rural, and indigenous.
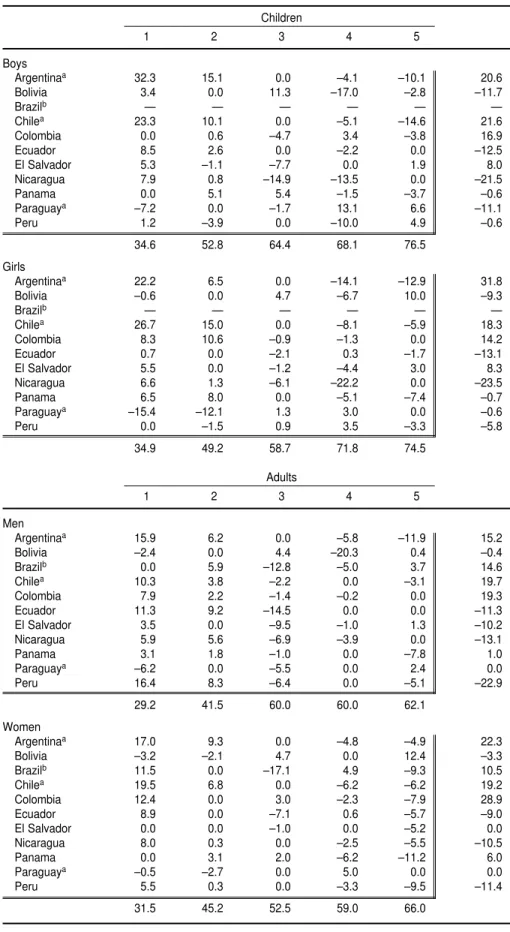
TABLE 8. Results of median polishing for the percentages of persons who received health care, by quintile of household expenditure (or income) per capita and sex, for three age groups in 11 countries of Latin America
Children
1 2 3 4 5
Boys
Argentinaa 32.3 15.1 0.0 –4.1 –10.1 20.6
Bolivia 3.4 0.0 11.3 –17.0 –2.8 –11.7
Brazilb — — — — — —
Chilea 23.3 10.1 0.0 –5.1 –14.6 21.6
Colombia 0.0 0.6 –4.7 3.4 –3.8 16.9
Ecuador 8.5 2.6 0.0 –2.2 0.0 –12.5
El Salvador 5.3 –1.1 –7.7 0.0 1.9 8.0
Nicaragua 7.9 0.8 –14.9 –13.5 0.0 –21.5
Panama 0.0 5.1 5.4 –1.5 –3.7 –0.6
Paraguaya –7.2 0.0 –1.7 13.1 6.6 –11.1
Peru 1.2 –3.9 0.0 –10.0 4.9 –0.6
34.6 52.8 64.4 68.1 76.5
Girls
Argentinaa 22.2 6.5 0.0 –14.1 –12.9 31.8
Bolivia –0.6 0.0 4.7 –6.7 10.0 –9.3
Brazilb — — — — — —
Chilea 26.7 15.0 0.0 –8.1 –5.9 18.3
Colombia 8.3 10.6 –0.9 –1.3 0.0 14.2
Ecuador 0.7 0.0 –2.1 0.3 –1.7 –13.1
El Salvador 5.5 0.0 –1.2 –4.4 3.0 8.3
Nicaragua 6.6 1.3 –6.1 –22.2 0.0 –23.5
Panama 6.5 8.0 0.0 –5.1 –7.4 –0.7
Paraguaya –15.4 –12.1 1.3 3.0 0.0 –0.6
Peru 0.0 –1.5 0.9 3.5 –3.3 –5.8
34.9 49.2 58.7 71.8 74.5
Adults
1 2 3 4 5
Men
Argentinaa 15.9 6.2 0.0 –5.8 –11.9 15.2
Bolivia –2.4 0.0 4.4 –20.3 0.4 –0.4
Brazilb 0.0 5.9 –12.8 –5.0 3.7 14.6
Chilea 10.3 3.8 –2.2 0.0 –3.1 19.7
Colombia 7.9 2.2 –1.4 –0.2 0.0 19.3
Ecuador 11.3 9.2 –14.5 0.0 0.0 –11.3
El Salvador 3.5 0.0 –9.5 –1.0 1.3 –10.2
Nicaragua 5.9 5.6 –6.9 –3.9 0.0 –13.1
Panama 3.1 1.8 –1.0 0.0 –7.8 1.0
Paraguaya –6.2 0.0 –5.5 0.0 2.4 0.0
Peru 16.4 8.3 –6.4 0.0 –5.1 –22.9
29.2 41.5 60.0 60.0 62.1
Women
Argentinaa 17.0 9.3 0.0 –4.8 –4.9 22.3
Bolivia –3.2 –2.1 4.7 0.0 12.4 –3.3
Brazilb 11.5 0.0 –17.1 4.9 –9.3 10.5
Chilea 19.5 6.8 0.0 –6.2 –6.2 19.2
Colombia 12.4 0.0 3.0 –2.3 –7.9 28.9
Ecuador 8.9 0.0 –7.1 0.6 –5.7 –9.0
El Salvador 0.0 0.0 –1.0 0.0 –5.2 0.0
Nicaragua 8.0 0.3 0.0 –2.5 –5.5 –10.5
Panama 0.0 3.1 2.0 –6.2 –11.2 6.0
Paraguaya –0.5 –2.7 0.0 5.0 0.0 0.0
Peru 5.5 0.3 0.0 –3.3 –9.5 –11.4
and 6), yet children who sought health care in Peru were approximately 17% fewer than in Colombia. If one com-putes the percentage of children in the entire population for whom health care was sought, the figures from both countries are nearly identical for all five quintiles. They are 9.2% in Colom-bia and 7.4% in Peru in the first expen-diture quintile; 12.6% and 11.6%, re-spectively, in the second quintile; 15.6% and 13.2 in the third quintile, 16.2 and 20.3 in the fourth, and 21.9 and 18.2 in the fifth. They were almost invariably higher in Colombia, but never by more than 2% or 3%.
Among children, practically no dif-ferences were detected between boys and girls in any of the countries in terms of utilization of health care. The
only exceptions were Argentina and Paraguay, where, on average, about 10% more girls than boys sought health care, and in Peru, where the percentages for girls were somewhat lower than for boys.
In all countries except Paraguay, pro-portionately fewer adults than children sought health care for their reported health problems. There was also less variation among adults than children in all countries. With the exception of Brazil, health care was sought by higher percentages of women than men, on average, although health care usage among men and women was very similar in Bolivia, Chile, Colom-bia, and Ecuador.
The percentages of individuals who sought health care was higher among
older adults, as was to be expected, and there was small variability from one country to another. With the ex-ception of Peru, percentages of health care use were on average higher for women than men among older adults. They were almost identical in Bolivia and Ecuador. Although in a few coun-tries percentages were very similar in urban and rural areas, they were al-most always higher in urban areas among individuals of either sex. The only exception was Jamaica, where the number of women who sought health care in rural areas was almost 10% higher than in urban areas.
The percentage of people who sought health care in the upper qutile of household expenditure (or in-come) per capita was on average close TABLE 8. (Continued)
Older Adults
1 2 3 4 5
Men
Argentinaa 15.6 12.3 –0.4 0.0 –2.8 19.9
Bolivia –3.8 –1.3 3.9 0.0 11.3 –4.9
Brazilb
Chilea 12.4 8.2 0.0 –6.1 –5.5 25.5
Colombia 0.0 9.3 –3.0 9.1 –1.0 21.8
Ecuador 2.4 0.0 –6.0 1.0 –3.5 –2.4
El Salvador 6.7 0.0 –1.5 –1.6 18.3 –16.0
Nicaragua 12.6 10.3 –8.9 0.0 –6.3 –14.1
Panama –14.7 0.0 4.8 1.2 –22.9 14.7
Paraguaya –4.9 1.5 0.0 0.4 –3.3 0.9
Peru 3.7 –7.2 –6.8 1.7 0.0 –3.0
35.5 46.8 59.0 62.1 69.4
Women
Argentinaa 21.5 18.4 0.0 –4.8 –11.2 21.5
Bolivia –7.5 1.0 3.7 –7.1 0.0 –4.3
Brazilb
Chilea 14.0 12.9 0.0 –2.8 –13.2 23.0
Colombia 5.9 10.8 –1.7 0.0 –7.7 23.5
Ecuador 2.2 5.3 –12.8 0.0 –3.2 –4.8
El Salvador 0.0 1.3 –5.7 –8.1 1.8 –4.9
Nicaragua 10.0 7.9 0.0 –2.8 –6.7 –16.0
Panama –4.9 3.9 3.1 0.0 –13.8 17.0
Paraguaya 0.0 –3.1 –2.1 2.2 7.5 2.6
Peru –1.7 5.1 1.3 –1.7 0.0 –12.4
40.0 45.1 60.0 66.8 76.6
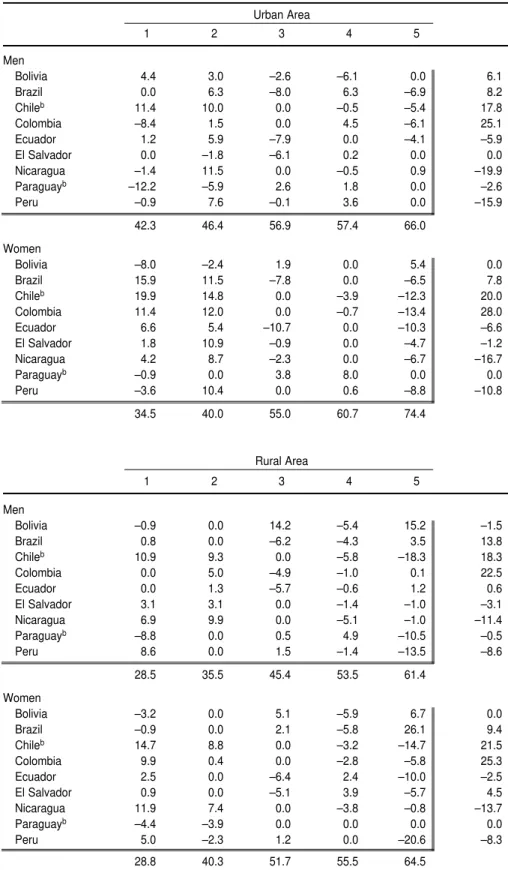
TABLE 9. Results of median polishing for the percentages of persons in urban and rural areas who received health care, by quintile of expenditure (or income) per capita and sex, in nineacountries of Latin America
Urban Area
1 2 3 4 5
Men
Bolivia 4.4 3.0 –2.6 –6.1 0.0 6.1
Brazil 0.0 6.3 –8.0 6.3 –6.9 8.2
Chileb 11.4 10.0 0.0 –0.5 –5.4 17.8
Colombia –8.4 1.5 0.0 4.5 –6.1 25.1
Ecuador 1.2 5.9 –7.9 0.0 –4.1 –5.9
El Salvador 0.0 –1.8 –6.1 0.2 0.0 0.0
Nicaragua –1.4 11.5 0.0 –0.5 0.9 –19.9
Paraguayb –12.2 –5.9 2.6 1.8 0.0 –2.6
Peru –0.9 7.6 –0.1 3.6 0.0 –15.9
42.3 46.4 56.9 57.4 66.0
Women
Bolivia –8.0 –2.4 1.9 0.0 5.4 0.0
Brazil 15.9 11.5 –7.8 0.0 –6.5 7.8
Chileb 19.9 14.8 0.0 –3.9 –12.3 20.0
Colombia 11.4 12.0 0.0 –0.7 –13.4 28.0
Ecuador 6.6 5.4 –10.7 0.0 –10.3 –6.6
El Salvador 1.8 10.9 –0.9 0.0 –4.7 –1.2
Nicaragua 4.2 8.7 –2.3 0.0 –6.7 –16.7
Paraguayb –0.9 0.0 3.8 8.0 0.0 0.0
Peru –3.6 10.4 0.0 0.6 –8.8 –10.8
34.5 40.0 55.0 60.7 74.4
Rural Area
1 2 3 4 5
Men
Bolivia –0.9 0.0 14.2 –5.4 15.2 –1.5
Brazil 0.8 0.0 –6.2 –4.3 3.5 13.8
Chileb 10.9 9.3 0.0 –5.8 –18.3 18.3
Colombia 0.0 5.0 –4.9 –1.0 0.1 22.5
Ecuador 0.0 1.3 –5.7 –0.6 1.2 0.6
El Salvador 3.1 3.1 0.0 –1.4 –1.0 –3.1
Nicaragua 6.9 9.9 0.0 –5.1 –1.0 –11.4
Paraguayb –8.8 0.0 0.5 4.9 –10.5 –0.5
Peru 8.6 0.0 1.5 –1.4 –13.5 –8.6
28.5 35.5 45.4 53.5 61.4
Women
Bolivia –3.2 0.0 5.1 –5.9 6.7 0.0
Brazil –0.9 0.0 2.1 –5.8 26.1 9.4
Chileb 14.7 8.8 0.0 –3.2 –14.7 21.5
Colombia 9.9 0.4 0.0 –2.8 –5.8 25.3
Ecuador 2.5 0.0 –6.4 2.4 –10.0 –2.5
El Salvador 0.9 0.0 –5.1 3.9 –5.7 4.5
Nicaragua 11.9 7.4 0.0 –3.8 –0.8 –13.7
Paraguayb –4.4 –3.9 0.0 0.0 0.0 0.0
Peru 5.0 –2.3 1.2 0.0 –20.6 –8.3
28.8 40.3 51.7 55.5 64.5
aIn Argentina, the survey covered only urban areas and in Panama it covered four areas categorized as urban, rural,
hard-to-reach rural, and indigenous.
to twice as large as in the lowest quin-tile of expenditure (or income) per capita. This was true for all age groups in both urban and rural areas, and for both sexes. Considering the fact that the percentage of individuals who re-ported health problems may be under-reported in the lower quintiles, there may be some very large inequities in health care utilization across countries, for all areas and age groups.
Health care utilization was not in-variably twice as high in the upper expenditure or income quintile than in the lowest quintile. The two main examples are those of Argentina and Chile (see the residuals in Table 7) for all age groups, and Chile in both urban and rural areas; in these countries the inequalities were very small for chil-dren and adults but somewhat larger for older adults (Table 4). The other ex-ception is Nicaragua, where the per-centages for older adults of either sex were lower for all quintiles.
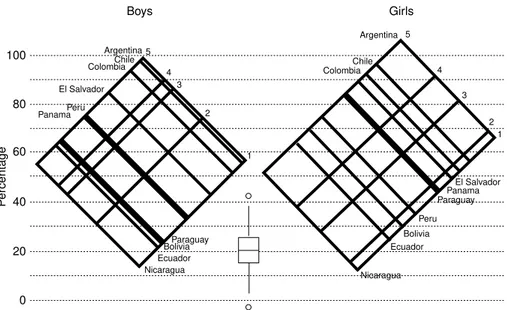
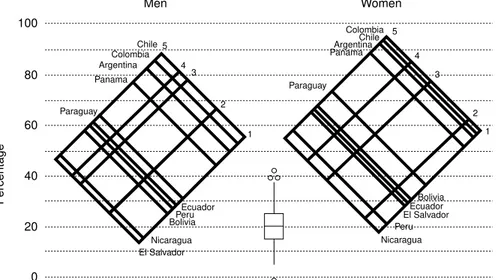
The graphs in Figures 1, 2, and 3 show the results of median polishing for health care among children, adults, and older adults, respectively. The graphs resulting from the median pol-ishing represent the combined “ef-fects” of rows and columns in the orig-inal table, which in this particular case relate to countries and quintiles, re-spectively. The value at one of the ver-tices is the “fitted” value for that coun-try and quintile. Between the sections for boys and girls and men and women there is a box and a whisker plot (17, 18) of the residuals. The val-ues represented by small circles are the ones that could be considered “out-liers”, exceptionally large values.
In general, the percentage of indi-viduals who sought health care was greater among women than men in all age groups, although the difference was more marked in the adult age group, possibly on account of the re-productive aspects of women’s health in this age bracket. There are excep-tions to this in some countries. The graphs illustrating the results of me-dian polishing should not be inter-preted without taking into account the large residuals. The three countries with the highest average percentages
of individuals who sought health care, for all age groups and both sexes, among those who reported a health problem were Argentina, Chile, and Colombia. These countries were also the ones with the smallest inequalities
across economic strata, particularly among children.
The graphs in Figure 4 represent the results of median polishing for urban and rural areas and all age groups in nine of the 12 countries studied. (Ja-FIGURE 1. Results of median polishing for the percentage of children who received health care among those who were reported as having had a health problem, by sex and quintile of household expenditure per capita, for 11 countries of Latin America, 1997–1999
Boys Girls ColombiaChile Argentina Chile Colombia Argentina 5 4 3 2 1 5 4 3 2 1 Bolivia El Salvador Paraguay Ecuador Peru Panama Nicaragua Nicaragua 100 80 60 40 20 0 Ecuador Bolivia Peru El Salvador ParaguayPanama P ercentage
FIGURE 2. Results of median polishing for the percentage of adults who received health care among those who were reported as having had a health problem, by sex and quintile of household expenditure per capita, for 11 countries of Latin America, 1997–1999
maica was not included in the polish-ing, and in Argentina and Panama the analysis could not be done by urban/ rural areas.) Percentages were in gen-eral larger in urban than in rural areas for both sexes, as one might expect. In urban areas, the spread across eco-nomic strata is smaller for men than for women. This may be because men have a larger participation in the for-mal economic sector and as a result have fewer problems of utilization in the lower economic levels than the women. The percentages of in-dividuals in urban areas who sought health care were higher overall among women than men, but the differ-ences between sexes were somewhat smaller, on average, for the two lowest quintiles of expenditure (or income) per capita. This was not the case in rural areas, where slightly higher per-centages of women than men sought health care in all quintiles, except in Ecuador and Peru.
Final comments and conclusions
The following statements summa-rize the findings of this descriptive, ex-ploratory study:
• Differences in the percentages of per-sons who are reported with a health problem or an accident are very small across the economic spectrum. • The percentages vary from country to country, in part due to differ-ences in the questions used and pos-sibly to variations in the perception of disease and health, which are partially accounted for by the avail-ability and accessibility of the health system.
• The percentages of individuals who sought health care for the reported health problem show a steep gradi-ent across the economic spectrum. On average, these percentages are approximately twice as large for persons in the quintile of higher ex-penditures (incomes) per capita as for those in the lowest quintile. • In the three age groups studied
(children, adults, and older adults) as well as in urban and rural areas, the percentage of women who seek health care is higher, in general, than the percentage of men, espe-cially among adults, which may be attributed in part to the reproduc-tive aspects of women’s health. • For the two lowest quintiles of
ex-penditure (income) per capita in
urban areas, the percentages of women who seek health care are lower than the percentages of men. • In urban areas, the gradient for
seeking care is smaller for men than for women.
A set of recommendations and conclusions:
• The questions about self-reported health problems should be simpli-fied and improved. Research should be done on ways of eliciting re-sponses that are less dependent on economic status and cultural back-ground (19–21).
• The response categories for the question regarding a health prob-lem should be extended from sim-ply “yes” and “no” to include spe-cific illnesses and conditions. There is increasing evidence that, at least for children, the expected economic gradient is found when questions are asked about specific problems, such as diarrhea and upper respira-tory tract infections.
• The questions about seeking care should also be improved. The ref-erence period for both questions should be very precise and not very long.
• The response categories for seeking care should always make it possible to tell when care was sought in the formal health system and when it was not. It would also be useful to know the type of establishment where care was sought. This infor-mation is available in only a few of the surveys.
• Notwithstanding all the problems with the questions and response categories, the surveys are an in-valuable source of data for study-ing inequalities in health. These data should be used to study in depth the relationship between these inequal-ities and their determinants. Most of the published studies on health in-equalities present only geographi-cal or large area inequalities, with-out addressing the development of models for specific outcomes, which would make it possible to devise policies to reduce those inequalities. FIGURE 3. Results of median polishing for the percentage of older adults who received
health care among those who were reported as having had a health problem, by sex and quintile of household expenditure per capita, for 11 countries of Latin America, 1997–1999
Men Women
Colombia
Chile ArgentinaChile
The results presented in this paper are a first step in trying to obtain an-swers to some of the questions raised by Rosemberg and Andersson (22) in the discussion section of their paper: “What are the dimensions of social exclusion in health in Latin America and the Caribbean?” and, more
impor-tantly, “Who are the excluded per-sons?” in terms of their demographic and socioeconomic characteristics and place of residence. By improving the instruments for collecting data (ques-tionnaires) and by broadening the analyses, it will be possible to reach a much better understanding of the real
dimensions of the problem and of its social and economic determinants. This knowledge, combined with an un-derstanding of each country’s health system, will make it possible to pro-pose better policy alternatives within the health sector reform processes so as to increase health coverage and access FIGURE 4. Results of median polishing for the percentages of the urban and rural
popula-tion who received health care among those who were reported as having had a health prob-lem, by sex and quintile of household expenditure per capita, in nine countries of Latin America, 1997–1999
100
Men
Urban
Women
80
60
40
20
0
Colombia 5 4
3
2 1
5
4 3
2 1 Chile
Brazil Bolivia
El Salvador Paraguay Ecuador
Peru Nicaragua
El Salvador ParaguayBolivia
Bolivia Chile
Colombia
Ecuador Peru Nicaragua
P
ercentage
Men
Rural
Women
5
4 3
2 1
5
4 3
2
1 Colombia
Ecuador
Nicaragua Peru
Nicaragua EcuadorParaguay
Bolivia El Salvador
Brazil Chile Colombia
Peru El Salvador
Paraguay Bolivia
P
ercentage
100
80
60
40
20
to health care and to bring utilization closer to need (23).
This paper also points to an impor-tant methodological recommendation. Due to the different patterns of eco-nomic gradients among different age groups and among males and females, the practice of standardization used in constructing concentration curves and in computing concentration indices should be avoided (24–26).
Acknowledgments. Most of the information used in preparing this
paper was gathered within the context of two separate projects developed by PAHO’s Program on Public Policy and Health, with partial support from the Research Coordination Program of the Division of Health and Human Devel-opment. One of the projects, namely the production of summary data on health inequalities, was carried out by the Department of Social Sciences of the University of Chile and the Depart-ment of Economics of the University of The Andes in Colombia. The second one was a multi-center research project
carried out in Bolivia, Brazil, Colom-bia, and Peru, respectively, by re-searchers at the Unit of Analysis of Economic and Social Policies (UDAPE) of the Ministry of Finance in La Paz, Bolivia; the Department of Preventive and Social Medicine of the Federal University of Pelotas, Brazil; the De-partment of Economics of the Univer-sity of the Andes in Santa Fe de Bo-gota, Colombia; and the Analysis for Development Group, a think tank in Lima, Peru.
1. Casas JA, Dachs JN, Bambas A. Health dis-parities in Latin America and the Caribbean: the role of social and economic determinants. In: Equity and health: views from the Pan American Sanitary Bureau. Washington, D.C.: Pan American Health Organization; 2001. (Occasional Publication No. 8). http:// www. paho.org/English/DBI/Op08_03.pdf (02/ 05/2002)
2. Paim JS, Costa MCN. Decline and unevenness of infant mortality in Salvador, Brazil, 1980– 1988. Bull Pan Am Health Org 1993;27(1): 1–14.
3. Victora C, Vaughan JP, Barros F, Silva A, Tomasi E. Explaining trends in inequities: ev-idence from Brazilian child health studies. Lancet 2000;356(September 23):1093–1098. 4. Ferrer M. Health modules in household
sur-veys in Latin America and the Caribbean: an analysis of recent questionnaires. Washing-ton, D.C.: Pan American Health Organization; 2000. (Technical Report Series No. 72, HDP/ HD).
5. Ravallion M. Poverty comparisons. Chur, Switzerland: Harwood Academic Publishers; 1994.
6. Sadana R, Mathers CD, Lopez AD, Murray CJL, Iburg K. Comparative analyses of more than 50 household surveys on health status. Geneva: World Health Organization; 2000. (GPE Discussion Paper Series No. 15). 7. Foucault M. The birth of the clinic: an
archae-ology of medical preparation. New York: Vin-tage Books, Inc.; 1963.
8. Kleinman A, Eisenberg L, Good B. Culture, illness and care: clinical lessons from anthro-pologic and cross- cultural research. Ann In-tern Med 1978;88:251–258.
9. Nunnally JC, Bernstein IR. Psychometric the-ory. Third edition. New York: McGraw Hill; 1994.
10. Mackenbach JP, Looman CWN, Van der Meer JBW. Differences in misreporting of chronic conditions, by level of education: the effect on inequalities in prevalence rates. Am J Public Health 1996;86(5):706–711.
11. Harlow DE, Linet MS. Agreement between questionnaire data and medical records. Am J Epidemiol 1989;129(2):233–248.
12. Sen A. Objectivity and position: assessment of health and well-being. In: Chen LC, Kleiman A, Ware NC, eds. Health and social change in international perspective. Boston: Harvard School of Public Health; 1994. Pp. 115–128. (Harvard Series on Population and Interna-tional Health).
13. Kind P, Dolan P, Gudex C, Williams A. Varia-tions in population health status: results from a United Kingdom national questionnaire sur-vey. BMJ. 1998;316(7 March):736–741. 14. Heliovaara M, Aromaa A, Klaukka T.
Re-liability and validity of interview data on chronic diseases. J Clin Epidemiol 1993; 46(2):181–191.
15. Deaton A. The analysis of household surveys: a microeconometric approach to development policy. Baltimore: The Johns Hopkins Univer-sity Press; 1997.
16. Pan American Health Organization. Summary-sheets of inequalities in health. Washington, D.C.: PAHO; 2001.
17. Tukey JW. Exploratory data analysis. Reading, Mass.: Addison Wesley; 1977.
18. Velleman PF, Hoaglin DC. Applications, ba-sics, and computing of exploratory data analysis. Boston, Mass.: Duxbury Press; 1981.
19. Grosh M, Glewwe P, eds. Designing house-hold survey questionnaires for developing countries: lessons from 15 years of LSMS experience. Washington, D.C: World Bank; 2000.
20. Eurostat. European Community Household Panel (ECHP): methods. Volume I. Luxem-bourg: Office for Publications of the European Communities; 1996.
21. De Bruin A, Picavet HSJ, Nossikov A. Health interview surveys: towards international har-monization of methods and instruments. Copenhagen: World Health Organization; 1996.
22. Rosemberg H, Andersson B. Repensar la pro-tección social en salud en América Latina y el Caribe. Pan Am J Public Health 2000;8(1/2): 118–125.
23. Mesa-Lago C. Social assistance on pensions and health care for the poor in Latin America and the Caribbean. Chapter 8. In: Lustig N, ed. Shielding the poor: social protection in the developing world. Washington, D.C.: Brook-ings Institution Press and Inter-American De-velopment Bank;2001.
24. Van Doerslaer E, Wagstaff A, Rutten F, eds. Equity in the finance and delivery of health care. New York: Oxford University Press; 1993.
25. Van Doerslaer E, Wagstaff A. Inequity in the delivery of health care: methods and results for Jamaica. In: Investment in health: social and economic results. Washington, D.C.: Pan American Health Organization; 2000. 26. Choi BCK, de Guia NA, Walshet P. Look
APPENDIX 1: QUESTIONS USED
The question on self-reported illness or injury (“health problem”)
Argentina: The question is number S1 (“health” section, for all household members).
Question S1: In the past 30 days has (. . .name. . .) had any sickness, illness or accident?The re-sponse categories are 1) Yes; 2) No.
The yes answer was considered a health problem.
Bolivia: The question is number S311, section 3 (“health” section, for all household members).
Question S311: In the last 4 weeks has (. . .name. . .) 1) felt ill?; 2) had an accident, burn, or a cut?; 3) been healthy?
Categories 1 and 2 were considered a health problem.
Brazil: The question is number 22, section 5 (“health” section, for all household members).
Question 22: Did (. . .name. . .) have any health problem over the past 30 days?The response cate-gories are 1) Yes; 2) No.
Category 1 was considered a health problem.
Chile: The question is number 5, section IV (“health” section, for all household members).
Question 5: In the past three months has (. . .name. . .) had an illness or accident (or pregnancy)?
The response categories are: 1) Yes, with medical care; 2) Yes, without care. It wasn’t necessary; 3) Yes, without care; (he/she) used household medication or alternative medicine; 4) Yes, without care; there were problems (difficulties) to be attended; 5) Yes, without care, for other reasons (spec-ify); 6) Didn’t have any illness or accident.
The first five categories were considered a health problem.
Colombia: The question is number 18 of chapter F (for all household members).
Question 18: In the past 30 days has (. . .name. . .) had any sickness, accident, dental problem, or any other health problem?The response categories are 1) Yes; 2) No; 3) Does not know.
The yes answer was considered a health problem or an accident.
Ecuador: The question is number 31, part C (presence of illness, for all members of the household). Question 31: During the past month (. . .name. . .) has had any illness, accident, burn, toothache or earache or any other illness, even if it was brief?The categories of response were: 1) Yes; 2) No.
The yes answer was considered a health problem.
El Salvador: The question is number 6, section 6 (“health” section, for all members of the household). Question 3: During the past month has (. . .name. . .) had any illness, a wound tended (curación), an accident, or has he/she been injured in any act of delinquency? The response categories are: 1) Illness; 2) an animal bite tended (curación); 3) another type of pound tended (curaciones); 4) ac-cident; 5) crime-related injury; 6) Did not have any.
The first five categories were considered a health problem.
Jamaica: Questions 2 and 3, part A (“health” section, for all family members) were used.
Question 2: Have you had any injury during the past 4 weeks? For example, due to an accident at your workplace, gunshot, stabbing, accidental fall, or other injury? The response categories are:1) Yes, due to motor vehicle accident; 2) Yes, accident at workplace; 3) Yes, was shot; 4) Yes, was stabbed; 5) Yes, other accident; 6) Yes, other; 7) None.
Question 3: Have you had any illness other than one due to injury during the past 4 weeks? For ex-ample, have you had a cold, diarrhea, or any other illness?The response categories are: 1) Yes; 2) No.
The first six categories of question 2 and the first category of question 3 were considered a health problem. Nicaragua: The question is number 23, section 3, part C (“presence and control of diseases”, for all household
members).
Question 3: Over the past month has (. . .name. . .) had any health problem such as:The response categories are: 1) Cough, cold, or any respiratory ailment; 2) Measles or another eruptive disease; 3) An accident; 4) Diarrhea for persons over 6 years of age; 5) Another disease or several of the pre-vious ones; 6) Was healthy.
The first five categories were considered a health problem.
Panama: The question is number 30, section 3 (“health” section, part B, for all member of the household 5 years of age or older).
Question 30: Over the past month, did (. . .name. . .) have any illness, accident (burn, fracture, fall, etc.) or ailment (toothache, headache, earache, etc.), however brief?
The response categories are: 1) Yes; 2) No.
The yes answer was considered a health problem.
Paraguay: The question is number 3, section 4, (“health” section, for all household members).
Question 3: During the past three months has (. . .name. . .) been sick or suffered an accident?The response categories are: 1) Yes, was sick; 2) Yes, had an accident; 3) No, (he/she) was healthy.
The first two categories were considered a health problem.
Peru: The question is number 2, section 4, (“health” section, part A, for all household members).