Note
CONVECTION REGIME BETWEEN CANOPY
AND AIR IN A GREENHOUSE
Roberto Terumi Atarassi1; Marcos Vinicius Folegatti2*; René Porfírio Camponez do Brasil3
1
R. Luiz de Camões, 2641, Apto. 74 - 13418-595 - Piracicaba, SP - Brasil. 2
USP/ESALQ - Depto. de Engenharia Rural, C.P. 09 - 13418-900 - Piracicaba, SP - Brasil. 3
USP/ESALQ - Programa de Pós-Graduação em Irrigação e Drenagem. *
Corresponding author <[email protected]>
ABSTRACT: The use of covering materials in protected environments modifies the air movement close to the crop canopy compared to external environment, which changes the heat and mass transfer between canopy and air. Several researches have been made in greenhouses to estimate mass and heat flux using dimensionless numbers to characterize the type of convection (forced, free or mixed). The knowledge of which one is dominant allows simplifications and specific approaches. The dominant convection regime between canopy and air was determined in a naturally ventilated greenhouse cropped with sweet pepper. Forced convection was predominant, representing more than 70% of the time. During daytime, an increase of mixed convection was observed. It is thus appropriated the use of models that include both forced and mixed convection in the studies of mass and heat exchanges in canopy – air interface.
Key words: heat flux, leaf, aerodynamic resistance
REGIME DE CONVECÇÃO ENTRE DOSSEL E AR
EM CASA DE VEGETAÇÃO
RESUMO: O uso de coberturas em ambientes protegidos altera a movimentação de ar próximo do dossel da cultura, comparado com o ambiente externo, modificando os processos de trocas de calor e massa entre dossel e ar. Muitos trabalhos realizados em casas de vegetação têm estimado os fluxos de calor latente e sensível com emprego de números adimensionais caracterizadores do tipo de regime convectivo. O conhecimento do tipo de regime predominante (forçado, livre ou misto) permite simplificações e abordagens mais específicas para estimativa destes fluxos. No presente trabalho, foi determinado o tipo de regime convectivo predominante entre dossel e ar, em uma casa de vegetação em arco, com ventilação natural com a cultura do pimentão amarelo. Na maior parte do tempo (>70%) houve predominância da convecção forçada. Durante o dia, foi observado um pequeno aumento da convecção mista, sendo interessante para este período o uso de modelos que contemplem tanto a convecção mista quanto a forçada no estudo das trocas de calor e de massa entre dossel e ar.
Palavras-chave: fluxo de calor, folha, resistência aerodinâmica
INTRODUCTION
Covering of protected crops modifies environ-mental temperature and air movement as compared to external condition and, consequently, convective pro-cesses of mass and heat transfer between plant surface and air are affected. Many studies have used heat trans-fer theories based on the dimensionless numbers to characterize the type of convection regime (forced, free or mixed), to determine the aerodynamic resistance and estimate sensible and latent heat flux, with the last one representing the transpiration of plant (Stanghellini & van Meurs, 1992; Papadakis et al., 1994; Zhang et al., 2002; Yang et al., 1990; Zolnier et al., 2001).
MATERIAL AND METHODS
The study was carried out in Piracicaba, SP, Brazil (22°42’ S, 47°38’ W; altitude 520 m), in a single span greenhouse, oriented east-west measuring 17.5 m
× 6.4 m, wall height 3.0 m and arc height 1.2 m, cov-ered with polyethylene film 0.15 mm thick. Lateral walls were constituted by 60% black shading screens and equipped with movable curtains, also made out of polyethylene film. Curtains were kept open, except in rainy days, adopting a similar management of local producers. Yellow sweet pepper plants, “Matador” va-riety, were transplanted in single rows, covered with silver plastic mulch, on August 19, 2004, at 0.5 × 1.2 m spacing, totalizing 155 plants. The crop was con-ducted in “V” form, with four stems per plant. Drip irrigation system was used to supply water and man-aged by tensiometers to keep soil moisture at a opti-mum level.
The following micrometeorological measure-ments were made inside the greenhouse (Figure 1): (a) wind speed near the canopy, by three-dimensional sonic anemometer (model CSAT3, Campbell Scientific Inc., offset < ± 0.04 m s-1, accuracy < ± 6%); (b) canopy temperature, by copper-constantan thermo-couples (AWG 40, with 0.08 mm diameter) installed at horizontal levels, 0.3 m from soil surface; three ther-mocouples were installed per level, in three leaves uni-formly distributed, and attached to the back side of leaves with porous adhesive tape; (c) air temperature, measured by aspirated thermocouple psychrometers,
installed every 0.30 m along of canopy height and with the first one located at 0.15 m from the soil surface.
Data were recorded by datalogger (Micrologger CR23X, Campbell Scientific Inc.), at 4 seconds sampling interval and record of averages ev-ery 30 minutes. Leaf area estimations were made with four plant samples, divided in level heights of 0.3 m, the same stratification used for leaf and air tempera-ture. The leaf area was estimated by measurements of length and width and application of the equation (1), determined previously by destructive method.
LA = 0.6397(±0.0154).L.W+0.2471(±1.6445)
R2 = 0.9945 (SE = 2.58) (1)
where LA, W and L are the leaf area (m2), width (m) and length (m), respectively. Values in parenthesis re-fer to 95% confidence interval of estimation and SE is the standard error.
For analysis of the type of convection regime, measurements from periods when measurements of leaf area were made were used i.e., 09/28 to 10/03/2004, and from 10/09 to 10/13/2004, (Table 1). The reduc-tion of leaf area between 09/30 and 10/08 was due to conduction pruning made in this period. Leaf area was assumed as constant during each period of leaf area measurements, since time was very short to observe significant growth.
The average canopy temperature was obtained by weighed mean of leaf temperature per leaf area in each layer, represented in equation (2).
LAP i T LAPi
T i
L
L
∑
⋅= (2)
where TL is de average temperature of leaves (K), LAPi
is the leaf area per plant in layer i (see Figure 1), TLi
is the average leaf temperature in layer i and LAP is the total leaf area per plant.
The average of measurements supplied by as-pirated psychrometers was used to determine air tem-perature. As the processes of energy exchanges are more significant during the daytime, by transpiration and radiation exchanges, separate analyses for daytime and nighttime were processed. Determination of the type of dominant convection was made comparing the magnitudes of driving forces that command the free and forced convection by application of equation (3) (Incropera & DeWitt, 1996; Zolnier et al., 2001):
2 2
Re u
T T l g
Gr = ⋅β⋅ ⋅ L− a
(3)
where Gr is the Grashof number (dimensionless), Re
is the Reynolds number (dimensionless), β is the grav-ity acceleration (m s-2), b is the volumetric thermal ex-pansion coefficient (K-1), l is the characteristic length (m), TL−Ta is the absolute value of the temperature difference between surface and fluid in free stream (K), and u is the free stream velocity of the fluid (m s-1). The research focuses on application of heat transfer theory and details about equations, and terms can be found in Incropera & DeWitt (1996) and Duffie & Beckman (1991).
When the convection is forced (Gr/Re2 << 1) or free (Gr/Re2 >> 1), the aerodynamic resistance (ra) can be calculated by classical equations of heat trans-fer, simplifying its determination (Zolnier et al., 2001). Under mixed conditions (Gr/Re2 ≅ 1), the effect of the wind speed and the difference of canopy-air tempera-ture must be combined. One specific classification given by Gates (1980), considers the free convection
if Gr/Re2 > 16 and forced convection if Gr/Re2 < 0.1. The values of 3.42 × 10⁻³ K-1 for thermal expansion co-efficient of air at 20°C and g 9.81 m s-2 were used in the evaluation. The equations were applied to the av-erages of 30 minutes of collected data. The character-istic length of the leaf was calculated by the expres-sion (Boulard et al., 1989):
LA
l= (4)
where LA is the average area of one leaf (m2
).
RESULTS AND DISCUSSION
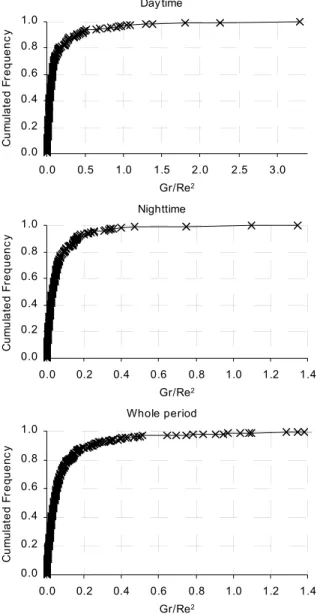
Along a 24-h period, in excess of 90% of the time, the Gr/Re2 ratio assumed values lower than 0.25, indicating predominance of forced convection, mainly during the night, where 90% of the time Gr/Re2 were lower than 0.16 (Table 2 and Figure 2). These results can be explained by reduction in the average value of
⏐TL–Ta⏐ during this period, reducing the action of the thermal convection in the exchange processes. During daytime, the solar radiation promotes the heating of the canopy, increasing the difference of temperature be-tween leaf and air, leading to an amplification of the thermal convection. Even though values of Gr/Re2 are lower than one most of the time, these are relatively close to the mixed regime, especially during the day-time. Appling Gates (1980) classification (Table 3), only the forced and mixed convection was observed during the period of study, with increase of the mixed during the daytime (29.0% of the time) compared with the nighttime (17.7% of the time).
Mass and heat exchanges in greenhouses are usually governed by mixed convection (Stanghellini, 1993), suggesting the equation (5) (Stanghellini & van Meurs, 1992) for calculation of the aerodynamic re-sistance. Working with artificial leaves inside a green-house (Bailey & Meneses, 1995), also observed the predominance of mixed convection in these conditions.
y a
D DAT Leafarea/plant LA LAI l
m
-- 2------------ m
e g a r e v
A 09/30/2004 42 0.43690 0.004141 2.006 0.0628
4 0 0 2 / 8 0 / 0
1 50 0.32564 0.006232 1.361 0.0721
n o i t a i v e d d r a d n a t
S 09/30/2004 42 0.10737 0.003941 0.065
4 0 0 2 / 8 0 / 0
1 50 0.05382 0.005198 0.081
) % ( V
C 09/30/2004 42 24.58 95.16 10.72
4 0 0 2 / 8 0 / 0
1 50 16.53 83.40 14.24
These reports differ from the results observed in the present work, where the forced convection was more frequent. The fact of the authors had carried out their measurements in greenhouse with heating system and forced ventilation, which increases air movement, would lead to opposite results, amplifying the forced convection. Therefore, particular characteristics of the greenhouse, local climate, and crop, may influence de-cisively in the type of convective, a thus emphasizing the need for local determination.
(
2)
0.255 . 0 207 1174 u T T l l r a L a ⋅ + − ⋅
= (5)
Zolnier et al. (2001) found average values of 0.0067 for Gr/Re2 ratio, indicating that forced convec-tion was dominant in the exchanges of sensible heat. The aerodynamic resistance of canopy (rc) was calcu-lated by equation (6), suitable for this condition. This result was expected since the study was carried out in environmental chambers with forced ventilation. Even
Table 2 - Average and maximum values and 50% and 90% cumulated frequency of wind velocity (u), air temperature (Ta), leaf temperature (TL), (TL-Ta), ⏐TL – Ta⏐ and relation Gr/Re2.
d o i r e
P u Ta TL TL-Ta ⏐TL-Ta⏐ Gr/Re2
s
m -1 --------------------------- °C --------------------------
-e m i t t h g i
N Average 0.115 19.55 19.42 -0.122 0.142 0.068
y c n e u q e r f % 0
5 0.091 <0.030
y c n e u q e r f % 0
9 0.219 <0.160
m u m i x a
M 0.416 30.74 29.52 0.246 1.219 1.346
e m i t y a
D Average 0.184 26.32 25.47 -0.846 0.952 0.163
y c n e u q e r f % 0
5 0.163 <0.050
y c n e u q e r f % 0
9 0.365 <0.393
m u m i x a
M 0.613 38.74 35.43 1.894 6.638 3.290
d o i r e p e l o h
W Average 0.145 22.52 22.08 -0.440 0.526 0.110
y c n e u q e r f % 0
5 0.095 <0.038
y c n e u q e r f % 0
9 0.307 <0.250
m u m i x a
M 0.613 38.74 35.43 1.894 6.638 3.290
d o i r e
P Convectiontype Frequency(%)
e m i t t h g i
N Forced 82.3
d e x i
M 17.7
e m i t y a
D Forced 71.0
d e x i
M 29.0
d o i r e p e l o h
W Forced 77.0
d e x i
M 23.0
Table 3 - Frequency of forced (Gr/Re2 < 0.1) and mixed
(0.1 < Gr/Re2 < 16) convection by Gates (1980)
classification.
working in different conditions, in comparison to the present research, the aerodynamic resistance may be calculated by the same method, due to the similar pre-dominance of the forced convection. Boulard & Wang (2000) obtained good results assuming only the ex-changes by forced convection in the development of a model of transpiration for a greenhouse with heating, ventilation and lateral vent opening. The aerodynamic resistance of a leaf was calculated with the equation (7), in accordance with results obtained in the present work. LAI u l rc ⋅ ⋅ ⎟ ⎠ ⎞ ⎜ ⎝ ⎛ ⋅ = 328 . 1
Pr16 2 1 α (6) 8 . 0 2 . 0 220 u l
ra = ⋅ (7)
where α is the thermal diffusivity (m2 s-1), Pr is the Prandtl number (dimensionless) and LAI is the leaf area index.
The differences among results reported in lit-erature and for the present experiment emphasize the importance of local measurements for use and devel-opment of heat exchanges models, especially in Bra-zil, which has large climatic variation throughout its territory.
more pronounced during the daytime, it is recom-mended that estimation of sensible and latent heat ex-change take in account the mixed and forced convec-tion when precise estimaconvec-tions are desired. Although in low proportion, the mixed convection is not negligible. However, under conditions similar to those of the present work, even estimations considering only the forced convection would represent adequately great part of convection exchanges, as assumed by Boulard & Wang (2000) and Zolnier et al. (2001).
Day time
0.0 0.2 0.4 0.6 0.8 1.0
0.0 0.5 1.0 1.5 2.0 2.5 3.0
Gr/Re2
C
um
u
la
ted
F
requ
enc
y
Nighttime
0.0 0.2 0.4 0.6 0.8 1.0
0.0 0.2 0.4 0.6 0.8 1.0 1.2 1.4
Gr/Re2
C
u
m
ul
at
ed F
reque
nc
y
Whole period
0.0 0.2 0.4 0.6 0.8 1.0
0.0 0.2 0.4 0.6 0.8 1.0 1.2 1.4
Gr/Re2
C
um
u
la
ted
F
req
uen
c
y
Figure 2 - Cumulated frequency of Gr/Re2 for daytime, nighttime
and whole period.
ACKNOWLEDGMENTS
We wish to thank to The State of São Paulo Research Foundation (FAPESP) for granting of the fi-nancial support to this research.
REFERENCES
BAILEY, B.J.; MENESES, J.F. Modelling leaf convective heat transfer.
Acta Horticulturae, n.399, p.191-198, 1995.
BOULARD, T.; WANG, S. Greenhouse crop transpiration simulation from external climate conditions. Agricultural and Forest Meteorology, v.100, p.25-34, 2000.
BOULARD, T.; BAILLE, A.; LAGIER, J.; MERMIER, M.; VANDERSCHMITT, E. Water vapor transfer in a plastic house equipped with a dehumidification heat pump. Journal of Agricultural Engineering Research, v.44, p.191-204, 1989. DUFIE, J.A.; BECKMAN, W.A. Solar engineering of thermal
processes. 2.ed. New York: Wiley-Interscience, 1991. 919p. GATES, D.M. Biophysical ecology. New York: Springer-Verlag, 1980.
611p.
INCROPERA, F.P.; DEWITT, D.P. Fundamentals of heat and mass transfer. 4.ed. New York: John Wiley & Sons, 1996. 886p. PAPADAKIS, G.; FRANGOUDAKIS, A.; KYRITSIS, S. Experimental
investigation and modelling of heat and mass transfer between a tomato crop and the greenhouse environment. Journal of Agricultural Engineering Research, v.57, p.217-227, 1994. STANGHELLINI, C. Mixed convection above greenhouse crop
canopies. Agricultural and Forest Meteorology, v.66, p.111-117, 1993.
STANGHELLINI, C.; VAN MEURS, W.T.M. Environmental control of greenhouse crop transpiration. Journal of Agricultural Engineering Research, v.51, p.297-311, 1992.
YANG, X.; SHORT, T.H.; FOX, R.D.; BAUERLE, W.L. Dynamic modeling of the microclimate of a greenhouse cucumber row-crop part I. Theoretical model. Transactions of the ASAE, v.33, p.1701-1709, 1990.
ZHANG, Y.; JEWETT, T.L.; SHIPP, J.L. A dynamic model to estimate in-canopy and leaf-surface microclimate of greenhouse cucumber crops. Transactions of the ASAE, v.45, p.179-192, 2002. ZOLNIER, S.; GATES, R.S.; GENEVE, R.L.; BUXTON, J.W. Surface
diffusive resistances of rooted poinsettia cuttings under controlled-environment conditions. Transactions of the ASAE, v.44, p.1779-1787, 2001.