START-UP ADJUSTMENT OF A PLUG-FLOW DIGESTER FOR
CASSAVA WASTEWATER (
MANIPUEIRA
) TREATMENT
Maria Magdalena Ferreira Ribas1; Ana Cláudia Barana2*
1
UNESP - Centro de Raízes e Amidos Tropicais - C.P. 237, 18601-970 - Botucatu, SP - Brasil. 2
UEPG - Depto. de Engenharia de Alimentos - Av. Carlos Cavalcanti, 4748 - 84030-900 - Ponta Grossa, PR - Brasil.
*Corresponding author <[email protected]>
ABSTRACT: Manipueira,wastewater of cassava (Manihot esculenta) processing, can be treated by anaerobic biodigestion. To study the start-up process of a plug-flow digester for manipueira treatment, this work consisted of two stages: gradual decrease of the hydraulic retention time (HRT) to the preset time of 4 days or maintaining a fixed HRT of 4 days with gradual increase of the substrate concentration. A digester of 1980 mL capacity was opperated, at constant temperature (32 ± 1o
C), with substrate pH corrected between 5.5 and 6.0. The first stage had durations of 16.6; 13.6; 11.6; and 9.6 days and the organic loads were 3.1; 2.0; 2.3; and 2.9 COD L-1
d-1
, (chemical oxigen demand) respectively. The second stage was characterized by a fixed HRT (4 days) and organic loads of 0.48; 0.86; 1.65; and 2.46 g COD L-1
d-1
. Total solids (TS), volatile solids (VS), COD, alkalinity and volatile acidity were determined in the substrate and in the effluent. During the first stage, the HRT of 9.6 days and organic load of 2.9 g COD L-1 d-1 resulted in the best performence; reductions in COD, total and volatile solids were 60, 44 and 60%, respectively. During the second stage, with a 4-day HRT, the best results were achieved with the 0.86 g COD L-1 d-1 organic load, which provided reductions in COD, total and volatile solids of 71, 58 and 79%, respectively. The start-up of the plug-flow digester for manipueira treatment can be made by gradually by decreasing the HRT, or fixing HRT and increasing substrate concentration.
Key words: cassava, anaerobic, effluent, biodigestion
PROCESSO DE PARTIDA DE UM BIODIGESTOR DO TIPO
PLUG-FLOW
PARA TRATAMENTO DA MANIPUEIRA
RESUMO: Um dos resíduos gerados no processamento da mandioca (Manihot esculenta) é a manipueira, passível de tratamento por biodigestão anaeróbia. Este trabalho objetivou estudar o processo de partida de um biodigestor tipo plug-flow, tratando manipueira de duas maneiras: diminuindo-se gradativamente o tempo de retenção hidráulica (TRH) até se chegar ao tempo pré-estabelecido, quatro dias; ou mantendo-se o TRH fixo em quatro dias e aumentando-se gradativamente a concentração do afluente. O biodigestor, com capacidade 1980 mL, foi mantido a temperatura de 32o
C ± 1. Empregou-se como substrato manipueira e ajustou-se o pH entre 5,5 e 6,0. A primeira etapa foi caracterizada empregando-se TRH de 16,6; 13,6; 11,6 e 9,6 dias e 3,1; 2,0; 2,3 e 2,9 g DQO L-1 d-1 de carga orgânica, respectivamente. Na segunda etapa manteve-se TRH fixo, 4 dias, porém cargas orgânicas de 0,48, 0,86, 1,65 e 2,46 g DQO L-1 d-1. Determinaram-se no afluente e efluente, sólidos totais (ST) e sólidos voláteis (SV), demanda química de oxigênio (DQO), alcalinidade e acidez volátil. Na primeira etapa, melhores resultados foram observados trabalhando com TRH 9,6 dias e carga orgânica 2,9 g DQO L-1
d-1
, quando houve redução de DQO, ST e SV de 60%, 44% e 60%, respectivamente. Na segunda etapa o TRH de 4 dias apresentou melhores resultados empregando-se carga orgânica de 0,86 g DQO L-1
d-1
, houve redução de 71%, 58% e 79% de DQO, ST e SV, respectivamente. A partida do biodigestor plug-flow tratando manipueira, pode ser realizada tanto diminuindo-se o TRH, quanto mantendo-o fixo e aumentado-se a concentração do afluente.
Palavras-chave: mandioca, anaeróbio, efluente, biodigestão
INTRODUCTION
The types of waste materials generated by cassava (Manihot esculenta, Crantz) processing plants require so-lutions tailored to the social and economic level of the in-dustries. When low-cost solutions are not available, efflu-ents are usually dumped into rivers or on the soil, causing
, v.60, n.2, p.223-229, Abr./Jun. 2003
Many attempts have been made to aggregate eco-nomic value to the manipueira by considering its utiliza-tion as a fertilizer (Ponte, 2001), herbicide (Fioretto, 1985), insecticide (Ponte et al., 1992), nematicide (Ponte & Franco, 1983; Sena & Ponte, 1982), biosurfactant (Santos et al., 2000) or substrate for microorganism growth (Wosiacki et al., 1994). The production of biogas (Lacerda, 1991; Fernandes Jr., 1989; Fernandes Jr., 1995; Barana, 1996; Barana, 2000), single-cell oil (Wosiacki et al., 1994), microbial protein (Menezes, 1994) and re-cently, aromas (Damasceno, 1998) can be cited as ex-amples of its use.
The plug flow reactor is a simplified digester con-structed of inexpensive materials, and operates in a very simple manner since there is no agitation (Kubiak & Dubuis, 1985). In a plug flow digester the substrate moves along the reactor without interacting with the substrate that enters the system previously or will pass through at a later time, working as a multi-stage, single-compartment reactor (Armenante, 1993). The basic assumption in a plug flow reactor is that the fluid is ideally mixed later-ally and not mixed longitudinlater-ally.
One of the main problems of starting an anaero-bic digester consists in adapting the microorganisms to the effluent. Once the biomass is stabilized, the reactor is also stabilized. It is, therefore, recommended that the residue is gradually introduced until a desired load is reached (Stronach et al., 1987). During the start-up pe-riod the growth of anaerobic sludge can benefit from the application of organic loads with high dilution rates. This is the best way of ensuring the stability of the process (Lettinga & Hulshoff Pol, 1991).
MATERIAL AND METHODS
Substrate - Manipueira from different lots was collected in Santa Maria da Serra, SP, Brazil, (22º34’00’’S; 48º09’36’’W), and in Tibagi, PR, Brazil, (24º30’34’’S; 50º24’55’’W). The most frequent cassava cultivars were: Olho Junto, Fibra and IAC 13. After the manipueira was collected, remaining starch was allowed to settle for two hours, and samples were taken for physico-chemical char-acterization analyses. The supernatant was transferred to 5 L plastic containers and frozen. The pH of the substrate was corrected daily, before being injected into the reac-tor, with NaOH 50% (w/v) solution; pH was kept between 5.5 and 6.0, ideal for acidogenic bacteria, which would concentrate predominantly at the base of the reactor, i.e., at the substrate inlet (Souza, 1984).
Plug flow digester - 1980 mL net capacity, consisting of two polyvinyl chloride concentric tubes, one 11 cm in diameter and 32 cm in height and the other 15 cm in diameter and 35 cm in height, arranged vertically (Fig-ure 1). The smaller diameter tube was filled with hoses
having an internal diameter of 0.5 cm, and 0.7 cm ex-ternally, arranged vertically. The space between the 11 and 15 cm tubes was filled with water maintained at a constant temperature (32ºC± 1) by a thermostat-con-trolled heater.
Experiment - the digester was daily and intermittently fed by a peristaltic pump connected to a timer. The sub-strate entered the column at its bottom and the outlet was in the upper part of the system. No physical separation of the acidogenic and methanogenic stages occurred; both took place in a single compartment. The top of the reac-tor had an outlet for biogas. The start-up adjustment phase was divided into two stages:
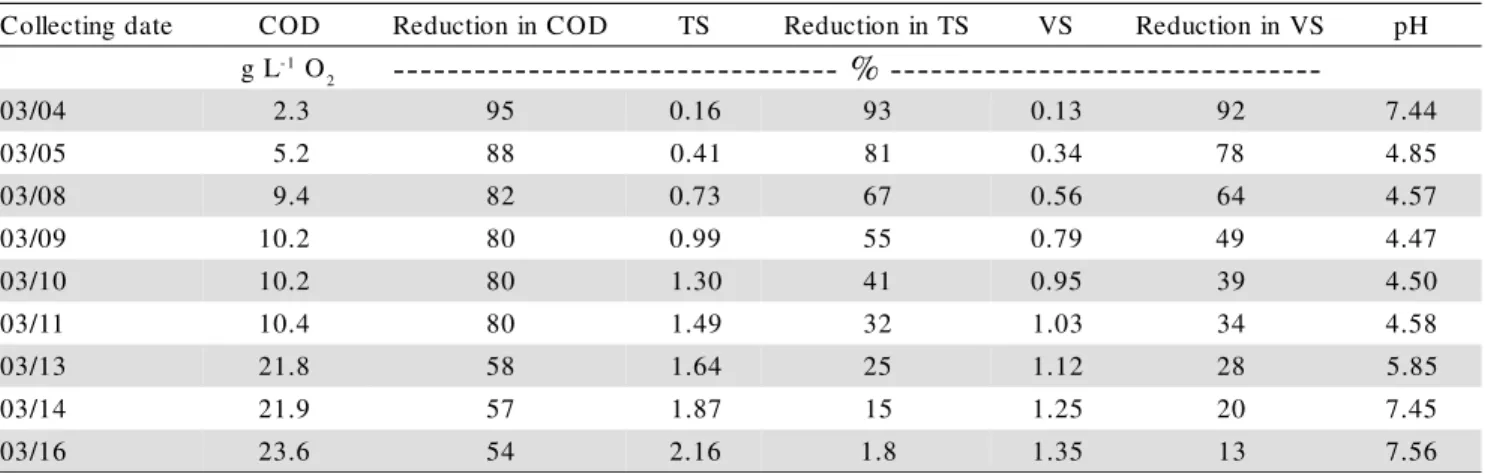
First stage - hydraulic retention time (HRT) values of 16.6; 13.6; 11.6 and 9.7 days were adopted, and the inlet flow was gradually raised from 119, 145, 170 to 205 mL day-1. The organic load utilized was 3.1; 2.0; 2.3 and 2.9 g COD L-1 d-1, (chemical oxigen demand per liter day) respectively for each HRT (Table 1). Total and volatile solids analyses were performed for the substrate and the effluent, (%), COD, (g L-1
O2), alkalinity, (mg CaCO3L-1 ), and volatile acidity, (mg CH3COOHL-1
), in addition to pH and volume measurements.
Second stage - The HRT was kept at a fixed value of four days with a constant flow of 495 mL day-1. The substrate concentration was raised every four HRTs (16 days). The loads in this stage were: 0.48; 0.86; 1.65 and 2.46 g COD L-1 d-1 (Table 1). Data from the first HRT for each applied load were discarded to eliminate interferences from the previous load, and data from the other three HRTs were utilized at the start-up study analysis.
Inoculation - The reactor was started without the use of inoculum and after 45 days a constant decline of the pH of the effluent was observed. Inoculation with fresh bo-vine manure was performed in an attempt to enrich the
sub-Figure 1 - Schematics of plug flow reactor for manipueira treatment.
Inlet Peristaltic
pump
Effluent
Biogas outlet
Thermostat and heater
strate with methanobacteria, but the outlet pH remained near 4.5. The digester was then left for 15 days without feeding to allow methanobacteria time enough to consume the organic acids (Nogueira, 1986).
Analyses - To monitor treatment efficiency during the start-up adjustment phase, the following analyses were performed: pH (APHA, 1992), COD (APHA, 1992), TS and VS, alkalinity (AL) and volatile acidity (VA) (Silva, 1977).
RESULTS AND DISCUSSION
First stage
When HRT was 16.6 days the substrate presented 51.5 g L-1 O2, resulting in an organic load of 3.1 g COD L-1
d-1
, 2.2% TS, 1,.6% VS and pH between 5.5 and 6.0 (Table 2).
The COD, TS and VS values of the effluent in-creased with time, because the reactor was first filled with water, for temperature adjustment. Therefore, once the reactor started to be supplied with material, the ef-fluent obtained consisted of water and biodigested manipueira, and this situation persisted until all the water was eliminated. By the end of this first HRT, the outlet pH was higher than that of the inlet, indicat-ing that the methanogenic bacteria were consumindicat-ing the organic acids produced by the acidogenic bacteria, and were, therefore, adapted to the manipueira organic load.
When HRT was 13.6 days, the substrate pre-sented 27.2 g L-1 O2, resulting in an organic load of 2.0 g COD L-1 d-1, 4.19% TS, 3.69% VS and pH between 5.5 and 6.0 (Table 3). The optimal pH values for the growth of methanogenic bacteria is between 7.0 and 7.5, and these values were only found for the effluent on the first day and on the last two days of this HRT (Fernandes Jr., 1989; Lacerda, 1991; Sampaio, 1996; Barana, 2000).
As the organic load increased there was a greater production of organic acids by acidogenic bac-teria (Table 3). At first, the methanogenic bacbac-teria did not consume all the acid, causing a pH drop in the me-dium. However, as they adapted to the medium, which probably occurred on day 03/22, they started to consume all the acid, making the medium more alkaline. The re-duction in COD during this HRT, beginning on day 03/ 19, remained between 58 and 70%. Reductions in TS and VS, however, which were between 72% and 77% at the beginning, decreased to 42% and 58%, respec-tively.
Results for reductions in COD, TS and VS did not show the same reduction and/or increasing behav-ior, probably because manipueira has solids in suspen-sion that might have been retained inside the reactor. In addition, biomass is produced during digestion, which could exit the system in the effluent, increasing the
sol-e t a d g n i t c e l l o
C COD ReductioninCOD TS ReductioninTS VS ReductioninVS pH
L
g -1 O
2
-
-
-
-
-
-
-
-
-
-
-
-
-
-
-
-
-
-
-
-
-
-
-
-
-
-
-
-
-
-
-
-
-
%
-
-
-
-
-
-
-
-
-
-
-
-
-
-
-
-
-
-
-
-
-
-
-
-
-
-
-
-
-
-
-
-40 / 3
0 2.3 95 0.16 93 0.13 92 7.44
5 0 / 3
0 5.2 88 0.41 81 0.34 78 4.85
8 0 / 3
0 9.4 82 0.73 67 0.56 64 4.57
9 0 / 3
0 10.2 80 0.99 55 0.79 49 4.47
0 1 / 3
0 10.2 80 1.30 41 0.95 39 4.50
1 1 / 3
0 10.4 80 1.49 32 1.03 34 4.58
3 1 / 3
0 21.8 58 1.64 25 1.12 28 5.85
4 1 / 3
0 21.9 57 1.87 15 1.25 20 7.45
6 1 / 3
0 23.6 54 2.16 1.8 1.35 13 7.56
Table 2 - Chemical oxygen demand (COD), total solids (TS), volatile solids (VS), pH and reduction in COD, TS and VS in the effluent from the first hydraulic retention time, (first stage).
Table 1 - Values for hydraulic retention time (HRT), flow, chemical oxygen demand (COD), organic loads, and total (TS) and volatile solids (VS) of the substrate utilized in the first and second stages of the experiment.
*HRT: reactor volume/inlet flow. **Organic load: COD/HRT.
e g a t s t s r i F
* T R
H Flow COD Organic
* * d a o
l TS VS
s y a
d mLday-1 gL-1O
2 gCODL 1
- d-1 --- % --
-6 . 6
1 119 51.5 3.1 2.3 1.6
6 . 3
1 145 27.2 2.0 4.2 3.7
6 . 1
1 170 26.5 2.3 4.8 4.3
7 .
9 205 28.4 2.9 4.8 4.3
e g a t s d n o c e S
4 495 1.90 0.48 0.27 0.24
4 495 3.43 0.86 0.35 0.32
4 495 6.60 1.65 0.53 0.48
, v.60, n.2, p.223-229, Abr./Jun. 2003
ids content. The reduction in COD, except for days 03/ 17 and 03/18, remained practically constant, between 59% and 70%; the reduction in TS and VS had a ten-dency to decrease from the beginning. Similarly, Fernandes Jr. (1995), studying an acidogenic reactor for manipueira treatment, did not find a relationship be-tween the reductions in COD, TS and VS.
When HRT was equivalent to 11.6 days, the sub-strate presented 26.5 g L-1
O2, resulting in an organic load of 2.3 g COD L-1 d-1, 4.87% TS, 4.31% VS and pH between 5.5 and 6.0. The COD, TS and VS of the ef-fluent decreased from the beginning of this HRT (Table 4). The outlet pH had a tendency to decrease, as it reached values near 4.0, probably indicating that the methanogenic bacteria were inhibited, since they op-erate by transforming the acids produced by the acidogenic bacteria into methane, neutralizing the me-dium and increasing the pH (Nogueira, 1986). For this HRT, the COD reduction values were practically con-stant, around 60%. The COD in the effluent ranged from 9.9 to 10.7 g L-1
O2.
The reductions in TS and VS also remained practically constant, and their lowest values occurred on the last day of this HRT, with 38% and 48% of reduc-tion in TS and VS, respectively. With the pH of the ef-fluent decreasing every day, indicating predominantly the activity of acidogenic bacteria, a decision was made to add a methanobacteria-rich inoculum to the digester. Bovine manure, diluted to 17% TS and at an pH 8.03, was added. This was the same inoculum used by Lacerda (1991), who worked with a methanogenic anaerobic fil-ter for manipueira treatment. However, while studying
the acidogenic stage in a two-stage anaerobic reactor Fernandes Jr. (1995), used rumen fluid as inoculum, and concluded that it was suitable for the manipueira acidogenesis process, since it provides microorganisms capable of accomplishing carbohydrate hydrolysis and fermentation, as confirmed through the microbiological study of the effluent.
Even with a low effluent pH, the level of COD reduction was maintained practically constant during this stage, around 60%. This was caused mainly by the acidogenesis process in the substrate, part of the organic matter being released in the form of CO2. Fernandes Jr. (1995), working with the acidogenic stage in a phase separation anaerobic digester, obtained an average re-duction in COD of 23.5% for all HRTs. Sampaio (1996), in a viability study of the anaerobic manipueira treat-ment process with a two-stage system, obtained acidogenesis reductions up to 51%. Cohen (1979), cited by Sampaio (1996), obtained a mean reduction in total organic carbon ranging in 39% with glucose acidogenesis.
When the HRT was 9.6 days, the substrate pre-sented 28.4 g L-1 O2, resulting in an organic load of 2.9 g COD L-1 d-1, 4.87% TS, 4.31% VS and pH between 6.0 and 6.5. The pH values of the effluent showed a ten-dency to increase from the beginning of this HRT study, indicating a possible readaptation of the methanobacteria to the substrate (Table 5). The reduction in COD was maintained practically constant, with a 60% average, corresponding to a mean COD of 10.1 g L-1 O2 at the outlet. The observed TS and VS reductions were on av-erage 47.5% and 63.5%, respectively.
e t a d g n i t c e l l o
C COD ReductioninCOD TS ReductioninTS VS ReductioninVS pH
L
g -1O
2
-
-
-
-
-
-
-
-
-
-
-
-
-
-
-
-
-
-
-
-
-
-
-
-
-
-
-
-
-
-
-
-
-
%
-
-
-
-
-
-
-
-
-
-
-
-
-
-
-
-
-
-
-
-
-
-
-
-
-
-
-
-
-
-
-
-71 / 3
0 20.2 25 1.17 72 0.84 77 6.87
8 1 / 3
0 15.6 42 1.06 75 0.75 80 6.39
9 1 / 3
0 8.8 68 1.13 73 0.83 77 5.88
0 2 / 3
0 8.4 69 1.24 70 0.75 80 5.82
2 2 / 3
0 9.5 65 1.35 68 0.95 74 5.26
4 2 / 3
0 8.1 70 1.90 55 n. a. n.a. 5.42
5 2 / 3
0 9.8 64 1.75 58 n. a. n.a. 5.43
6 2 / 3
0 8.6 68 1.88 55 1.25 66 5.55
7 2 / 3
0 8.8 68 1.91 54 1.33 64 5.76
9 2 / 3
0 11.3 58 2.67 36 1.86 50 6.00
0 3 / 3
0 11.5 58 2.29 45 1.57 57 5.98
1 3 / 3
0 10.8 60 2.36 44 1.55 58 6.20
1 0 / 4
0 10.6 61 2.41 42 1.54 58 6.73
5 0 / 4
0 11.2 58 n. a. n. a. n. a. n.a. 7.18
Table 3 - Chemical oxygen demand (COD), total solids (TS), volatile solids (VS), pH and reduction in COD, TS and VS in the effluent from the second hydraulic retention time, (first stage).
Second stage
During the second organic load, the reduction in COD and volatile solids remained practically constant, with a mean reduction of 71% and 80%, respectively (Table 6). The reduction in total solids remained constant at 63% for the third and fourth HRTs.
TS content presented a decrease from 57% to 48%, and in VS content, from 80% to 68%, for the third
organic load as compared to the second, while the COD was practically the same, showing a reduction of 72%, on average.
When the fourth organic load is compared to the third, a decrease in COD reduction can be observed, from 72% to 3%, on average, in the last HRT (sampled on 11/ 03). With regard to the total and volatile solid contents, the reduction was 43% and 83%, respectively.
e t a d g n i t c e l l o
C COD ReductioninCOD TS ReductioninTS VS ReductioninVS pH
L
g -1 O
2
-
-
-
-
-
-
-
-
-
-
-
-
-
-
-
-
-
-
-
-
-
-
-
-
-
-
-
-
-
-
-
-
-
%
-
-
-
-
-
-
-
-
-
-
-
-
-
-
-
-
-
-
-
-
-
-
-
-
-
-
-
-
-
-
-
-60 / 4
0 9.9 62 2.45 47 1.74 60 n. a.
9 0 / 4
0 10.8 59 2.81 42 1.97 54 6.56
0 1 / 4
0 9.9 62 2.45 47 1.71 60 6.82
2 1 / 4
0 9.9 62 2.02 58 1.45 66 6.16
3 1 / 4
0 10.0 62 2.35 52 1.69 60 5.74
4 1 / 4
0 10.1 62 2.27 53 1.50 65 5.72
5 1 / 4
0 10.0 62 2.02 58 1.38 68 5.68
6 1 / 4
0 10.1 62 2.12 56 1.42 67 5.52
0 2 / 4
0 10.6 60 2.35 52 1.63 62 5.16
1 2 / 4
0 10.4 61 2.56 47 1.87 57 4.58
2 2 / 4
0 10.2 62 2.71 44 1.98 54 4.39
3 2 / 4
0 10.7 59 3.00 38 2.21 49 4.29
6 2 / 4
0 10.2 61 3.09 36 2.29 47 4.06
7 2 / 4
0 10.7 60 3.15 35 2.43 44 4.04
9 2 / 4
0 10.7 59 2.66 45 2.11 51 4.07
1 0 / 5
0 10.7 60 3.01 38 2.24 48 4.06
Table 4 - Chemical oxygen demand (COD), total solids (TS), volatile solids (VS), pH and reduction in COD, TS and VS in the effluent from the third hydraulic retention time, (first stage).
n. a.: not analyzed.
e t a d g n i t c e l l o
C COD ReductioninCOD TS ReductioninTS VS ReductioninVS pH
L
g -1 O
2
-
-
-
-
-
-
-
-
-
-
-
-
-
-
-
-
-
-
-
-
-
-
-
-
-
-
-
-
-
-
-
-
-
%
-
-
-
-
-
-
-
-
-
-
-
-
-
-
-
-
-
-
-
-
-
-
-
-
-
-
-
-
-
-
-
-20 / 6
0 10.8 62 2.66 45 1.62 62 4.30
7 0 / 6
0 11.0 61 2.63 46 1.65 62 4.43
0 1 / 6
0 10.8 62 2.51 48 1.44 66 4.45
2 1 / 6
0 10.4 63 2.39 51 1.23 71 4.59
4 1 / 6
0 11.3 60 2.80 42 1.51 65 4.10
5 1 / 6
0 11.0 61 2.72 44 1.87 57 4.68
7 1 / 6
0 10.9 62 2.70 44 1.86 57 4.72
8 1 / 6
0 10.8 62 2.36 51 1.68 61 4.64
1 2 / 6
0 11.5 59 1.97 59 1.41 67 5.35
6 2 / 6
0 11.2 60 2.28 53 1.24 71 5.05
4 1 / 7
0 10.7 62 2.74 44 1.85 57 5.62
5 1 / 7
0 10.5 63 n.a. - n.a. - 5.51
6 1 / 7
0 11.1 61 n.a. - n.a. - 5.42
1 2 / 7
0 11.2 60 2.74 44 1.47 66 6.08
Table 5 - Chemical oxygen demand (COD), total solids (TS), volatile solids (VS), pH and reduction in COD, TS and VS in the effluent from the fourth hydraulic retention time.
, v.60, n.2, p.223-229, Abr./Jun. 2003
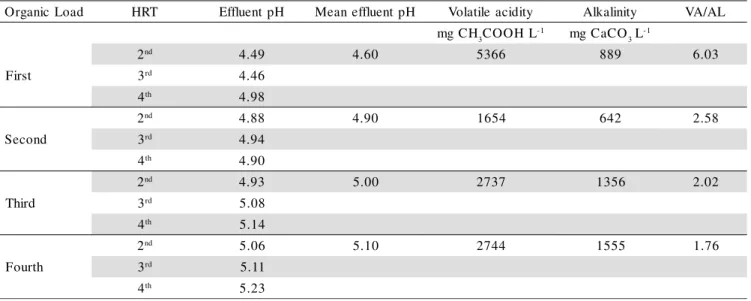
Alkalinity, pH and volatile acidity for four organic loads during the second stage
Even though the substrate pH was corrected to values between 5.5 and 6.0, the effluent pH remained be-tween 4.46 and 5.23, indicating that in this stage acidogenic bacteria were probably predominant. The low-est pH at the outlet occurred for the first organic load, and the highest for the last load, probably indicating methanobacteria recovery, as they began to consume the organic acids produced by the acidogenic bacteria, decreasing volatile acidity and increasing alkalinity (Table 7).
The pH at the outlet was expected to be about neutral, which would indicate greater activity of methanogenic bacteria. However, it remained at similar values for all organic loads under study, i.e., around 5.0. Even though the ideal effluent pH, near 7.0, was not at-tained, which reveals low methanobacteria activity, sig-nificant reduction values for the organic load in the resi-due were observed. The significant reduction in soluble COD obtained in the corresponding study during the acidogenic stage of the anaerobic process could have oc-curred because of the formation and release of CO2 by fermentative and acetogenic bacteria (Sampaio, 1996).
Barana (1996) obtained 66% reduction in COD for an inlet organic load of 0.33 g COD L-1 d-1; there was a 92% reduction for a 3.75 g COD L-1 d-1 load, but with heavier loads the reduction in COD decreased, reaching 55% with a 8.48 g COD L-1
d-1 load.
The volatile acidity/alkalinity ratio is distinctive in a two-stage system anaerobic process, and suppos-edly higher than 1 at acidogenesis, since at this stage higher concentration of acids is obtained, because of the presence of larger amounts of acidogenic bacteria (Sampaio, 1996).
The ratio between volatile acidity/alkalinity would be important as indication that the digester is or is not stable. Values close to 0.4 would indicate instabil-ity and values above 0.8 would warn that the reactor is collapsing (Souza, 1984, quoted by Barana 1996). Ac-cording to Silva (1977) this ratio should be between 0.06 and 0.2. Hirata (1999), suggests a range between 0.1 and 0.3 as optimal values for this ratio. Working with two-stage digesters for manipueira treatment, Barana (2000) obtained VA/AL values between 0.8 and 1.4 for the methanogenic stage, and even with such values the COD reduction rates were between 49.33% and 85.61%. Dur-ing the second stage, the higher COD reduction, 80%, was obtained with VA/AL values about 2.58. And with the lowest VA/AL ratio, 1.76, there was the lowest COD re-duction, 13% (Tables 6 and 7).
Since the velocity of biomass formation depends on substrate concentration, up to a certain limit, the larger the organic load at the inlet, i.e., substrate, the higher the velocity of multiplication, both for acidogenic and methanogenic bacteria. Therefore, even though larger amounts of organic acids were produced, they could have been consumed by the methanobacteria.
The instability in the process of anaerobic diges-tion of manipueira occurs because of the characteristics of the residue; since it contains a considerable amount of easily-fermentable carbohydrates, the acid stage can occur very rapidly as compared to the methanogenic stage, leading to an accumulation of volatile organic ac-ids (Fernandes Jr. & Takahashi, 1994). One strategy that can be utilized to control this fact is to physically sepa-rate the stages, i.e., to perform the acid and methanogenic digestion stages in individual and sepa-rate reactors, aiming to opesepa-rate them with higher effi-ciency and stability.
Table 6 - Chemical oxygen demand (COD), total solids (TS), volatile solids (VS), and reduction in COD, TS and VS in the effluent from organic loads during the second stage.
d a o l c i n a g r o t s r i F
T R
H Samplingdate COD ReductioninCOD TS ReductioninTS VS ReductioninVS
L
g -1O
2 --- %---
-2nd 09/05 2.22 0 - 0 -
-3rd 09/09 1.58 18 0.50 0 0.39 0
4th 09/12 1.03 46 0.28 0 0.08 67
d a o l c i n a g r o d n o c e S
2nd 09/20 0.99 71 0.19 46 0.05 84
3rd 09/27 1.01 70 0.13 63 0.07 78
4th 10/01 1.00 71 0.13 63 0.07 78
d a o l c i n a g r o d r i h T
2nd 10/08 544 83 0.20 62 0.14 71
3rd 10/15 1103 66 0.26 51 0.17 64
4th 10/19 1121 66 0.37 30 0.15 69
d a o l c i n a g r o h t r u o F
2nd 10/26 8.01 18 0.35 47 0.13 78
3rd 10/30 8.01 18 0.38 42 0.09 85
REFERENCES
AMERICAN PUBLIC HEALTH ASSOCIATION. Standard methods for the examination of water and wastewater. 18 ed. Washington: APHA, 1992.
ARMENANTE, P.M. Biotreatment of industrial and hazardous waste. In.: LEVIN, M. A.; GEALT, M.A. New York: McGraw-Hill, 1993. BARANA, A.C. Estudo de carga de manipueira em fase metanogênica em
reator anaeróbio de fluxo ascendente e leito fixo. Botucatu: UNESP/ FCA, 1996. 80p. (Dissertação – Mestrado)
BARANA, A.C. Avaliação de tratamento de manipueira em biodigestores fase acidogênica e metanogênica. Botucatu: UNESP/FCA, 2000. 95p. (Tese - Doutorado)
DAMASCENO, S. Manipueira como substrato para desenvolvimento de
Geotrichum fragans. Botucatu: UNESP/FCA, 1998. 117p. (Tese -Doutorado)
FERNANDES JR., A. Ocorrência de instabilidade e forma de seu controle na digestão anaeróbia de manipueira em reator de bancada de mistura completa. Botucatu: UNESP/FCA, 1989. 118p. (Tese – Mestrado) FERNANDES JR., A.; TAKAHASHI, MRefe. Tratamento da manipueira
por processos biológicos - aeróbio e anaeróbio. In: CEREDA, M. P.
Resíduos da industrialização da mandioca. São Paulo: Paulicéia, 1994, p.133-150.
FERNANDES JR., A . Digestão anaeróbia de manipueira com separação de fases: cinética da fase acidogênica. Botucatu: UNESP/FCA, 1995. 139p. (Tese - Doutorado)
FIORETTO, R.A. Efeito da manipueira aplicada em solo cultivado com mandioca (Manihot esculenta, Crantz). Botucatu: UNESP/FCA, 1985. 112p. (Dissertação - Mestrado)
HIRATA, Y.S. Coleta, preservação e caracterização de efluentes. Florianópolis: UFSC, Faculdade de Engenharia Química e de Alimentos, 1999.
KUBIAK, C.; DUBUIS, T. Valorização dos objetos e dos efluentes agrícolas, industriais e domésticos. In: SCRIBAN, R.; ARNAUD, A.; PEREIRA, M.E.G.G. Biotecnologia. São Paulo: Manole, 1985. p. 401-421. LACERDA, T.H.M. Estudo cinético da fase metanogênca de substrato de
manipueira. Botucatu: UNESP/FCA, 1991. 114p. (Tese - Doutorado) LETTINGA, G.; HULSHOFF POL, L.W. UASB - Process design for various
types of wastewaters. Water Science Technology, v.24, p.87-107, 1991. MENEZES, T.J.B. de. Mandioca, resíduos e subprodutos para produção de biomassa protéica. In: CEREDA, M.P. Resíduos da industrialização
da mandioca. São Paulo: Paulicéia, 1994. p.101-108. Received October 26, 2001
NOGUEIRA, L.A H. Biodigestão:a alternativa energética. São Paulo: Nobel, 1986. 93p.
PONTE, J.J. da; FRANCO, A. Manipueira, um nematicida não convencional de comprovada potencialidade. Nematologia Brasileira, v.7, p.21-25, 1983.
PONTE, J.J. da; FRANCO, A.; SANTOS, J.H.R. Eficiência da manipueira no controle de duas pragas da citricultura. In: CONGRESSO BRASILEIRO DE MANDIOCA, 7., Recife, 1992. Anais. Recife: Sociedade Brasileira de Mandioca, 1992. p.59.
PONTE, J. J. da Uso da manipueira como insumo agrícola: defensivo e fertilizante. In: CEREDA, M. P. Manejo, uso e tratamento de subprodutos da industrialização da mandioca. São Paulo: Fundação Cargill, 2001. p.80-95.
SAMPAIO, B.M.L. Viabilidade do processo de tratamento anaeróbio do resíduo da industrialização da mandioca em sistema de duas fases. Maringá: UEM, 1996. 176p. (Dissertação – Mestrado)
SANTOS, C.F.C.; PASTORE, G.M.; DAMASCENO, S.; CEREDA, M. P. Produção de biosurfactantes por linhagens de Bacillus subtilis utilizando manipueira como substrato. Revista Ciência e Tecnologia de Alimentos, v.33, p.157-161, 2000.
SENA, E.S.; PONTE, J.J. da. A manipueira no controle da Meloidoginose da cenoura. Nematologia Brasileira, v.6, p.95-8, 1982.
SILVA, M.O.S.A. Análises físico-químicas para o controle de estações de tratamento de esgotos. São Paulo: CETESB, 1977. 226p. SOUZA, M.E. Fatores que influenciam a digestão anaeróbia. Revista DAE,
v.44, p.88-94, 1984.
STRONACH, S.M.; RUDD, T.; LESTER, J.N. Start-up of anaerobic bioreactors on high strength industrial wastes. Biomass, v.13, p.173-197, 1987.
WOSIACKI, G.; FIORETTO, A.M.C.; CEREDA, M.P. Utilização da manipueira para produção de biomassa oleaginosa. In: CEREDA, M.P.
Resíduos da industrialização da mandioca. São Paulo: Paulicéia, 1994. p.151-161.
d a o L c i n a g r
O HRT EffluentpH MeaneffluentpH Volatileacidity Alkalinity VA/AL
H C g
m 3COOHL-1 mgCaCO
3L 1
-t s r i F
2nd 4.49 4.60 5366 889 6.03
3rd 4.46
4th 4.98
d n o c e S
2nd 4.88 4.90 1654 642 2.58
3rd 4.94
4th 4.90
d r i h T
2nd 4.93 5.00 2737 1356 2.02
3rd 5.08
4th 5.14
h t r u o F
2nd 5.06 5.10 2744 1555 1.76
3rd 5.11
4th 5.23