Anaerobic Treatment of Wastewater from Coffee Pulping
in Upflow Anaerobic Sludge Blanket (UASB) in Two
Stages
M. Bruno
1and R. A. De Oliveira
21 Doutorando em Microbiologia Agropecuária, FCAV-UNESP, marcbruno@itelefonica.com.br
2
Departamento de Engenharia Rural, FCAV-UNESP, oliveira@fcav.unesp.br
Abstract. In this work, the efficiency of two-stage upflow anaerobic sludge blanket (UASB) reactors was
evaluated in bench scale, for treating a liquid effluent from coffee pulping. Hydraulic detention times (HDT) were 4.0; 5.2 and 6.2 days, resulting in organic loading rates (OLR) of 5.8; 3.6 and 3.0 g total COD per (L⋅d)in the first reactor (R1) and HDT of 2.0; 2.6 and 3.1 days with OLR of 5.8; 0.5 and 0.4 g total COD per (L⋅d) in the second reactor (R2). The medium values of total COD affluent varied from 15.440 to 23.040 mg O2/L, and in the effluent to the reactors 1 and 2 were from 1.100 to 11.500 mg O2/L and 420 to
9.000 mg O2/L, respectively. The medium values of removal efficiencies of total COD and TSS varied from
66 to 98% and 93 to 97%, respectively, in the system of treatment with the UASB reactors, in two stages. The content of methane in the biogas varied from 69 to 89% in the R1 and from 52 to 73% in the R2. The maximum volumetric methane production of 0.483 m3
CH4 per (m3 reactor d)was obtained with OLR of 3.6
g total COD per (Lreactor d)and HDT of 6.2 days in the R1. The volatile fatty acids concentration was kept below 100 mg/Lwith HDT of 5.2 and 6.2 days in the R1 and HDT of 2.6 and 3.1 days in the R2.
Keywords. Anaerobic digestion, Phenols, Coffee wastewater
Introduction
A great part of the agro-industrial activities developed in Brazil and in the world has as one of the limiting factors to production the generation of residues and wastewater. The coffee growing today in Brazil, with an estimated production in the harvest 2005/2006, of 40.6 million of bags, (IBGE, 2006) it can in the processing to cause the liberation of solid and liquid wastes. Only 6% of the content of a cherry of coffee picked if it transforms in drink (Pulgarin et al., 1991).
Concerning the processing of the grains post harvest, there are two choice methodologies that can be used: the dry method; drying off the fruits integrally or by wet method, with the drying of the fruits done without peel and mucilage, creating the peeled grains (Matos et al., 1999).
In the processing of the coffee by dry method water is used just in the washers for the separation of impurity, contributing with a small part of the generated residues. In the wet method the largest problem caused by the pulping is the great amount of used water and the high generated pollutant load, in other words, 4 liters of wastewater for liter of washed coffee, peeled and pulping with BDO from 3,100 to 14,340 mg/L , (Matos & Lo Mônaco, 2003).
The wash process and pulping of the coffee propitiates reduction in the expenses of energy during the drying and improvement the quality of drink of the coffee, joining value to the same. However, the wastewater of that process is rich in organic material in suspension and constituent organic in solution (Matos et al., 1999).
Therefore, in this work it was evaluated the efficiency of upflow anaerobic sludge blanket (UASB) reactors in two stages in the treatment of wastewater from coffee pulping with total COD varying from 5,000 to 35,000 mg O2/L , with different hydraulic detention times (HDT) and organic loading rates (OLR).
Material and Methods
The work was accomplished in the Laboratory of Anaerobic Biodigestion and Biomass of the Rural Engineering Department, of Faculdade de Ciências Agrárias e Veterinárias-UNESP, Câmpus of Jaboticabal, The experimental unit with the anaerobic treatment system in two stages (Figure 1), it was constituted by two reactors UASB, in bench scale, installed in series, with volume of 20 L (first stage, R1) and 10 L (second stage, R2), built with tubes and connections of PVC with diameters of 150 and 100 mm and with height of 1.50 and 1.30 m, respectively. The unconventional headspace in the form of a Y, with an angle of 45° in relation to the vertical, it was built as proposed by Van Haandel et al., (1999). The effluent of R1 was driven to R2 by gravity through a tube of PVC, interconnecting the reactors. Also a tank of 5 L was used for storage of the affluent of the reactors UASB. For the measurement of the biogas production were installed a gasometer of PVC in R1 and a gasometer of aluminum in R2 (Figure 1).
This is not a peer-reviewed article. Livestock Environment VIII
Proceedings of the 31 August - 4 September 2008 Conference (Iguassu Falls, Brazil) Publication Date 31 August 2008
Figure 1. Upflow Anaerobic Sludge Blanket (UASB) in two-stage system, feed-pump, influent tank storage andgasometers.
The substrate used for the continuous feeding of the reactors was the water originating to wash and peeling of coffee grounds from Monjolinho's Farm, located in the city of Altinópolis - SP, with medium pH of 4.2; medium concentration of total suspended solids (TSS) of 3,500 mg/L and with medium total COD from 15.440 to 23.040 mg O2/L (Table 1).
For the accomplishment of this work the wastewater of the processing of coffee by wet method was collected in 3 different times, in the beginning (month of June), half (month of July) and final (month of August) of the harvest, being stored under cooling (freezing) during the whole period of the research.
After acclimatization to room temperature the wastewater was drizzled (nylon sieve with square mesh of 1.5 x 1.5 mm), seeking to the separation of the rude solids, as peels and pieces of coffee beans, avoiding like this the blockage of the line of feeding of R1. After having drizzled, the wastewater was neutralized with NaOH seeking to obtain the pH around 7.0 and afterwards it was put in the storage tank in the necessary amount for one day of feeding, constituting the affluent of the anaerobic treatment system in two stages.
The experiment was divided in three assays, being varied the hydraulic detention time (HDT) and the organic load rate (OLR) applied to the reactors UASB as described in the Table 1.
Table 1. Operational conditions of UASB reactors (R1 and R2) and characteristics of influent in the assays 1, 2 and 3.
HDT = hydraulic detention time; OLR = organic loading rate; TSS = total suspended solids; COD = chemical oxygen demand; and VLR = volumetric loading rate.
The start-up of the experiment, with HDT of 4 days in R1, it had duration of only 35 days, because of the collapse of both reactors with 15 days of operation. Consequently, in the assay 2, the HDT in R1 was increased for 6.2 days and afterwards, in the assay 3, reduced for 5.2 days. The duration of these assays was of 45 days, being considered the occurrence of steady-state, with medium values of removal efficiencies and volumetric production of methane with lower variation coefficients to 10%, in the reactors UASB (R1+R2) in two stages, for at least 4 consecutive weeks. For the start-up of the treatment system it was used as inoculum, sludge originating from reactors UASB treating swine wastewater, operating with HDT of 18 h and OLR of 34 g total COD per (L d)with the percentage of CH4 in the biogas of 74% and the volumetric
Assay Period (d)
HDT (d)
TSS (mg/L)
COD (mg O2/L)
OLR (g COD total /(L d))
VLR ( h-1
)
R1 R2 R1 R1 R1 R2 R1 R2
1 35 4.0 2.0 3,590 23,040 5.8 0.50 0.25 0.50
2 45 6.2 3.1 2,978 21,950 3.6 0.32 0.16 0.32
3 45 5.2 2.6 3,390 15,440 3.0 0.40 0.20 0.40
Gasometer Reactor 1 (20 L)
Reactor 2 (10 L)
Feed-Pump
Gasometer
production of 1.325 m3
CH4 per (m3 reactor d). It was added to R1 sludge to fill out 50% of thevolume, with concentration of total solids (TS) and volatile solids (VS) of 55.1 and 44.2 g/L, respectively. The organic load in the sludge (OLS) of R1 during the start-up of the assay 1 was of 0.17 g COD / (g VS d). The same procedure was repeated in the assay 2, because of the collapse of the reactors UASB at the end of the assay, with the acidification and degradation of the sludge, it was substituted by sludge with the same characteristics of the assay 1, with concentration of total and volatile solids of 59.1 and 46.2 g/L. The OLS of R1 during the start-up of the assay 2 was of 0.14 g total COD/(g VS d). The sludge present in the reactors at the end of assay 2 was maintained in assay 3.
The samples of the effluents of the reactors 1 and 2 were collected in the sampling faucets of each reactor. The samples of the feeding of the reactors were collected directly after the neutralization of the affluent with NaOH in the storage tank and the samples of the effluents of the reactors were collected from way to form a composed sample, being collected 50 ml approximately every 30 minutes, totaling a volume of 400 ml of effluent for each reactor.
They were analyzed in these samples: pH; total alkalinity (TA); total suspended solids (TSS) and volatile (TSSV); it chemical oxygen demand (total COD) twice a week, in agreement with APHA, AWWA, WPCF (1998), dissolved COD (CODdiss) it was determined twice a week and the volumetric production of biogas was determined daily through measures in the gasometers, as described by Oliveira (1997), the composition of the biogas was analyzed periodically every 15 days, by gaseous chromatography, according to APHA, AWWA, WPCF (1998). The concentrations of volatile fatty acids (VFA) they were analyzed twice a week, according methodology described by Dilallo and Albertson (1961). The concentrations of total phenols (TF) they were analyzed twice a week, according methodology of Folin-Ciocalteau, described by Shahidi & Naczk, (1995).
Results and Discussion
The first reactor, R1, was fed with coffee pulping wastewater, with mean values of TSS of 3590, 2978 and 3390 mg/L; of total COD 23,040; 21,950 and 15,440 mg O2/L, and dissolved COD of 20,090; 19,190 and 11,610 mg O2/L in assays 1, 2 and 3, respectively (Table 2). It was observed that there was increase along the experiment (of the beginning for the end of the assay 1) and progressive reduction (starting from the assay 2) in the mean values of total and dissolved COD of the influent, what can be attributed to the variations in the amount of liberated organic compositions of the fruits of the coffee plant during the processing, because of concentration alterations during the harvest and / or oscillations of mass of processed fruits (for unit of time or volume of used water), from begin to the end of the crop, with maximum values in the middle of the harvest.
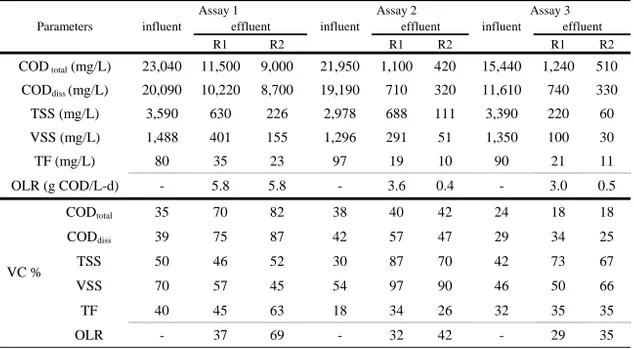
Table 2. Mean values and variation coefficients (VC %) of total COD, dissolved COD, total suspended solids (TSS), volatile suspended solids (VSS), and total phenols (TF) in the influents and effluents, and organic loading rate (OLR) during operation of the UASB reactors (R1 and R2) in two stages, in assays 1, 2 and 3.
Assay 1 Assay 2 Assay 3
influent effluent influent effluent influent effluent
Parameters
R1 R2 R1 R2 R1 R2
COD total(mg/L) 23,040 11,500 9,000 21,950 1,100 420 15,440 1,240 510
CODdiss (mg/L) 20,090 10,220 8,700 19,190 710 320 11,610 740 330
TSS (mg/L) 3,590 630 226 2,978 688 111 3,390 220 60
VSS (mg/L) 1,488 401 155 1,296 291 51 1,350 100 30
TF (mg/L) 80 35 23 97 19 10 90 21 11
OLR (g COD/L-d) - 5.8 5.8 - 3.6 0.4 - 3.0 0.5
CODtotal 35 70 82 38 40 42 24 18 18
CODdiss 39 75 87 42 57 47 29 34 25
TSS 50 46 52 30 87 70 42 73 67
VSS 70 57 45 54 97 90 46 50 66
TF 40 45 63 18 34 26 32 35 35
VC %
The mean values of the organic loading rates (OLR) applied in reactor 1 in assay 1, 2 and 3 were of 5.8, 3.6 and 3.0 g total COD/(L d), respectively (Table 2). In assay 2, the OLR decreased because of the application of larger HDT, looking to avoid the collapse that happened in assay 1. Away in assay 3 the HDT has been decreased the OLR didn't increase because the COD of the influent decreased strongly.
In assay 1, the pH of the effluent of the reactors R1 and R2 decreased, reaching the smallest values of every experiment after 15 days of operation, with a pH of 4.7 and 4.9, respectively, committing the treatment system (Table 3). The fall of the pH in the effluents of reactors 1 and 2 in assay 1 was related to the increase of the concentration of volatile fatty acids (VFA) (Table 4), provoked by the increments of organic load and toxics (phenols) in the influent, which happened after 15 days of operation. The methanogenic microorganisms have great growth in the pH range between 6.6 and 7.4; could have stability in the formation of methane in a wider range, between 6.0 and 8.0 (Chernicharo, 1997). The same didn't happen in assays 2 and 3, when the pH values didn't go limiting to the methanogenesis in reactors 1 and 2, and their stabilities can be attributed to the high values of total alkalinity (TA).
Table 3. Mean values and variation coefficients (VC %) of removal efficiency (%) of total COD, dissolved COD, total suspended solids (TSS), volatiles (VSS), and total phenols (TF) during the operation of the UASB reactors (R1 and R2) in two stages in assays 1, 2 and 3.
Assay 1 Assay 2 Assay 3 Parameters
R1 R1 + R2 R1 R1 + R2 R1 R1 + R2
COD total (mg/L) 55 66 94 98 91 96
COD diss (mg/L) 49 63 96 98 93 97
TSS (mg/L) 79 93 84 97 93 98
VSS (mg/L) 70 87 79 95 91 97
TF (mg/L) 55 72 80 90 73 86
COD total 43 33 3 1 3 2
CODdiss 62 41 2 1 2 1
TSS 15 6 11 2 7 2
VSS 18 10 15 4 6 3 VC %
TF 31 20 7 3 30 11
Table 4. Mean values and variation coefficients (VC %) of pH, volatile fatty acids (VFA), and total alkalinity (TA) in operation of UASB reactors (R1 and R2) in two stages in assays 1, 2 and 3.
Assay 1 Assay 2 Assay 3
influent effluent influent effluent influent effluent Parameters
R1 R2 R1 R2 R1 R2
pH 7.3 5.3 5.7 7.6 7.5 7.9 7.5 7.7 8.0
VFA (mg CH3COOH/L)
791 2,035 1,840 780 70 85 697 68 47
TA (mg CaCO3/L) 1,986 1,693 1,827 1,900 3,043 3,077 1,213 2,201 2,327
pH 8 13 16 8 4 4 5 4 2
VFA 27 57 73 14 61 47 27 33 38
VC %
TA 40 32 17 30 30 28 16 7 12
The disturbances that happened in assay 1 can be related with the no adaptation and accommodation of the sludge used as inoculum to the increases of the organic loading rates and of the organic load in the sludge after the start-up. In the start-up the value of OLR was of 3.8 g total COD/(m3
increment of OLR and of OLS, starting the 15th
day of assay 1, because of the continuous increase of total COD of the influent, promoted by the dissolved organic fraction, reaching values of 34,300 mg O2/L, resulting in the application of OLR of 8.6 g total COD/(m3
d) and OLS of 0.39 g total OLR/(g VS d). This OLR was lower than when the inoculum sludge was submitted, of 34 g total COD/(m3
d), however, in the swine wastewater, the dissolved organic fraction was lower (on the order of 20% of total COD, in agreement with Oliveira (1997)) than observed in wet processing of coffee wastewaters (above 75% of total COD (Table 2)).
Chernicharo (1997) recommended OLR from 0.05 to 0.15 g COD/(g VS d) for the start-up of anaerobic reactors, should be increased gradually in function of the efficiency. For reactors UASB treating sanitarium wastewater, OLS of the order of 0.30 g COD/(g VS d) during the start-up didn't harm the stability of the process in pH terms and of volatile fatty acids. During the permanent regime, OLS can reach, in agreement with the influent type to be treated, values around 2 g COD/(g VS d). Therefore, for the collapse happened in the assay 1 can settle down a relationship with HDT, OLR and the chemical characteristics of the wastewaters from coffee pulping.
Also the largest concentrations of total phenols were verified in the influent accompanying the increase of COD, and in the effluents of the reactors R1 and R2 (35 and 23 mg/L, respectively), indicating increase of the load and the accumulation of compositions highly toxics, intensifying the conditions that provoked the collapse in assay 1.
The medium concentrations of total phenols in the influent varied from 80 to 97 mg/L, values these above allowed it for effluents release, which is of 0.5 mg/L, according to Resolution 357 of CONAMA, (Brazil, 2005). In the treatment system with the reactors UASB in two stages, the largest medium efficiency of removal of phenols happened in the assay 2, reaching 90% and medium concentration in the effluent of 10 mg/L. Luiz et al. (2004) treated wastewaters from coffee pulping in a system composed by reactor UASB of 11.7 L with HDT of 69 h and OLR of 1.12 g COD/(L d), following by facultative aerated pond, they obtained 82% removal of phenols. The toxic action of the phenols may have been one of the factors causes of the collapse happened in the reactors UASB in assay 1, because this composition may have inhibited or even having interrupted the activity of the existent microbiota in the same.
With the collapse of the reactors 1 and 2 in assay 1, due to the increase of total COD of the effluents along the operation period, causing like this the lowers efficiencies of removal of COD of the experiment (Table 3); which were reduced continually, leading to the interruption of assay 1 to the 35 days of operation, when the removals were practically null and the sludge presented aspects of having been deteriorated.
For the continuity of the experiment, in assay 2, reactors 1 and 2 were re-inoculated with sludge of the same origin of the used in the assay 1 and with concentration of volatile solids of 46.2 g/L.The HDT was increased for 6.2 days being applied OLR from 3.2 to 5.7 g total COD/(m3 d) and OLS from 0.14 to 0.24 g total COD/(g VS d) in the reactor 1, during the 10 initial days. Afterwards, the values of total COD of the influent decreased continually, resulting in the application of OLR of the order from 1.5 to 2.5 g total COD/(m3 d) in the reactor 1. In these conditions, the treatment system with the reactors UASB in two stages (R1+R2) it stayed stable, with medium values of efficiency of removal from 95 to 98% for total COD, dissolved COD, TSS and VSS, and of 90% for total phenols, with variation coefficients (VC) from 1 to 4% (Table 3).
In rehearsal 3, with HDT of 5.2 d and medium OLR of 3.0 g total COD/(m3
d), the stability continued with medium values of efficiency of removal of total COD, dissolved COD, TSS and VSS and respective similar VC (Table 3) to the obtained in assay 2. To the concentration total phenols happened increase of VC for 11% with medium efficiency of removal of 86%.
The largest removals happened in the first reactor (R1), but there was important contribution of the second reactor (R2), to improve the stability and to elevate the removals, mainly, of TSS, VSS and total phenols. Those results stayed starting from the 5th
day of assay 2 and during whole of assay 3, indicating that the conditions imposed to the reactors 1 and 2 were representative of stable regime with high removal efficiencies.
In assay 1, the mean concentrations of volatile fatty acids (VFA) in the effluents of reactors R1 and R2 reached values of 2,035 and 1,840 mg CH3COOH/L, respectively (Table 4). These values were a lot above recommended for the stable operation and the maintenance of the activity of the microbiota in the anaerobic reactors, causing acidification. With the reduction of OLR for mean values of 3.6 and 3.0 g total COD/(L d) in assays 2 and 3, respectively, the concentration of VFA in the effluents of reactors R1 and R2 stayed stable and below 200 mg CH3COOH/L, the value mentioned by Lettinga & Hulshoff-Pol (1991) as appropriate for the stable operation of UASB reactors treating sanitary wastewaters.
The largest volumetric and specific productions of methane were obtained in assays 2 and 3 with lower OLR, with 3.6 and 3.0 g total /(L d), respectively, being obtained (Table 5). In the treatment system with the UASB reactors in two stages, 0.483 and 0.453 m3
CH4/(m3 reactor d) and 0.147 and 0.190 m3 CH4/(kg total COD removed), respectively, were produced by the reactors (R1+R2). In assay 1, the lower volumetric production of methane of 0.286 m3
CH4/(m3 reactor d) were verified in the reactors UASB in two stages (R1+R2). Because of the acidification of the reactors in assay 1, the reactor stability was committed causing a decrease in methane production and, because the reactors were operated in a pH and VFA range unfavorable to the activity of the aqueous methanogenics. The percentages of methane in the biogas in reactors R1 and R2 were 69, 88 and 89% and 52, 69 and 73%, respectively, in assays 1, 2 and 3. Bello-Mendoza & Castillo-Rivera (1998) mentioned that Potres & Calzada (1990) and Vinas et al. (1988) obtained removals of COD from 75 to 80% and of 55% and productions of biogas of 0.34 and 5.09 m3
/(m3 d), respectively, treating wastewaters from coffee pulping in hybrid anaerobic reactors (UASB / filter of 10.5 m3
) and UASB (20 L) with OLR 2.2 and 15.0 g COD/(L d). Therefore, it was verified that the increase of the production of methane in UASB reactors in two stages treating wastewaters from coffee pulping is related with increments in applied OLR in conditions of stability, as it can be observed in assays 2 and 3, and as compared with the biogas production rates mentioned by Bello-Mendoza & Castillo-Rivera (1998).
Table 5. Mean values and variation coefficients (VC %) of the daily production of biogas, methane percentage in the biogas, and volumetric and specific production of methane during the operation of UASB reactors (R1 and R2) in two stages, in assays 1, 2 and 3.
Assay CH4 (%)
Daily Biogas Production (x 10-3
m3 /d)
Volumetric CH4 Production (m3
/(m3
reactor d))
Specific CH4 Production (m3
CH4/(kg total COD))
Added Removed
R1 R2 R1 R2 R1 +
R2 R1 R2
R1 +
R2 R1 R2 R1 R2
R1 + R2
1 69 52 12 0.43 12.5 0.417 0.023 0.286 0.089 0.022 0.145 0.029 0.125
2 88 69 16 0.45 16.5 0.708 0.031 0.483 0.166 0.125 0.141 0.169 0.142
3 89 73 15 0.44 15.4 0.663 0.032 0.453 0.173 0.078 0.193 0.128 0.190
1 86 91 13 21 15 24 23 21 40 94 74 80 79
2 31 40 75 10 22 20 10 14 38 33 39 46 43
V C %
3 32 42 21 11 16 20 11 15 36 24 38 35 36
Conclusions
With the UASB treatment system in two stages, it was possible to obtain stable and high efficiencies of removal of COD and suspended solids, above 95%. Methane production was around 0.470 m3
/(m3 d) with mean OLR of 3.0 and 3.6 g COD/(L d) and HDT of 5.2 and 6.2 d in the first reactor, treating wastewater from coffee pulping with COD from 5,000 to 35,000 mg O2/L, total phenols from 40 to 150 mg/L and pH from 7.3 to 7.6, fitting with NaOH. Those conditions were not toxic and the removal of phenols was stable, with mean values from 86 to 90%, indicating the viability of the application of the anaerobic process in two stages.
References
APHA, AWWA, WPCF. 1998. Standard Methods for the Examination of Water and Wastewater. 20th ed. Washington, DC. 619 p.
Bello-Mendoza, R., and M. F. Castillo-Rivera. 1998. Start-up of an anaerobic hybrid (UASB/filter) reactor treating wastewater from a coffee processing plant. Anaerobe, 4: 219-225.
Brasil. 2005. Conselho Nacional do Meio Ambiente (CONAMA), Resolução n° 357, 17/03/05. Dispõe sobre a classificação dos corpos de águas e diretrizes ambientais para o seu enquadramento, bem como estabelece as condições e padrões de lançamento de efluentes, e dá outras providencias. 23p. Chernicharo, C. A. L. 1997. Reatores anaeróbios: Princípios do tratamento biológico de águas residuárias.
Belo Horizonte: Departamento de Engenharia Sanitária e Ambiental, Universidade Federal de Minas Gerais, 246p.
Dilallo, R., and O. E. Albertson. 1961. Volatile acids by direct titration. Journal of Water Pollution Control
Federation, Alexandria, 33(4): 356 – 365.
IBGE. 2006. Fundação Instituto Brasileiro De Geografia E Estatística. Disponível: http://sidra.ibge.gov.br. Acesso em janeiro de.
Lettinga, G., and L. W. Hulshoff-Pol. 1991. UASB: process design for various types of wastewater. Water
Science Technology, Oxford, 24(8): 87 – 107.
Luiz, F. A. R., C. M. M. Campos, and A. C. Carmo. 2004. Partida de um reator UASB em escala laboratorial tratando efluente líquido proveniente do despolpamento do café. In: XXXIII Congresso
Brasileiro de Engenharia Agricola, CONBEA. São Pedro – SP. Anais. 4p. (CD-Room).
Matos, A. T., A. B. Pinto, and J. D. Borges. 1999. Caracterização de águas residuárias da lavagem e despolpa de frutos do cafeeiro e possibilidade de seu uso na fertirrigação. In: III Seminário
Internacional Sobre Biotecnologia Na Agroindustria Cafeeira, Londrina – PR. Anais..., Londrina:
UFPR, IAPAR, IRD, p. 395-396.
Matos, A. T., and P. A. Lo Mônaco. 2003. Tratamento e aproveitamento agrícola de resíduos sólidos e líquidos da lavagem e despolpa dos frutos do cafeeiro. Viçosa-MG: UFV. Boletim técnico n. 7- Universidade Federal de Viçosa, 68p.
Oliveira, R. A. de. 1997. Efeito da concentração de sólidos suspensos do afluente no desempenho e características do lodo de reatores anaeróbios de fluxo ascendente com manta de lodo tratando águas residuárias de suinocultura. 359f. (vol. I e II). Tese (Doutorado em hidráulica e saneamento) – Escola de Engenharia, Universidade de São Paulo, São Carlos.
Pinto, A. B. 2001. Avaliação de gramíneas forrageiras com uso de águas residuárias da lavagem de frutos do cafeeiro em rampas de tratamento. 108 f. Dissertação (Mestrado em engenharia agrícola) – Universidade Federal de Viçosa, Viçosa.
Pulgarin, C., J. P. Schwitzguebel, and R. Tabacchi. 1991. Utilization of wastes from coffee production.
Biofuture, Lausanne, 102: 43-50.
Shahidi, F., and M. Naczk. 1995. Food Phenolics: Sources, Chemistry, Effects and Applications. Basel, Switzerland. Technomic Publishing, 331 p.
Silva, B. A., and C. M. M. Campos. 2005. Tratamento anaeróbio de efluentes líquidos gerados no beneficiamento úmido do café. In: XXXIV Congresso Brasileiro De Engenharia Agrícola, Canoas – RS, Anais, Jaboticabal, SBEA 4p. (CD Room).