ISSN 0104-6632 Printed in Brazil
www.abeq.org.br/bjche
Vol. 31, No. 03, pp. 603 - 612, July - September, 2014 dx.doi.org/10.1590/0104-6632.20140313s00002458
Brazilian Journal
of Chemical
Engineering
BIOHYDROGEN PRODUCTION FROM CASSAVA
WASTEWATER IN AN ANAEROBIC FLUIDIZED
BED REACTOR
N. C. S. Amorim¹, I. Alves¹, J. S. Martins¹ and E. L. C. Amorim
1*1Technology Center, Federal University of Alagoas, Av. Lourival Melo Mota, s/n, Cidade Universitária, CEP: 57072-900, Maceió - AL, Brazil.
E-mail: [email protected]
(Submitted: December 19, 2012 ; Revised: May 19, 2013 ; Accepted: September 5, 2013)
Abstract - The effect of hydraulic retention time (HRT) and organic loading rate (OLR) on biological hydrogen production was assessed using an anaerobic fluidized bed reactor fed with cassava wastewater. The HRT of this reactor ranged from 8 to 1 h (28 to 161 kg COD/m3-d). The inoculum was obtained from a facultative pond
sludge derived from swine wastewater treatment. The effluent pH was approximately 5.00, while the influent chemical oxygen demand (COD) measured 4000 mg COD/L. The hydrogen yield production increased from 0.13 to 1.91 mol H2/mol glucose as the HRT decreased from 8 to 2 h. The hydrogen production rate significantly
increased from 0.20 to 2.04 L/h/L when the HRT decreased from 8 to 1 h. The main soluble metabolites were ethanol (1.87-100%), acetic acid (0.00-84.80%), butyric acid (0.00-66.78%) and propionic acid (0.00-50.14%). Overall, we conclude that the best hydrogen yield production was obtained at an HRT of 2 h.
Keywords: Anaerobic fluidized bed reactor; Dark fermentation; Cassava wastewater; Hydrogen production;
Organic loading rate.
INTRODUCTION
Global energy demand is rising to meet societies’ needs in the modern world, with oil and its deriva-tives representing the most frequently used energy sources today. However, the overuse of fossil fuels could result in the depletion of this energy source and negative environmental impacts caused by gases generated during its combustion (Kapdan and Kargi, 2006).
Due to pressing environmental issues and in-creasing energy demand, the search for alternative – i.e., renewable and less polluting – energy sources has gained prominence. Hydrogen is an alternative source of energy that could replace petroleum-based fuels because water and energy are the only byprod-ucts of its combustion with oxygen (Van Ginkel et al., 2001). Moreover, hydrogen is the most abundant
chemical element in the universe, comprising almost three-quarters of the universe’s entire mass (Das and Verziroglu, 2001). Although abundant, hydrogen is often found combined with other elements in the natural environment (Das and Verziroglu, 2001), and a range of different processes are required to isolate it.
The main methods of producing hydrogen em-ploy fossil fuels, water and biological processes. However, hydrogen production from fossil fuels by steam reforming, or from water by electrolysis and thermochemical decomposition, may not be envi-ronmentally friendly and can also be uneconomical (Amorim et al., 2009).
these materials (Reis and Silva, 2011). The use of agro-industrial residues in biological hydrogen pro-duction has also been investigated for the same rea-son (Luo et al., 2010a; Cappelletti et al., 2011).
Cassava is a typical Brazilian agricultural product that is widely used in the production of flour and starch (Cappelletti et al., 2011; Wosiacki and Cereda, 2002). In some of Brazil’s northeastern states, cas-sava is cultivated in small plantations by traditional farming means. Cassava is processed either by hand in small flourmills and cake factories or by mecha-nized units. During the production of flour, cassava undergoes a pressing process, and the wastewater de-rived from the pressing is called cassava wastewater.
Cassava wastewater has high energy content – approximately 20-40 g of carbohydrate per liter – with high potential for pollution if improperly dis-carded into the environment. However, the energy potential of cassava wastewater makes it very attrac-tive as a substrate for hydrogen production, and its use in this process would reduce the environmental impact of disposing it without prior treatment (Cappelletti et al., 2011).
Some studies using cassava wastewater as sub-strate have already been conducted, and their results indicate that its use in hydrogen production is eco-nomically viable (Luo et al., 2010a; Cappelletti et al., 2011; Wosiacki and Cereda, 2002; Cheng et al., 2011; O-Thong et al., 2011; Luo et al., 2010b). However, these studies all used batch reactors in their experi-ments. Working from these researchers’ achieve-ments, the main purpose of this study is to produce hydrogen from cassava wastewater in an anaerobic fluidized bed reactor (AFBR). The employment of the AFBR is justified by its many positive features, such as the accumulation of large amounts of bio-mass attached to the support medium, high organic loading rates (OLR), low hydraulic retention times (HRT), and good mixing characteristics, which op-timize mass transfer between the substrate and mi-croorganisms. In addition, AFBR allows high-speed stirring in the liquid phase, which favors hydrogen release at this stage (Wu et al., 2003; Lin et al., 2006; Zhang et al., 2007).
Hydrogen production in an AFBR has been stud-ied by some researchers, who were successful in evaluating this reactor’s usefulness (Amorim et al., 2009; Reis and Silva, 2011; Shida et al., 2009; Barros
et al., 2010). However, the production of bio-hydro-gen from actual substrate, such as cassava wastewa-ter, in an AFBR has not yet been evaluated. These prior studies concluded that some aspects influencing hydrogen production should be further explored, especially the use of actual substrate. Therefore, the
aim of this investigation was to study an AFBR us-ing cassava wastewater for hydrogen production.
EXPERIMENTAL PROCEDURE
Inoculum and Fermentation Medium
The inoculum used in this experiment was ob-tained from a facultative pond sludge derived from swine wastewater treatment. The sludge was sub-jected to 10 min of heat treatment at 90 ºC to inacti-vate the H2 consumers and harvest
endospore-form-ing anaerobic bacteria (Maintendospore-form-inguer et al., 2008). The medium used for H2 fermentation contained
cassava wastewater and the following nutrients (mg/L): CH4N2O, 125; NiSO4·6H2O, 1; FeSO4·7H2O,
5; FeCl3·6H2O, 0.5; CaCl2·6H2O, 47; CoCl2·2H2O,
0.08; SeO2, 0.07; KH2PO4, 85; KHPO4, 21.7; and
Na2HPO4·2H2O, 33.4 (Amorim et al., 2009).
The cassava wastewater used here was produced by a manioc flour factory in Taquarana, Alagoas, Brazil. The main characteristics of the cassava wastewater were as follows: pH 5.53, total solids 4.45 g/L, volatile solids 3.4 g/L, total carbohydrate 37.54 g/L, chemical oxygen demand (COD) 66.19 g COD/L, total nitrogen 1.26 g/L. After it had been collected, the cassava wastewater was stored at 5 °C before usage. We chose to use the cassava wastewa-ter with COD of 4 g COD/L, because, according to Amorim et al. (2012), this concentration might favor the production of acetic acid and butyric acid (route that favors hydrogen production), whereas higher substrate concentrations would favor the production of solvents. Furthermore, Cappelletti et al. (2011) concluded that a lower cassava wastewater COD produces a large amount of hydrogen.
Support Material
Particles of expanded clay (2.8–3.35 mm) were used as the support material for biomass immobili-zation. The material had an apparent density of ap-proximately 1.06 g/cm3 and a porosity of 23%. Reactor
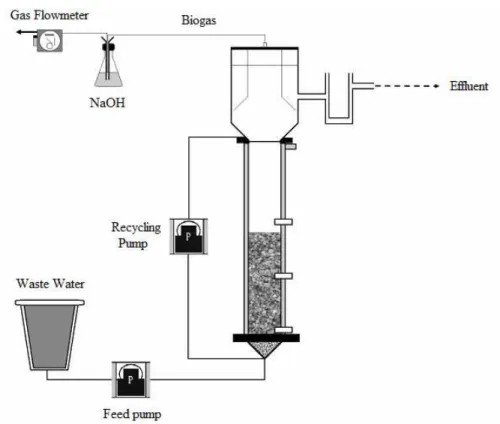
Figure 1: Schematic of the anaerobic fluidized bed reactor.
Operating Conditions of the AFBR
The AFBR was fed with cassava wastewater at 4,000 mg COD/L and 10% v/v of heat-treated sludge. The operation temperature was ambient (28 ± 2 °C). For the AFBR system, the total liquid flow rate, Q, was controlled at 128 L/h (bed expansion = 30%) (Amorim et al., 2009). This flow rate produced a su-perficial velocity 1.30 times greater than the mmum fluidization velocity. The bioreactor was ini-tially operated in batch mode for 48 h to activate the H2-producing sludge, after which it was switched to
a continuous mode with a designated hydraulic re-tention time of 8 h.
After reaching steady-state operation based on a constant volumetric H2-production rate within a
variation of 5-10% for 10-15 days, the HRT was decreased progressively from 8 h to 1 h. The reactor was operated for 164 days, and the compositions of the soluble metabolites (volatile fatty acids and alco-hol) produced during H2 fermentation were
moni-tored as functions of time. The reactor was operated at an effluent pH of 5.00±0.48. A gas–liquid separa-tor was used at the effluent outlet to collect gaseous and soluble products separately. A gas meter (Type
TG1; Ritter Inc., Germany) was used to measure the amount of gaseous products generated (Amorim et al., 2009).
Chemical Analysis
The volatile fatty acid (VFA) and alcohol con-centrations were measured using a gas chromato-graph (GC-2010, Shimadzu, Tokyo, Japan) equipped with a flame-ionization detector (FID), a COMBI-PAL headspace autosampler (AOC model 5000) and a Zebron ZB-WAX column (30 m long × 0.25 mm i.d. × 0.25 μm film thickness) (Maintinguer et al., 2008). The biogas hydrogen content was measured using a gas chromatograph (GC-2010, Shimadzu, Japan) with a thermal conductivity detector (TCD) with argon as the carrier gas, and the column was packed with Supelco Carboxen 1010 Plot (30 m × 0.53 mm i.d.) (Maintinguer et al., 2008).
RESULTS AND DISCUSSION
Effect of HRT and OLR on Hydrogen Production
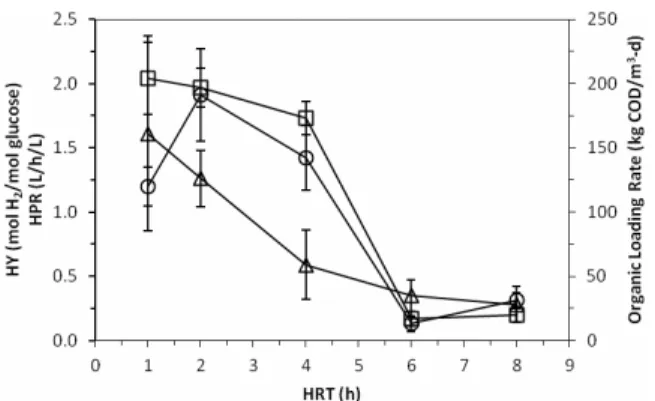
Figure 2 shows the variation in the hydrogen pro-duction rate (HPR), hydrogen yield (HY) and or-ganic loading rate (OLR) as a function of the hy-draulic retention time (HRT).
Figure 2: Effect of HRT and OLR (∆) on the per-formance of AFBR H2 production rates and yields.
HY (○) is the H2 yield (the amount (mol) of H2
formed)/(the amount (mol) of glucose consumed); HPR (□) is the H2 production rate.
As in other studies (Amorim et al., 2009; Reis and Silva, 2011; Shida et al., 2009; Barros et al., 2010), this study showed an increase in HPR from 0.20 to 2.04 L/h/L when the HRT was reduced from 8 h to 1 h by increasing the OLR from 28 kg COD/m3-d to 161 kg COD/m3-d, respectively. The HY also behaved in the same way as in previous studies, in that it was observed to increase when the HRT was reduced from 8 h (0.31 mol H2/mol
glu-cose) to 2 h (1.91 mol H2/mol glucose) or when the
OLR was increased from 28 kg COD/m3-d to 126 kg COD/m3-d. A decrease in the HY was subsequently observed when the HRT was reduced to 1 h (1.20 mol H2/mol glucose). This finding was also observed
in previous studies employing an AFBR (Amorim et al., 2009; Reis and Silva, 2011; Shida et al., 2009; Barros et al., 2010), and such behavior may be at-tributed to overloads caused by a high OLR (161 kg COD/m3-d) or kinetic limitations (Amorim et al., 2009).
Shida et al. (2009) found that reducing the HRT from 8 h to 1 h resulted in an increase in HPR, which reached its highest value (1.28 L/h/L) at an HRT of 1 h. The HY increased when the HRT was reduced from 8 h to 2 h, i.e., from 1.84 mol H2/mol glucose
to 2.29 mol H2/mol glucose, respectively. By
reduc-ing the HRT to 1 h, the HY decreased to 2.10 mol H2/mol glucose.
Amorim et al. (2009) obtained an increase in HPR from 0.08 L/h/L to 0.97 L/h/L when the HRT was reduced from 8 h to 1 h (the OLR increased from 15.7 kg COD/m³-d to 116.6 kg COD/m³-d). Additionally, the HY increased from 1.41 mol H2/mol glucose to 2.49 mol H2/mol glucose when the
HRT was reduced from 8 h to 2 h (the OLR from 15.7 kg COD/m³-d to 66.5 kg COD/m³-d) and de-creased to 2.41 mol H2/mol glucose when the HRT
was reduced to 1 h (116.6 kg COD/m³-d).
Barros et al. (2010) observed the same behavior when using expanded clay as the support material in an AFBR. The HY values ranged from 1.51 mol H2/mol glucose to 2.59 mol H2/mol glucose when the
HRT varied between 8 h and 2 h and decreased when the HRT was reduced to 1 h (1.84 mol H2/mol
glu-cose). The highest HPR (1.21 L/h/L) was also ob-tained at an HRT of 1 h.
Reis and Silva (2011) observed a similar behav-ior; their HPRmax was 1.22 L/h/L at an HRT of 1 h.
In addition, the HY ranged from 1.53 mol H2/mol
glucose to 2.55 mol H2/mol glucose when the HRT
was reduced from 8 h to 2 h and decreased to 1.87 mol H2/mol glucose at an HRT of 1 h.
Figure 3 shows the variation in the H2 content as
a function of the HRT. As in other studies (Amorim
et al., 2009; Reis and Silva, 2011; Shida et al., 2009; Barros et al., 2010), this study showed that the H2
content increased significantly from 8% to 48% when the HRT was decreased from 8 to 2 h. After decreasing the HRT from 2 h to 1 h, the H2 content
decreased to 30%. No methane was found in the biogas.
Figure 3: Effect of HRT on the performance of the AFBR in terms of glucose conversion (■), pH (○) and H2 content (∆). Glucose conversion is (the amount
Composition of Soluble Products
In addition to ethanol, the presence of acetic, propionic, and butyric acids was observed during the AFBR operation. Table 1 shows the distribution of soluble microbial products (SMP) as a function of HRT. Ethanol was the most common metabolite during reactor operation (1.87% to 100% of the SMP), with its concentration ranging between 23.57 mg/L (0.51 mM) and 30.46 mg/L (0.66 mM) when the HRT was reduced from 8 h to 6 h or when the OLR increased from 28 kg COD/m3-d to 35 kg COD/m3-d, and it presented an average production of 25.87 mg/L (0.56 mM), indicating an insignificant change in the production of this metabolite throughout AFBR operation.
Dabrock et al. (1992) found that ethanol produc-tion is minimally influenced by changes in pH. In addition, according to the authors, solvent was pro-duced at low concentrations (2 mM to 5 mM) at pH values ranging between 4.8 and 7. The pH variation in this study was similar to that observed by Dabrock
et al. (1992) (4.18 to 5.58) and may not have had an impact on ethanol production.
The presence of ethanol in all phases may be in-dicative of hydrogen production through the meta-bolic pathway that generates both ethanol and hy-drogen (Eq. (1)), as reported by Zhu et al. (2009).
6 12 6 2 2 5 3
2 2
C H O H O C H OH CH COOH
2H 2CO G 201kJ / mol
+ → +
+ + Δ = − (1)
Propionic acid was the second most common metabolite during the experiment (0.00% to 50.14% of the SMP). This behavior can be explained by the fact that the metabolic pathway that generates this acid is the most favored (as ΔG of metabolic path-ways) of all pathways (Eq. (2)).
6 12 6 2 3 2
2
C H O 2H 2CH CH COOH
2H O G 358 kJ mol
+ →
+ Δ = − (2)
The highest production of propionic acid was ob-served at an HRT of 2 h or OLR of 126 kg COD/m3-d (280.98 mg/L or 3.8 mM). However, this production level did not prevent hydrogen production, which also increased at an HRT of 2 h. This result may be attributed to the high production of acetic acid at this HRT (1450 mg/L or 24.17 mM), corresponding to 84.80% of the SMP, the metabolic pathway which is the best in terms of hydrogen yield (HY) (Eq. (3)). Nonetheless, when an electron flow balance of the metabolic pathways is performed, it is possible to verify that hydrogen production is not significantly affected by simultaneous acetic acid production.
6 12 6 2 3 2
2
C H O 2H O 2CH COOH 2CO
4H G 215,69 kJ mol
+ → +
+ Δ = − (3)
Ren et al. (2007) observed that a pH of approxi-mately 5.0 did not provide a stable condition and that microbial populations resulting from the three acido-genic fermentations could coexist at this pH.
During the phase corresponding to an HRT of 2 h, the pH was approximately 5.58. Thus, the production of propionic and acetic acids observed during this phase may have also been influenced by the pH.
Acetic acid production was also observed at an HRT of 4 h or OLR of 59 kg COD/m3-d (80.0 mg/L or 1.33 mM), corresponding to 55.66% of the SMP. Compared to the previous phase, the pH increased from 4.72 (HRT of 6 h) to 5.56 (HRT of 4 h), which may have created the necessary conditions for the initiation of acetic acid production (1.33 mM). In ad-dition, there was a small reduction in the production of propionic acid (0.51 mm at HRT of 4 h) compared to that of the previous phase (0.67 mM at HRT of 6 h or OLR of 35 kg COD/m3-d), thereby indicating possible competition between these two metabolic pathways.
In contrast, acetic acid production was not ob-served at HRTs of 1 h, 6 h, and 8 h or at OLR of 161, 35 and 28 kg COD/m3-d, respectively.
Table 1: Production of soluble metabolites for hydrogen production in the AFBR.
HRT (h)
HAc (mM)
HBu (mM)
HPr (mM)
EtOH (mM)
HAc/SMP %
HBu/SMP %
HPr/SMP %
EtOH/SMP %
TVFA (mM)
SMP (mM) 8 0 ± 0 0 ± 0 0 ± 0 0.51 ± 0.05 0 0 0 100.00 0 0.51 6 0 ± 0 0 ± 0 0.67 ± 0.02 0.66 ± 0.01 0 0 50.14 49.86 0.67 1.33 4 1.33 ± 0.08 0 ± 0 0.51 ± 0.03 0.55 ± 0.03 55.66 0 21.27 23.08 1.84 2.40 2 24.17 ± 0.60 0 ± 0 3.80 ± 0.19 0.53 ± 0.04 84.80 0 13.32 1.87 27.96 28.50 1 0 ± 0 3.04 ± 0.11 0.96 ± 0.04 0.55 ± 0.05 0 66.78 21.13 12.09 4.00 4.56
When the HRT was reduced from 2 h to 1 h or when the OLR was increased from 28 kg COD/m3-d to 161 kg COD/m3-d, the acetic acid metabolic path-way was replaced with the butyric acid pathpath-way (Table 1). The butyric acid production at an HRT of 1 h was 267.71 mg/L (3.04 mM), corresponding to 66.78% of the SMP.
Kim et al. (2004), using a semi-continuous reac-tor, concluded that butyric acid production is favored when the pH is approximately 4.5-5. However, when the reactor is operated at a long enough HRT to grow methanogenic microorganisms, methanogenic activ-ity cannot be completely inhibited by acidic condi-tions (pH of approximately 4.5).
The presence of butyric acid only at an HRT of 1 h (OLR of 161 kg COD/m3-d) may be correlated to the pH value (5.19). This value was close to that obtained by Kim et al. (2004), which provided better conditions for the production of this metabolite.
Table 1 shows that the production of SMP tended to increase when the HRT was reduced from 8 h to 2 h or when the OLR was increased from 28 kg COD/m3-d to 126 kg COD/m3-d. The SMP values dropped significantly when the HRT was reduced to 1 h (OLR of 161 kg COD/m3-d) (Table 1). This phe-nomenon was also observed by Amorim et al. (2009). According to the authors, total volatile fatty acids (TVFA) contributed the most to the SMP, which may indicate that the fermentative production of hydrogen that occurred in their AFBR resulted mainly from acidogenic metabolism. Furthermore, such behavior may be attributed to overloads caused by a high OLR (161 kg COD/m3-d) or kinetic limi-tations (Amorim et al., 2009).
Several other studies, using conditions analogous to those employed during this experiment, also indi-cate similarities regarding the SMP. However, SMP distribution did not always behave in a similar man-ner in these studies (Amorim et al., 2009; Reis and Silva, 2011; Shida et al., 2009; Barros et al., 2010).
Sreethawong et al. (2010), using cassava waste-water in an anaerobic sequencing batch reactor, pro-duced acetic acid ranging from 0.15 g/L (2.5 mM) to 0.87 g/L (14.5 mM). The authors also observed the presence of butyric acid, the concentration of which ranged from 0.53 g/L (6.2 mM) to 3.73 g/L (42.39 mM). Ethanol was produced in small concen-trations (less than 0.01 g/L or 0.22 mM), whereas the propionic acid concentrations ranged from 0.073 g/L (0.99 mM) to 0.36 g/L (4.86 mM).
Cappelletti et al. (2011) also used cassava waste-water as substrate, and the authors evaluated the effect of varying the cassava wastewater concentra-tion. They carried out a series of batch tests at
con-centrations of 30, 15, 10, 7.5 and 5 g COD/L and ob-tained acetic acid concentrations varying from 0.01 g/L (0.17 mM), by applying 5 g COD/L, to 0.63 g/L (10.5 mM), by applying 10 g COD/L.
The high concentration of acetic acid found in this study at an HRT of 2 h (1450 mg/L or 24,17 mM) coincides with the largest HY (1.91 mol H2/mol
glu-cose). As in previous studies (Amorim et al., 2009; Reis and Silva, 2011; Shida et al., 2009), the best AFBR performance in this study was found at an HRT of 2 h. Despite using a synthetic substrate, these studies (Amorim et al., 2009; Reis and Silva, 2011; Shida et al., 2009) also indicated the presence of metabolites related to this research.
Shida et al. (2009), using glucose as the substrate, obtained acetic acid production ranging from 0.30 g/L to 0.49 g/L, or 5 mM to 8.17 mM, by reducing the HRT from 8 h to 2 h. Butyric acid production reached its lowest value (0.35 g/L or 3.98 mM) at an HRT of 8 h and its highest value (0.55 g/L or 6.25 mM) at an HRT of 2 h. The highest ethanol yield (0.097 g/L or 2.11 mM) occurred at an HRT of 6 h.
Amorim et al. (2009) also used glucose as a sub-strate and observed that acetic acid production ranged between 3.76 mM (HRT of 6 h) and 8.87 mM (HRT of 2 h). The authors also obtained characteris-tic butyric acid production: 4.66 mM at an HRT of 8 h and 6.60 mM at an HRT of 2 h. Ethanol production was approximately 1.16 mM at an HRT of 1 h and 2.14 mM at an HRT of 4 h. On the other hand, propionic acid was not observed in any of the phases, which may be attributed to the specific reactor’s operating conditions and the fact that the authors used a synthetic substrate (glucose) under better-controlled conditions.
Under fluid-dynamic conditions similar to those used in this study (upflow velocities of 1.24 cm/s), Reis and Silva (2011) observed that the production of acetic and butyric acid ranged between 0.27 g/L and 0.78 g/L (i.e., 4.5 and 13 mM) and between 0.084 g/L and 0.40 g/L (i.e., 0.95 mM and 4.55 mM), respectively, with the lowest and highest values cor-responding to HRTs of 1 h and 4 h, respectively. The highest production of propionic acid (0.60 g/L or 8.11 mM) occurred at an HRT of 4 h, and ethanol production ranged from 0.92 g/L to 1.38 g/L (20 mM to 30 mM) at HRTs of 6 h and 2 h, respectively.
According to the literature, altering some opera-tional parameters, may contribute to the carriage of methanogenic archaea in reactors and the heat treat-ment of the inoculum, which may result in an in-creased hydrogen yield.
that the highest specific growth rate of methanogenic archaea (μmax = 0.0167 h-1) is significantly lower than that of acidogenic microorganisms (μmax = 0.083 h-1). This finding may indicate that methanogens cannot reproduce or remain in equilibrium under these con-ditions, causing their removal from the reactor.
Furthermore, the heat treatment of the inoculum contributes to the selection of hydrogen-producing bacteria by preventing the growth of hydrogen-con-suming methanogens (Maintinguer et al., 2008).
In this study, the SMP results show that concen-trations of individual acids are influenced by HRT reduction. Nonetheless, the difference found in this study and the other studies discussed demonstrates the need to control the occurrence of acidogenic populations and prevent contamination from other non-hydrogen-producing microorganisms because they could lead to competition for substrate in the system.
COD Removal and Carbon Balance
Figure 4 shows the COD variation as a function of the HRT. The COD removal was observed to range between 12% and 36%, which is in agreement with the acidogenic phase in anaerobic digestion (Shida et al., 2009).
Figure 4: Variation of influent COD (○), effluent (□) and COD removed (Δ) as a function of HRT.
The influent COD ranged from 2.990 mg COD/L (HRT of 1 h) to 4.745 mg COD/L (HRT of 2 h). The effluent COD ranged from 2.388 mg COD/L (HRT of 1 h) to 3.788 mg COD/L (HRT of 8 h). The aver-age influent COD was approximately 4.115 mg COD/L, and the average effluent COD was 3.149 mg COD/L, with an average removal efficiency of 24%.
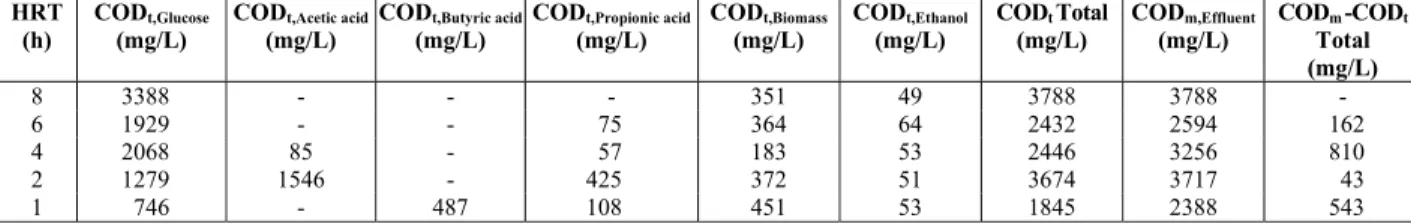
Table 2 shows the difference between the effluent COD measured analytically and the total theoretical COD estimated from the analyzed components. The total theoretical COD is calculated from the sum of the theoretical COD of biomass, the theoretical COD of remaining glucose, and the theoretical COD of metabolites produced during the experiment (Equa-tion (4)), according to Shida et al. (2009).
Total Theoretical Glu cos e Theoretical
Biomass Theoretical
Metabolites Theoretical
COD COD
COD
COD
= + +
(4)
The difference between analytically measured COD and total theoretical COD based on the pro-duced soluble metabolites (Equation (5)) may have a positive result due to the occurrence of other soluble metabolites not identified through chromatographic analysis (Amorim et al., 2009).
(
)
Others Mensured
Pr oducts Glu cose
COD COD
COD COD
=
− + (5)
Table 2 shows that the difference between the ef-fluent COD measured analytically and the total theo-retical COD ranged from 0 mg COD/L (HRT of 8 h) to 810 mg COD/L (HRT of 4 h). This difference between the measured effluent COD and the total theoretical COD was also found in other studies (Amorim et al., 2009; Reis and Silva, 2011; Shida et al., 2009) using an AFBR for hydrogen production.
Table 2: Average of the theoretical COD of the metabolites and biomass, and measured effluent COD.
HRT (h)
CODt,Glucose
(mg/L)
CODt,Acetic acid
(mg/L)
CODt,Butyric acid
(mg/L)
CODt,Propionic acid
(mg/L)
CODt,Biomass
(mg/L)
CODt,Ethanol
(mg/L)
CODt Total
(mg/L)
CODm,Effluent
(mg/L)
CODm -CODt
Total (mg/L)
8 3388 - - - 351 49 3788 3788 -
6 1929 - - 75 364 64 2432 2594 162
4 2068 85 - 57 183 53 2446 3256 810
2 1279 1546 - 425 372 51 3674 3717 43
1 746 - 487 108 451 53 1845 2388 543
The smallest and largest differences obtained by Shida et al. (2009), using glucose as substrate at 2.000 mg COD/L, were 248.31 mg COD/L and 764.20 mg COD/L, respectively. Amorim et al. (2009), using glu-cose at 4.000 mg COD/L, found differences varying from 25 mg COD/L to 1,259 mg COD/L, whereas Reis and Silva (2011), using 5.000 mg COD/L of glucose as substrate, obtained the largest difference (1.602 mg COD/L) by applying fluiddynamic condi-tions similar to those employed in this study (with upflow velocities of 1.24 cm/s).
The authors of these studies attribute this differ-ence to the likely presdiffer-ence of other metabolites un-detected by the chromatographic analysis performed, such as lactic acid and formic acid (Amorim et al., 2009; Reis and Silva, 2011; Shida et al., 2009).
A small amount of hydrogen production (0.20 L/h/L) and a small increase in the HY (0.31 mol H2/mol glucose) was observed in this experiment
during the first phase of AFBR operation (corre-sponding to an HRT of 8 h). Only ethanol production (0.51 mM) was observed during this phase, which may indicate that hydrogen production was accom-plished via the ethanol metabolic pathway. More-over, the lowest pH value (approximately 4.18) ob-served during all AFBR experimentation was meas-ured at the same time.
Van Ginkel et al. (2001) concluded that the opti-mal value for hydrogen production should be be-tween 5.5 and 6.0. Some studies evaluating the use of cassava wastewater as a substrate obtained sig-nificant hydrogen production when the initial pH was between approximately 5.5 and 7.0 (Luo et al., 2010a; Cappelletti et al., 2011; Luo et al., 2010b; Zhu
et al., 2009), but none of them used an AFBR. Com-paring pH values found in the literature, the low HPR and HY values obtained at an HRT of 8 h may have been influenced by the pH in the experiment, which was approximately 4.18.
During the second phase of the experiment (cor-responding to an HRT of 6 h), there was an insig-nificant decrease in HPR and HY to 0.17 L/h/L and 0.13 mol H2/mol glucose, respectively. This finding
may be attributed to the production of propionic acid (0.67 mM) observed during this phase, which is re-lated to a fermentative route detrimental to hydrogen production (Eq. (2)) because its production requires the consumption of 2 moles of this gas. In addition to propionic acid production, the difference between the measured effluent COD and the total theoretical COD was 162 mg COD/L (HRT of 6 h), a difference that may be related to the production of other me-tabolites not identified by the chromatographic
analysis performed, which could have influenced hydrogen production routes.
When an HRT of 4 h was applied, the HPR and HY increased to 1.73 L/h/L and 1.42 mol H2/mol
glucose, respectively. This increase may have been caused by the increase in pH, which reached 5.56 (Luo et al., 2010a; Cappelletti et al., 2011; Luo et al., 2010b; Zhu et al., 2009) and may have favored the production of acetic acid (1.33 mM), which is the metabolite that bolsters hydrogen production the most (Eq. (5)). This phase displayed the largest differ-ence between the measured effluent COD and the total theoretical COD (810 mg COD/L), which sug-gests the existence of other routes favoring hydrogen production and, in turn, justifies the increase in its production.
An HRT of 2 h gave the highest HPR and HY values of 1.92 L/h/L and 1.91 mol H2/mol glucose,
respectively. This stage was also the stage in which the highest production of acetic acid occurred (24.17 mM), which is most likely the preferred metabolic pathway because the production of propionic acid and ethanol was 3.80 mM and 0.53 mM, respec-tively. Furthermore, the small difference between the measured effluent COD and the total theoretical COD may indicate that an insignificant amount of metabolites produced went undetected, and for this reason, the metabolic pathway of acetic acid was favored. The highest pH of approximately 5.58 was also observed during this phase, which fell within the optimum pH range for hydrogen production estab-lished by Van Ginkel et al. (2001) and also within the pH range observed in other studies using cassava wastewater to produce hydrogen through fermenta-tion (Luo et al., 2010a; Cappelletti et al., 2011; Luo et al., 2010b; Zhu et al., 2009).
In addition, Figure 3 (glucose conversion effi-ciency as a function of HRT) shows that the highest glucose conversion efficiency (approximately 65%) was obtained at an HRT of 2 h, which could have promoted higher acetic acid production and, conse-quently, a higher hydrogen yield.
In the phase corresponding to an HRT of 1 h, the HPR displayed a slight increase to 2.04 L/h/L, whereas the HY decreased to 1.20 mol H2/mol
The production of this acid may have had an impact on HPR growth because the production of this metabo-lite is advantageous to hydrogen production (Eq. (6)).
The difference between the measured effluent COD and the theoretical total COD at an HRT of 1 h was 543 mg COD/L. Other unidentified metabolites might have been produced that may have also influ-enced the results found during this phase.
The HY reduction observed in the phase corre-sponding to an HRT of 1 h may also be ascribed to diminished glucose conversion efficiency (46%). Moreover, this HY reduction may be caused by overloading due to a high OLR applied to the reactor (161 kg COD/m³-d) or kinetic limitations (Amorim
et al., 2009).
The fact that ethanol production varied insignifi-cantly throughout the experiment (minimum 0.51 mM and maximum 0.66 mM) indicates that the HRT had little impact on the distribution of this metabolite.
CONCLUSIONS
The results of this experiment indicate that the use of a substrate (cassava wastewater) in an anaero-bic fluidized bed reactor for hydrogen production performs satisfactorily.
Both the HY and the HPR significantly increased when the HRT was reduced, as shown by the maxi-mum values of 2.04 L/h/L (HRT of 1 h and OLR of 161 kg COD/m3-d) and 1.91 mol H2/mol glucose
(HRT of 2 h and OLR of 126 kg COD/m3-d), re-spectively.
The H2 content in biogas increased when the HRT
was reduced and its highest value (48%) was ob-tained in the reactor operated at a HRT of 2 h and OLR of 126 kg COD/m3-d.
The soluble metabolites present during the opera-tion of the reactor were acetic acid, butyric acid, propionic acid and ethanol. The predominance of propionic acid during the 8 h HRT (early phase of operations) was reflected in the low hydrogen pro-duction at this stage. This finding can be attributed to the adaptation phase of the reactor.
The high acetic acid production at an HRT of 2 h coincides with the largest HY, which may be attrib-uted to the greater deflection of the electron flow route for acetic acid production at an HRT of 2 h.
The absence of butyric acid production in the majority of the experiments differs from the findings of previous studies (Amorim et al., 2009; Reis and Silva, 2011; Shida et al., 2009). However, these studies used a synthetic substrate. Because the sub-strate used in this research was real wastewater (cas-sava wastewater), it may have had a different be-havior than that of synthetic substrates, which can
vary in their composition and physico-chemical in-fluence on hydrogen production.
ACKNOWLEDGMENTS
The authors gratefully acknowledge the financial support of CNPq – Conselho Nacional de Desenvol-vimento Cientifico e Tecnológico.
NOMENCLATURE
Abbreviations
AFBR Anaerobic fluidized bed reactor
ΔG Gibbs free energy kJ/mol Q Total liquid flow rate L/h COD Chemical oxygen demand mg COD/L FID Flame ionization detector
HRT Hydraulic retention time h HPR Hydrogen production rate L/h/L HY Hydrogen yield mol H2/mol
glucose HAc Acetic acid concentration mM HBu Butyric acid concentration mM HPr Propionic acid concentration mM EtOH Ethanol concentration mM OLR Organic loading rate kg COD/m3d TCD Thermal conductivity detector
SMP Soluble microbial products mM VFA Volatile fatty acids mM VSS Volatile suspended solids mg/L TVFA Total volatile fatty acids mM µmax Maximum specific growth rate h
-1
REFERENCES
Amorim, E. L. C., Barros, A. R., Damianovic, M. H. R. Z., Silva E. L., Anaerobic fluidized bed reactor with expanded clay as support for hydrogen production through dark fermentation of glucose. International Journal of Hydrogen Energy, 34(2), 783-790 (2009).
Amorim, E. L. C., Sader, L. T., Silva, E. L., Effect of substrate concentration on dark fermentation hy-drogen production using an anaerobic fluidized bed reactor. Applied Biochemistry and Biotech-nology, 166, 1248-1263 (2012).
APHA, Standard Methods for the examination for water and wastewater. 20th Ed. Washington, DC, American Public Health Association/American Water Works Association/Water Environmental Federation (1998).
G. M., Silva, E. L., Biohydrogen production in a anaerobic fluidized bed reactors: Effect of sup-port material and hydraulic retention time. Inter-national Journal of Hydrogen Energy, 35(8), 3379-3388 (2010).
Cappelletti, B. M., Reginatto, V., Amante, E. R., Antônio, R. V., Fermentative production of hy-drogen from cassava processing wastewater by
Clostridium acetobutylicum. Renewable Energy, 36(12), 3367-3372 (2011).
Cheng, J., Su, H., Zhou, J., Song, W., Cen, K., Hy-drogen production by mixed bacteria through dark and photo fermentation. International Journal of Hydrogen Energy, 36(1), 450-457 (2011). Chen, C. C., Lin, C. Y., Chang, J. S., Kinetics of
hy-drogen production with continuous anaerobic cul-tures utilizing sucrose as the limiting substrate. Ap-plied Microbiology and Biotechnology, 57(1-2), 56-64 (2001).
Dabrock, B., Bahl, H., Gottschalk, G., Parameters af-fecting solvent production by Clostridium pasteu-rianum. Applied and Environmental Microbiol-ogy, 58(4), 1233-1239 (1992).
Das, D., Verziroglu, T. N., Hydrogen production by biological process: A survey of literature. Interna-tional Journal of Hydrogen Energy, 26(1), 13-28 (2001).
Dubois, S. M., Gilles, K. A., Hamilton, J. L., Rebers, P. A., Smith, F., Colorimetric methods for deter-mination of sugar and related substance. Analyti-cal Chemistry, 28(3), 350-356 (1956).
Kapdan, I. K., Kargi, F., Bio-hydrogen production from waste materials. Enzyme and Microbial Tech-nology, 38(5), 569-582 (2006).
Kim, I. S., Hwang, M. H., Jang, N. J., Hyun, S. H., Lee, S. T., Effect of low pH on the activity of hy-drogen utilizing methanogen in bio-hyhy-drogen proc-ess. International Journal of Hydrogen Energy, 29(11), 1133-1140 (2004).
Lin, C. N., Wu, S. Y., Chang, J. S., Fermentative hydrogen production with a draft tube fluidized bed reactor containing silicon-gel-immobilized anaerobic sludge. International Journal of Hydro-gen Energy, 31(15), 2200-2210 (2006).
Luo, G., Xie, L., Zou, Z., Wang, W., Zhou, Q., Exploring optimal conditions for thermophilic fermentative hydrogen production from cassava stillage. International Journal of Hydrogen En-ergy, 35(12), 6161-6169 (2010a).
Luo, G., Xie, L., Zhonghai, Z., Zhou, Q., Jing-Yuan, W., Fermentative hydrogen production from cas-sava stillage by mixed anaerobic microflora: Ef-fects of temperature and pH. Applied Energy, 87(12), 3710-3717 (2010b).
Maintinguer, S. I., Fernandes, B. S., Duarte, I. C. S., Saavedra, N. C., Adorno, M. A. T., Varesche, M. B., Fermentative hydrogen production by micro-bial consortium. International Journal of Hydro-gen Energy, 33(16), 4309-4317 (2008).
O-Thong, S., Hniman, A., Prasertsan, P., Imai, T., Biohydrogen production from cassava starch processing wastewater by thermophilic mixed cul-tures. International Journal of Hydrogen Energy, 36(5), 3409-3416 (2011).
Reis, C. M., Silva, E. L., Effect of upflow velocity and hydraulic retention time in anaerobic fluidized-bed reactors used for hydrogen production. Chemical Engineering Journal, 172(1), 28-36 (2011).
Ren, N. Q., Chua, H., Chan, S. Y., Tsang, Y. F., Wang, Y. J., Sin, N., Assessing optimal fermenta-tion type for bio-hydrogen producfermenta-tion in continu-ous-flow acidogenic reactors. Bioresource Tech-nology, 98(9), 1774-80 (2007).
Shida, G. M., Barros, A. R., Reis, C. M., Amorim, E. L. C., Damianovic, M. H. R. Z., Silva, E. L., Long-term stability of hydrogen and organic acids production in a anaerobic fluidized-bed reactor using heat treat anaerobic sludge inoculum. International Journal of Hydrogen Energy, 34(9), 3679-3688 (2009).
Sreethawong, T., Chatsiriwatana, S., Rangsunvigit, P., Chavadej, S., Hydrogen production from cas-sava wastewater using an anaerobic sequencing batch reactor: Effects of operational parameters, COD:N ratio, and organic acid composition. In-ternational Journal of Hydrogen Energy, 35, 4092-4102 (2010).
Van Ginkel, S., Sung, S. W., Lay, J. J., Biohydrogen production as a function of pH and substrate con-centration. Environmental Science & Technology, 35(24), 4726-4730 (2001).
Wosiacki, G., Cereda, M. P., Valuation of cassava processing residues the production of Trichosporon
SP biomass. Exact and Soil Sciences, Agrarian Sciences and Engineering, 8(1), 27-43 (2002). Wu, S. Y., Lin, C. N., Chang, J. S., Lee, K. S., Lin, P.
J., Hydrogen production with immobilized sewage sludge in three-phase fluidized-bed bioreactor. Biotechnology Progress, 19(3), 828-832 (2003). Zhang, Z. P., Tay, J. H., Show, K. Y., Yan, R., Liang,
D. T., Lee, D. J., Jiang, W. J., Biohydrogen pro-duction in a granular activated carbon anaerobic fluidized bed reactor. International Journal of Hy-drogen Energy, 32(2), 185-191 (2007).