Genetic Evidence for Spatio-Temporal Changes in the
Dispersal Patterns of Two Sympatric African Colobine
Monkeys
Tania Minho´s,
1,2* Elizabeth Nixon,
1Cla´udia Sousa,
3,4Luis M. Vicente,
2Maria Ferreira da Silva,
1,5Rui Sa´,
1,3,4and Michael W. Bruford
11Cardiff School of Biosciences, Museum Avenue, CF10 3AX, Cardiff, UK
2CESAM - Centre for Environmental and Marine Studies, Departamento de Biologia Animal, Faculdade de Cieˆncias
da Universidade de Lisboa, C2-P3 Campo Grande, Lisboa, Portugal
3Departmento de Antropologia, Faculdade de Cieˆncias Sociais e Humanas, Universidade Nova de Lisboa, Lisboa,
Avenida de Berna, 26-C/1069-061 Lisboa, Portugal
4Centre for Research in Anthropology, Av. Forc¸as Armadas Ed. ISCTE - sala 2n7,
cacifo 237 1649-026 Lisboa, Portugal
5CIBIO, Centro de Investigac¸a˜o em Biodiversidade e Recursos Gene´ticos,
Campus Agra´rio de Vaira˜o, 4485-661, Vaira˜o, Portugal
KEY WORDS sex-biased dispersal; colobus; non-invasive genetics; relatedness; Guinea-Bissau
ABSTRACT Western black-and-white colobus and Temmink’s red colobus are two forest-dependent African primates with similar ecological requirements, often found in sympatry. Their most striking difference lies in their social system: black-and-white colobus live in small groups with mainly male-mediated dispersal but where females can also disperse, whereas red colobus live in larger groups with males described as philopatric. To investigate whether genetic evidence supports the reported patterns of dispersal based on observational data, we examined eight black-and-white and six red colobus social groups from Cantanhez National Park, Guinea-Bissau. Microsatellite markers revealed a lack of sex-biased dispersal for black-and-white colobus. Gene flow, mainly mediated by females, better explained the genetic patterns found in red colobus, with some evidence for less extensive male dispersal. In contrast to
the microsatellite data, low mitochondrial diversity for the black-and-white colobus suggests that historical and/ or long-range male-mediated gene flow might have been favored. In red colobus, the co-existence of three diver-gent mitochondrial haplogroups suggests that the Can-tanhez population contains a secondary contact zone between divergent lineages that evolved in allopatry. Female-biased dispersal in this species may be a major factor contributing to the colonization by such differenti-ated mitochondrial lineages in the region. Overall, we find evidence for a spatio-temporal change in the disper-sal patterns of the colobus monkeys of Cantanhez, with mitochondrial DNA indicating dispersal by mainly a sin-gle sex and microsatellite data suggesting that recently both sexes appear to be dispersing within the population. Am J Phys Anthropol 000:000–000, 2013. VVC2013 Wiley
Periodicals, Inc.
Sex-biased dispersal has evolved in many group-living animals and is an almost ubiquitous feature of primate life-histories. Understanding a species’ dispersal system is necessary for the study of its socio-ecology, population dynamics and genetic structure (reviewed in Lawson Handley and Perrin, 2007). An individual may be induced to disperse by various proximate causes such as pressure from within the group or attraction to extra-group individuals (Jones, 2003). Evolutionary theories attempt to explain the ultimate causes of dispersal and view it as a mechanism for the avoidance of negative consequences of group-living (e.g. Hamilton, 1967; Dob-son 1982; Pusey, 1987; Pusey and Parker, 1987; Clut-ton-Brock, 1989). Dispersal can, for instance, reduce inbreeding, competition between kin for local resources and competition between mates (Lawson Handley and Perrin, 2007). Dispersal, however incurs costs to the individual. For example, lack of familiarity with a terri-tory renders an individual vulnerable and may reduce its ability to find resources. There is also a risk of aggression from groups that the dispersing individual may encounter (Jack and Isbell, 2009). Interaction between forces that promote and oppose dispersal may
explain the imbalance in dispersal rates and distances between the sexes.
Aspects of a species’ biology such as sex-biased disper-sal are expected to leave traces in an organism’s genome (Avise, 1994; Sunnucks, 2000; Di Fiore, 2003) and can be seen through variance in allele frequencies among social groups (Altmann et al., 1996; Dobson et al., 1998;
Additional Supporting Information may be found in the online version of this article.
Grant sponsor: Fundac¸a˜o para a Cieˆncia e Tecnologia; Grant num-bers: SFRH/BD/40574/2007.
*Correspondence to: Tania Minho´s, Cardiff School of Biosciences, Museum Avenue, CF10 3AX, Cardiff, UK.
E-mail: [email protected] or [email protected]
Received 23 March 2012; accepted 5 December 2012
DOI 10.1002/ajpa.22223
Gompper et al., 1998, Hammond et al., 2006). The clonal maternal inheritance of mtDNA means that for female philopatry, haplotype diversity is expected to be low within groups, due the lack of arrival of new haplotypes, genetic drift and lineage sorting (Avise, 1994; Di Fiore, 2003). For species in which females disperse, mtDNA di-versity is expected to be high, due to the introduction of novel haplotypes by immigrating females. However, not only is group diversity expected to differ among dispersal modes, but also substructure patterns within popula-tions. While both mitochondrial haplotype and microsa-tellite allele frequencies in female-dispersing species are expected to be homogeneous (e.g., Melnick and Hoelzer, 1992; Morin et al., 1994; Di Fiore, 2003), female-philopa-try is expected to lead to high mitochondrial differentia-tion between groups in contrast to autosomal markers, as male dispersal will homogenize this genome through-out the population (Avise, 1994; Di Fiore, 2003). This pattern was recently found for the squirrel monkey (Saimiri oerstedii citrinellus) (see Blair and Melnick, 2012) where previous observational data suggested female dispersal but genetic data indicated that males might be the main dispersers, at least over longer dis-tances. Dispersal mechanisms are not always easy to predict based on systematics alone (e.g., Faulkes et al., 1997) and can vary among closely related species as in, for example, squirrel monkeys (Boinski et al., 2005) and can even vary among populations of the same species as in the white-bellied spider monkeys (Di Fiore, 2009). The African colobines also illustrate this variation very well; besides the fact that black-and-white colobus and red colobus are known to exhibit different modes of disper-sal, variation in dispersal patterns have also been reported among species of the two genera (Harris et al., 2009; Struhsaker, 2010).
Western black-and-white colobus (Colobus polykomos) and Temmink’s red colobus (Procolobus badius tem-minckii) belong to the Old-World sub-family Colobinae. African colobus monkeys share many aspects of their ecology such as predominantly arboreal lifestyles within the forests (Oates, 1994) and dietary similarities—with most species favoring young foliage including some seeds, mature leaves, flower, and fruits (Oates et al., 1994). Nevertheless, group sizes are consistently different, with P. b. temminckii living in large groups, averaging 25–40, in comparison to C. polykomos groups with 16 or fewer individuals (Oates, 1994). Group composition between the two species also differs: red colobus groups are usually multi-male, multi-female, with a minimum of three adult males and at least twice as many adult females; black-and-white colobus groups on the other hand, consist of multiple females with often only one adult male (Oates, 1994). A major difference between the two species’ social systems is their pattern of dispersal. In black-and-white colobus, although dispersal is reported to be more biased towards males, both sexes have already been described to disperse (e.g., C. polykomos: Korstjens et al,. 2002; C. santanas: Fleury and Gautier-Hion, 1999; C. guereza: Harris et al., 2009; C. vellerosus: Teichroeb et al., 2009), while in red colobus, females are the main dispersers (Marsh, 1979; Starin, 1991, 1994; Struhsaker, 2010). Female dispersal in black-and-white colobus has been explained as either a consequence of intra-group competi-tion for resources or inbreeding avoidance (Korstjens et al., 2002, 2005; Harris 2005). As they feed on patchily distributed species within their home range, territory expansion is energetically costly. Consequently, young
females may be forced to disperse in order to avoid increasing group size (Korstjens et al., 2005). These two related species (Ting, 2008) share similar ecological requirements, exhibit contrasting social systems and often live in sympatry, and are therefore good models for understanding the determinants of dispersal behavior and its impact on the genome.
Western black-and-white colobus occurs from southern Senegal to the Ivory Coast (Gippoliti and Dell’Omo, 2003), whileP. b. temminckiioccurs in Senegal, Gambia, northern Guinea and Guinea-Bissau (Oates et al., 1994). The socio-ecology of these two primates has been studied previously (C. polykomos: Galat and Galat-Luong, 1985; Dasilva, 1989 and 1992; Korstjens, 2001; Korstjens et al., 2005 and P. b. temminckii: Marler, 1970; Struhsaker, 1975; Struhsaker and Leland, 1979; Starin, 1991 and 1994), although not in Guinea-Bissau. Little is known about African colobine population genetic diversity and structure. The studies conducted so far have focused only on few colobus populations from eastern Africa (Harris et al., 2009; McDonald and Hamilton, 2010; Mbora and McPeek, 2010). Harris et al. (2009) used both observational and genetic data to describe the complex dispersal system of a Colobus guereza population in Uganda, where the genetic structure of social groups is shaped by male-mediated gene flow together with less common episodes of female dispersal. McDonald and Hamilton (2010) examined the genetic diversity and phy-logenetic relationships among Kenyan and Tanzanian Colobus angolensis palliatuspopulations. Only one study on red colobus (Piliocolobus badius rufomitratus) has been reported from the Tana River in Kenya, which eval-uated mitochondrial diversity within this population (Mbora and McPeek, 2010).
Here we intensively sampled several social groups for both colobus species in Cantanhez National Park, Guinea-Bissau (Fig. 1), to evaluate the effect of dispersal patterns on genetic diversity, within-population struc-ture and historical demographic processes. Given that female dispersal is expected for both species, we pre-dicted the two species to exhibit similar patterns of mito-chondrial diversity and structure: high genetic diversity and homogenized haplotypes throughout the population. For nuclear DNA, we did not expect to find differences between sexes forC. polykomos as a consequence of dis-persal by both males and females. However, if P. b. tem-minckii males are philopatric we would predict them to show higher genetic differentiation between social groups, higher probability of assignment to source population and higher levels of within group relatedness (Di Fiore, 2003; Hammond et al., 2006, Lawson Handley and Perrin, 2007).
MATERIAL AND METHODS Study site and sampling
determined for non-habituated groups and we did not directly observe animals defecating but collected only fresh fecal material. To minimize multiple sampling of individu-als, we only collected samples that were 2m or more apart. Samples were stored using the ‘two-step’ approach (Roeder et al., 2004). Samples from eight black-and-white colobus and six red colobus social groups were analyzed (Fig. 1).
DNA extraction and amplification
DNA from 380 fecal samples was extracted using the QIAampDNA Stool Kit (Qiagen, Valencia, CA) following the manufacturer’s instructions and stored at2208C. All samples were genotyped for 15 human-derived microsa-tellite loci (Table 1), first successfully used in Colobus guerezaby Harris et al. (2009), multiplexed in three pan-els of fiveloci. Molecular sex identification of each sam-ple was carried out following the protocol developed by Villesen and Fredsted (2006) and multiplexed together with the microsatellites. PCRs contained 7.5lL Multiplex PCR Master Mix (Qiagen), 0.1lM of each primer, 0.004mg/ lL of BSA (Bovine Serum Albumin, NEB) and 4.35lL of ultrapure water, and 1.5lL template DNA in a final volume of 15lL. Reactions, including negative con-trols, were performed in a VeritiTM 9902 Thermal Cycler (Applied Biosystems) as follows: 30 min at 958C; 40 cycles of 0.5 minutes at 948C, 1.5 minutes at 55-578C, 1.5 minutes at 728C followed by 30 minutes at 728C. PCR products were analyzed by Macrogen (Korea) Inc. An internal size standard (ROX labeled HD400) was added and alleles were scored using GeneMapper1 v3.2
(Applied Biosystems). To account for allelic dropout, we used the simulation software GEMINI v.1.4.1 (Valie`re
et al., 2002) that uses the allele frequencies, allelic drop-out and false allele rate observed for a subset of samples, and estimates the number of PCR repeats and number of times an allele would need to be scored in order to produce genotypes with 95% confidence. As a result, each sample was positively amplified for a minimum of four independent reactions. The locus D2s442 was excluded from the dataset as genotypes were missing for 25% of C. polykomos and 20% of P. b. temminckii samples respectively. D12s372 was monomorphic for P. b. temminckii and was also excluded for this species. PIsibvalues (the probability of identity (PI) that accounts for the presence of related individuals in the sample; Taberlet and Luikart, 1999; Waits et al., 2001) were cal-culated using GenAlEx 6.41 (Peakall and Smouse, 2006) yielding values of 1.9 x 10⁻³ for C. polykomos and 1.2 x 10⁻³ for P. b. temminckii. Low quality DNA samples, i.e. Quality Index (QI, Miquel et al., 2006) below 0.5 or more than three missingloci, and samples that could be repli-cates from the same individual were excluded. A total of 52 C. polykomos individuals from eight social groups were genotyped for 11-14 loci with 97.2% complete genotypes and a mean QI of 0.84. In addition, 72 P. b. temminckiiindividuals from six social groups were geno-typed for 10-13 lociwith 96.5% complete genotypes and a mean QI of 0.77. We used Micro-Checker (van Oosterh-out et al., 2004) to test for null alleles and FSTAT (Goudet, 2001) to conduct exact tests for Hardy-Wein-berg and linkage disequilibrium. Highly related individ-uals, resulting from sampling social groups, had a strong effect in inducing apparent population substructure (not shown) and were subsequently removed from the data-set. After this correction, none of the loci showed
evidence for null alleles, linkage disequilibrium or devi-ating from Hardy-Weinberg equilibrium.
We sequenced up to 478bp of the hypervariable domain (HVI) of the mitochondrial control region for 56 C. polykomos and 79 P. b. temminckii. Primers were designed using conserved regions of sequences available on GenBank for P. b. badius (DQ355301; Sterner et al., 2006) and C. guereza (AY863427; Raaum et al., 2005). Primers amplified for both species (L15449Clbs: 5’ CCRCCAATACCCAAAACTGG 3’, H15973Clb: 5’ AGGA-GAGTAGCACTCTTGTGC 3’). PCR conditions were the same as for the microsatellite except for primer concen-tration (2lM of each primer) and annealing temperature (638C). Each 13lL PCR product was purified using 4lL (1:2 ratio) of Exonuclease I (10 U/lL) (USB Corp.) and Shrimp Alkaline Phosphatase 1 U/lL (USB Corp.) by incubation at 378C for 30 min, followed by 15 min at 808C and finally for 5 min at 128C. Sequences were run by Macrogen Korea Inc. Forward and reverse sequences were manually checked using Sequencher v4.9 (Gene Codes Corporation) and aligned using CLUSTALW implemented in BIOEDIT 7 (Hall, 1999). Evidence that authentic mtDNA copies were sequenced instead of nu-clear insertions (Numts) included observations that: mul-tiple electrophoretic peaks were not present in the sequences; both tissue and fecal samples (in both taxa) produced the same sequences; for the black-and-white colobus, the same haplotypes were produced using two
different primer sets, and; cloning and sequencing of PCR products supported the evidence that none of the sequences used in the study were nuclear copies (see supplementary material). Haplotype sequences were de-posited in GenBank database (KC407944 – KC407955).
Genetic diversity and social group structure
Genetic diversity was analyzed across all social groups through the number of alleles (N), observed (Ho) and expected heterozygosity (He), and unbiased allelic rich-ness (AR), using FSTAT (Goudet, 2001). The inbreeding coefficient (Fis) was estimated using GenAlEx 6.41 (Pea-kall and Smouse, 2006). Analysis of molecular variance (AMOVA), using a codominant genotypic distance matrix to calculateFPT, was also implemented in GenAlEx 6.41 (Peakall and Smouse, 2006) to understand how diversity was partitioned within and among social groups. Signifi-cant tests were performed through 9999 permutations. This analysis was carried out for the social groups and for each sex separately.
Nucleotide (p) and haplotype diversity (Hd) were calcu-lated for the entire species sample and for each social group. Number of polymorphic sites and mean number of pairwise differences among sequences were also esti-mated. Diversity measures were computed in DnaSP version 5 (Rozas et al., 2010). AMOVA, using pairwise dif-ferences, was carried usingF-statistics as implemented in ARLEQUIN version 3.1 (Excoffier et al., 2005). For the C. polykomos, a two-level AMOVA (among and within social groups) was performed and for theP. b. temminckii we carried a three-level AMOVA out where sex was also considered. Additionally, we used BAPS (Bayesian Analy-sis of Population Structure) v5 (Corander and Tang, 2007; Corander et al., 2008) in order to corroborate the inference of social group structure. Here we did not incor-porate geographical information and used stochastic opti-mization allowing K to vary between one and the total number of social groups: each analysis was repeated 10 times. The evolutionary relationships between haplotypes for both species were determined using a median-joining haplotype network calculated with NETWORK 4.5 (Ban-delt et al., 1999) withe50 and all variable sites weighted equally. Frequencies and geographic distributions of dif-ferent haplotypes were used to depict geographical and potential ancestor-descendant relationships among haplo-type sequences.
Assignment tests
Mean corrected assignment indices (mAIc) were calcu-lated and compared between males and females using FSTAT (Goudet, 2001) and GenAlEx 6.41 (Peakall and Smouse, 2006). The assignment index is the probability that an individual’s multilocus genotype originated in the sampled population (Favre et al., 1997). Because mAIcis corrected to zero, genotypes less likely to belong to the population (e.g. immigrants) are expected to show negative mAIc whereas positive values are expected for natal individuals. The dispersing sex should also show higher values of variance of the corrected assignment index (vAIc) as a consequence of the presence of both immigrants and residents (Favre et al., 1997; Goudet et al., 2002). Because such analysis assumes that only post-dispersal individuals are present and in our case it was not possible to distinguish adults and juveniles, we used one habituated P. b. temminckii social group (Focal),
TABLE 1. Diversity indices for the microsatellite loci
Locus # Alleles
Allele size range
(bp) Hoa Heb Fisc
Allelic Rd
C. polykomos
D1s548 5 200–216 0.669 0.622 –0.197 2.495 D1s1665 4 164–176 0.589 0.537 –0.182 2.265 D4s2408 5 259–283 0.650 0.560 –0.261 2.103 D13s321 6 158–182 0.730 0.651 –0.224 2.586 D6s474 4 122–134 0.638 0.564– –0.212 2.465 D10s611 5 177–193 0.527 0.487 –0.176 2.213 D2s1326 5 215–239 0.580 0.590 –0.062 2.381 D11s2002 4 174–186 0.641 0.494 –0.381 2.215 D12s372 2 226–230 0.127 0.114 –0.209 1.185 D6s503 4 293–329 0.135 0.162 0.058 1.339 D6s1056 3 265–293 0.414 0.380 –0.180 1.984 D10s676 5 247–267 0.356 0.630 0.340 2.376 D10s1432 3 210–222 0.568 0.543 –0.145 2.103 Fesps 4 138–158 0.057 0.056 –0.098 1.122 Mean 4.2 – 0.475 0.415 –0.138 2.059
P. b. temminckii
D1s548 7 192–216 –0.927 0.783 –0.327 1.795 D1s1665 5 187–203 0.382 0.555 0.225 1.612 D4s2408 6 275–311 0.398 0.464 0.046 1.581 D13s321 2 165–169 0.289 0.321 0.008 1.307 D6s474 4 131–183 0.689 0.576 –0.281 1.571 D10s611 6 181–217 0.642 0.736 0.034 1.760 D2s1326 7 215–239 0.836 0.736 –0.247 1.750 D11s2002 4 158–182 0.544 0.503 –0.171 1.484 D6s503 7 294–338 0.586 0.777 0.107 1.748 D6s1056 3 269–277 0.327 0.453 0.138 1.476 D10s676 5 230–266 0.678 0.688 –0.130 1.745 D10s1432 7 211–247 0.671 0.837 0.055 1.803 Fesps 5 146–162 0.540 0.561 –0.056 1.613 Mean 5.2 – 0.538 0.508 –0.045 1.634
where samples were known to belong to adult and juvenile individuals, to serve as a control. Therefore, the same analysis was run with adults and juveniles as well as just adults, and results compared. GenAlEx 6.41 was used to perform assignment tests with the P. b. tem-minckiiFocal group dataset.
Relatedness
Mean pairwise relatedness was estimated using King-roup v2_101202 (Konovalov et al., 2004) and Coancestry v1.0 (Wang, 2011). The relatedness estimator of Queller and Goodnight (1989) was used for all possible dyads in the population and for the comparison between females and males from the same social group. Because similar results were obtained with the two programs, here we refer only to the results from Coancestry, where 1000 per-locus bootstraps were performed to achieve 95% con-fidence interval for each dyad. The module ‘‘Test Group Difference’’ was used to statistically compare mean pair-wise relatedness between males and females from the same social group. Statistical significance was achieved through 1000 bootstraps for a 95% confidence interval. The test for significance was only possible for groups that have three or more individuals of each sex. Because estimators of relatedness are likely to be biased by group size (the philopatric sex might only be detected to have higher within group pairwise relatedness if the group is small: Valsecchi et al., 2002; Lukas et al., 2005) and the presence of pre-dispersal individuals increases mean pairwise relatedness for both sexes, the number of highly related dyads for each of the sexes formed by individuals from the same or different social groups were also used as an additional indicator of sex-biased dispersal. We calculated the percentage of the same sex dyads that, based on their genotypes, were statistically more likely to be parent-offspring, full-sibling, or half-sibling pairs than to be unrelated, within and among social groups given background allele frequencies in the population. In order to estimate the number of such pairs of individuals, a likelihood ratio test was imple-mented in Kingroup v2_101202 (Konovalov et al., 2004), where the null hypothesis of ‘‘Unrelated’’ was tested against the primary hypotheses of ‘‘Parent-offspring’’, Full-siblings and ‘‘Half-siblings’’. One would expect that a higher percentage of such dyads would occur within social groups for the most philopatric sex and amongst social groups for the dispersing sex.
RESULTS
Genetic diversity and structure
Genotypes were derived from unidentified pre- and post-dispersal individuals and diversity indices are sum-marized in Table 1. P. b. temminckii showed a slightly higher mean number of alleles and higher HethanC.
pol-ykomos. However, AR was higher for C. polykomos whereasP. b. temminckiishowed morelociwith a positive Fis value. ForC. polykomos, significant structure among social groups was found (FPT 5 0.165, P \ 0.001),
although variance among individuals within the same social group explained most of the variation. This pattern was maintained when the AMOVA was conducted for females (FPT50.184,P\0.001) and males (FPT50.193,
P 5 0.001) separately. Red colobus social groups also showed significant genetic variance among groups, although less thanC. polykomos(FPT50.057,P\0.001).
While female P. b. temminckii exhibit similar levels of genetic structure (FPT50.053,P\0.001), there was some
evidence that P. b. temminckiimales are the more struc-tured sex (FPT50.199,P\0.005).
For all C. polykomos individuals, 478bp of the HVI domain of the control region were successfully amplified. Only three haplotypes were detected (BW1, BW2, BW3) with two segregating sites (transitions) and a mean number of nucleotide differences between two sequences of 0.17 mutational steps. Haplotype (Hd50.176 0.065)
and nucleotide diversity (p 5 0.00038 6 0.0001) were consequently remarkably low (Table 2). Haplotype BW2 was present in 51 individuals and in all but Deep Ami-dara social group. Haplotypes BW1 (one individual) and BW3 (four individuals) were found in one social group each (Cambeque and Deep Amidara, respectively). Four hundred and forty-eight bp of control region were successfully amplified from all 79 P. b. temminckii. In contrast to the C. polykomos, 9 haplotypes were identi-fied, with 45 polymorphisms (42 transitions and 3 trans-versions). The mean number of nucleotide differences between sequences was 16.5 mutational steps, exhibiting high haplotype (Hd 5 0.82 6 0.017) and nucleotide
di-versity (p 5 0.037 6 0.002; Table 2). The most common haplotypes (RC1 and RC4) were present in five and seven social groups, respectively. There were four haplo-types found in only one social group (RC6-RC9).
The C. polykomos AMOVA for mtDNA yielded high fixation indices between social groups (Fst 5 0.80, P\
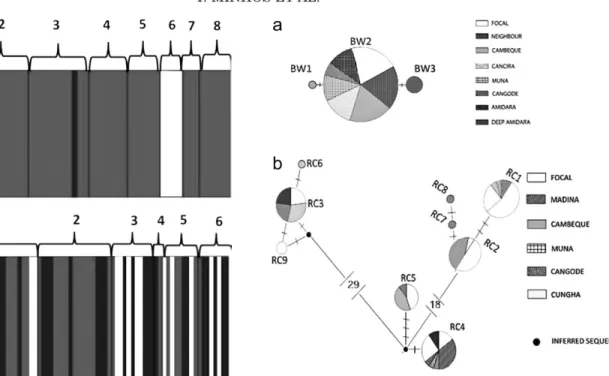
0.001), with 80% of the variation being partitioned between groups. As this population revealed low genetic diversity, this result is almost exclusively due to individ-uals from Amidara that exhibited an exclusive haplo-type. Structure was not detected when this social group was excluded from the analysis (data not shown). BAPS analysis supported the existence of three clusters match-ing the three haplotypes found (p 5 0.5, Fig. 2a). As depicted by the minimum-spanning network (Fig. 3a), BW2 was the most widespread haplotype in the popula-tion and the other two haplotypes were rare and likely to have recently originated from BW2. For P. b. tem-minckii there was weak genetic structure between social
TABLE 2. Summary of mitochondrial DNA diversity
Social group Na # Haplb hdc pd
C. polykomos 58 3 0.16 0.00036
Focal 9 1 0 0
Neighbor 10 1 0 0
Cambeque 11 2 0.18 0.0004
Cancira 7 1 0 0
Muna 6 1 0 0
Deep Amidara 4 1 0 0
Cangode 3 1 0 0
Amidara 6 1 0 0
Bushmeat 2 1 0 0
P. b. temminckii 86 11 0.83 0.038
Focal 29 5 0.77 0.03
Madina 19 3 0.70 0.02 Cambeque 11 5 0.78 0.04
Muna 2 2 1.00 0.05
Cangode 9 6 0.89 0.05
Cungha 9 3 0.64 0.04
Bushmeat 7 4 0.81 0.05
groups (AMOVA,Fst50.13,P\0.005), with 87% of the
total variation within social units. Only 16% of the vari-ation was found within social units and none explained among males and females from the same group. The BAPS results supported the weak genetic structure found by AMOVA since the three clusters identified (p5 0.699, Fig. 2b) had no correspondence with social groups. Furthermore, more than two haplotype clusters were found in all social groups. All were shared between two or more social units, reinforcing the lack of mitochon-drial DNA structure between P. b. temminckii social groups. The minimum-spanning network showing rela-tionships between the 9 haplotypes revealed three very divergent haplogroups with a high level of haplotype sharing between social groups (Fig. 3b) in agreement with AMOVA and BAPS results.
Assignment tests
When comparing mAIc values for C. polykomos social groups there was no strong evidence for sex-biased dis-persal (Table 3). ThemAIcwas positive for females (mean
5 0.019) and negative for males (mean 5 20.027). The vAIc was very similar and low for both sexes. ThemAIc and vAIc values were not significantly different between sexes. ForP. b. temminckii, when the three social groups with both sexes (Focal, Madina, Cangode) were analyzed, mAIc was positive for females (mean 5 0.229) and negative for males (mean 5 20.918), but the differences were not statistically significant (Table 3). However, vAIc was higher for females indicating that despite a
positive mAIc, there is greater variation in the assign-ment index for P. b. temminckiifemales. When the same analysis was performed for the best-studied social group (Focal), and included both adults and juveniles, a positive mAIc was obtained for the females (mean 50.016) and a negative value was obtained for the males (mean 5 20.050), mimicking the pattern found for the previous analysis using the three social groups. However, repeat-ing the analysis only with Focal adult individuals, mAIc values was negative for females (mean 5 20.496) and positive for males (mean 5 0.868), as is expected for a female-dispersal system.
Relatedness within and among social groups
C. polykomos did not show a clear pattern of sex-biased dispersal when differences in within group sex relatedness were considered (Table 4). Females showed higher, but not significant, levels of mean pairwise relat-edness than males for the social groups where among sex comparisons were possible (Focal: rfemales 5 0.23, rmales 5 0.07; Cambeque: rfemales 5 0.21, rmales 5 0.07; Amidara: rfemales50.40, rmales 50.17), displaying nega-tive values for the Neighbor (rfemales5 20.04) and Muna (rfemales 5 20.23) social groups. Additionally, a higher
Fig. 2. BAPS results showing the distribution of three mito-chondrial DNA haplotype clusters (indicated in the figure by white, dark gray, or black shading) across the eight social groups sampled (numbers) for black-and-white colobus (a): 1 Focal, 2 Neighbor, 3 Cambeque, 4 Cancira, 5 Muna, 6 Deep Amidara, 7 Cangode, 8 Amidara; and across six groups sampled for red colobus (b) (number of clusters in parenthesis): 1 Focal (3), 2 Madina (2), 3 Cambeque (2), 4 Muna (2), 5 Cangode (3), 6 Cungha (3).
Fig. 3. Haplotype network for black-and-white (a) and red colobus (b) based on mtDNA d-loop sequences. Circle diameter is proportional to the frequency of the haplotypes. Different color patterns represent different social groups. Lines between haplotypes represent the number of mutational steps.
TABLE 3. Tests of sex-biased dispersal carried in FSTAT
# Individuals mAIca P-value vAIcb P-value
C. polykomos
Females 30 0.01916 0.95 6.11120 0.82 Males 21 –0.02738 6.94474
P. b. temminckii
Females 44 0.22963 0.36 15.00585 0.52 Males 11 –0.91851 10.70524
aMean corrected assignment.
percentage of dyads that were more likely to be mother-daughter pairs (77.8%) or full sisters (52.4%) than to be unrelated comprised females from different social groups. Also 42% of pairs identified as more likely to be half-sisters than to be unrelated comprised females from different social groups. For males the patterns was simi-lar: a higher percentage of pairs more likely to be close relatives than to be unrelated consisted of individuals from different social groups (father-son: 55.6%; full-brothers: 66.7%; half-full-brothers: 66.7%; Table 5).
Because of the limited number of P. b. temminckii males in this study, comparison of the mean pairwise relatedness between males and females was only possi-ble for two social groups (Tapossi-ble 4). Females had higher levels of mean pairwise relatedness than males for both social groups (Focal: rfemales 5 0.07,rmales 5 0.05; Mad-ina: rfemales 5 0.02, rmales 520.14). Again, Focal group results when only adult individuals were analyzed (rfemales 5 20.08,rmales 5 0.05,) are more in agreement to what would be expected from a female dispersal sys-tem. Statistical tests were only possible for the Focal group and were not significant. Although 85.2% of dyads identified as likely mother–daughter pairs came from the same social group, this percentage dropped to 45.7% and 46.9% when likely full- and half-sisters were consid-ered, respectively (Table 5). Nonetheless for males, dyads that were more likely to be father-son pairs than unre-lated individuals were only found within groups, and only 28.6% of dyads identified as likely full-brothers and 16.7% of likely half-brothers comprised individuals that belonged to different social groups (Table 5).
DISCUSSION
Comparison of levels of genetic diversity and structure
The low mitochondrial diversity in the C. polykomos population and the high diversity found for P. b. tem-minckii are concordant with a male dispersal system in black-and-white colobus and female-mediated dispersal in red colobus. For C. polykomos, reduced mitochondrial gene flow as a result of female philopatry, together with the stochastic events of mutation, genetic drift and line-age sorting should result in restricted levels of genetic diversity within local populations of male dispersing spe-cies (Melnick and Hoelzer, 1992; Avise, 1995, 2000). AMOVA results show that mitochondrial haplotypes are unevenly distributed across social units resulting in 80% of the variation being explained among groups. Melnick and Hoelzer (1992) found that for the male dispersal sys-tem of Macaca mulatta (Rhesus monkey), mitochondrial sequence differences between populations (2.45%) were an order of magnitude larger than those within popula-tions (0.23%), where 91% of the diversity was explained between populations. The C. polykomos microsatellite data showed weaker structure among social groups with most of the variation found within social units. This pattern could be concordant with what is expected for species where dispersal is mainly male mediated: female philopatry does not allow the mitochondrial genes to be distributed throughout the population, but dispersal by males homogenizes the nuclear genome (Di Fiore, 2003). However, the fact that the strong mitochondrial struc-ture is solely due to one social group (Deep Amidara) and that the genetic diversity is extremely low makes it difficult to infer dispersal among social groups of the CantanhezC. polykomos from mtDNA alone. It could be argued that forest fragmentation and not male dispersal is responsible for the fact that one haplotype is exclusive to Deep Amidara, but microsatellite data indicate that, at least currently, females from Deep Amidara are inferred to have closely related individuals in other social groups (data not shown) so emigration from this social group remains possible. In contrast, the fact that P. b. temminckii showed high levels of mitochondrial di-versity and no genetic structure for either of the markers suggests that the females introduced novel genetic mitochondrial information in the population and were homogenizing both genomes through dispersal among social groups (Di Fiore, 2003; Lawson Handley and Perrin, 2007). In a study conducted on the closely related Asian colobine, the snub-nosed monkey ( Rhinopi-thecus roxellana), one of the populations also showed comparable levels of mtDNA diversity to the red colobus population, as expected for a population where females migrate (Hd 5 0.88 and p 5 0.04; Li et al., 2007). The
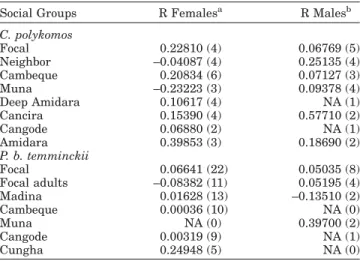
TABLE 4. Pairwise relatedness for males and females within each social group
Social Groups R Femalesa R Malesb
C. polykomos
Focal 0.22810 (4) 0.06769 (5) Neighbor –0.04087 (4) 0.25135 (4) Cambeque 0.20834 (6) 0.07127 (3) Muna –0.23223 (3) 0.09378 (4) Deep Amidara 0.10617 (4) NA (1) Cancira 0.15390 (4) 0.57710 (2) Cangode 0.06880 (2) NA (1) Amidara 0.39853 (3) 0.18690 (2)
P. b. temminckii
Focal 0.06641 (22) 0.05035 (8) Focal adults –0.08382 (11) 0.05195 (4) Madina 0.01628 (13) –0.13510 (2) Cambeque 0.00036 (10) NA (0) Muna NA (0) 0.39700 (2) Cangode 0.00319 (9) NA (1) Cungha 0.24948 (5) NA (0)
Note: Numbers in () correspond to the number of individuals used in each class.aFemale pairwise relatedness.
bMale pairwise relatedness.
TABLE 5. Percentage of dyads of individuals of the same sex that are more likely to be closely related
Parent-Offspring Full-siblings Half-siblings
Intra-group Inter-group Intra-group Inter-group Intra-group Inter-group
C. polykomos
Females 22.2 (4) 77.8 (14) 47.6 (10) 52.4 (11) 57.9 (11) 42.1 (8) Males 44.4 (4) 55.6 (5) 33.3 (2) 66.7 (4) 33.3 (2) 66.7 (4)
P. b. temminckii
Females 85.2 (46) 14.8 (8) 45.7 (48) 54.3 (57) 46.9 (46) 53.1 (52) Males 100 (3) 0 (0) 71.4 (5) 28.6 (2) 83.3 (5) 16.7 (1)
same trend has also been found in other female dispersal primates, as the Proboscis monkeys (Nasalis larvatus; see Munshi-South and Bernard, 2011), Hamadryas baboons (Papio hamadryas; see Hapke et al., 2001) and bonobos, where Eriksson et al. (2004) revealed high lev-els of haplotype (0.78–0.92) and nucleotide diversity (0.023–0.038) where 70% of the variation was found within sampled communities.
Sex-biased dispersal: population- and individual-based tests
Assignment tests were not able to identify any sex bias in dispersal for the C. polykomos population, for which system males are thought to be the main dispersers, but where episodes of female dispersal have also been reported (Dasilva, 1989; Korstjens et al., 2002). We found no significant difference between male and femalemAIc. In accordance, vAIcwas also very similar for males and females. Goudet et al. (2002) showed that tests based on mAIc and Fst are only able to detect the sex bias when this is strong. Therefore, if a sex bias in dispersal exists in this species, we can only conclude that is not strong enough to be detected by population-based methods. Fur-ther, we obtained the same indication of an absence of sex bias in the dispersal for the relatedness analysis. Females only showed higher levels of within group pairwise relat-edness than males in half of the groups and we found a similar percentage of highly related females in both within and among group dyads. These results are indica-tive that females might disperse to some extent. Ulti-mately, when inspecting the distribution of dyads that are more likely to be close relatives (‘‘parent-offspring’’, ‘‘full-siblings,’’ and half-siblings’’), a high percentage was found of individuals belonging to different social groups for both sexes, in agreement with themAIcandFstresults. These results are in line with Harris et al.’s (2009) findings for a black-and-white colobus population (C. guereza, Uganda) where the genetic signature of the dispersal system has been studied. Their results based on pairwise relatedness within and among social groups also revealed the
pres-ence of some highly related female dyads in different social groups. However, C. guereza related female dyads were more likely to be found within groups and males were on average less related within groups than females. Harris et al. (2009) explained the dispersal system as being complex, where males might disperse longer distan-ces and the less extensive female dispersal being more re-stricted to neighboring groups. They also explained the existence of highly related female dyads in different groups as a possible consequence of group dilution. Even if this event could explain some of the relatedness pat-terns found for theC. polykomosfemales in the Cantan-hez population, this phenomenon alone cannot explain the extensive among group relatedness found for these females, unless it is extremely common. Moreover, female dyads more likely to be closely related were found between more pairs of groups (N pairs 5 16) than male dyads (N pairs 5 12) (data not shown), adding evidence for dispersal by both sexes in this population.
For the P. b. temminckii population, both population-and individual-based analysis indicate that females should be the main sex promoting dispersal. Although with the mean corrected assignment tests, no significant differences were found between males and females, females exhibited negative values of mAIc for the Focal group when only adult individuals were considered. When this group contained both adult and juveniles, we obtained a similar pattern to the total database where themAIcwas positive for the females but where thevAIc was also higher for this sex. For P. b. temminckii, conclusions should be taken with caution as the limited number of males in the sample, can obscure the disper-sal pattern (Goudet et al., 2002). Moreover, the low number of P. b. temminckii males did not allow an extensive comparison of within group female and male pairwise relatedness and may be responsible for an underestimation of among group ‘‘male dispersal’’. None-theless, results obtained for the well-sampled Focal group when only adult individuals are considered, sug-gest that females are less related than males, thus being the candidate sex to conduct dispersal, at least in this
TABLE 6. Summary of main results explaining the patterns of dispersal found for the two colobus populations from Cantanhez
C. polykomos P. b. temminckii
Saptio-temporal range Dispersal sex Genetic pattern Dispersal sex Genetic pattern
Historical/long-range dispersal (mtDNA)
Male Extremely low genetic diversity within the population
Female High genetic diversity within the population with three divergent haplogroups Within population
dispersal (mtDNA)
Not conclusive (very low diversity)
Low genetic diversity within groups
Female High genetic diversity within groups Social groups
highly structured
Lack of structure between social groups Current within
population dispersal (microsatelliteloci)
Both sexes No sex diferences in genetic structure among social groups No sex differences in within
group relatedness No sex differences in mAIc
Female but with some evidance of less extensive male dispersal
Females less strctured among social groups than males Negative mAIc for adult
females (Focal group1)
Negative intra-group adult female relatedness (Focal group1) High percentage of same
sex close relatives are of individuals
from different social groups for both males and females
Most dyads of highly related females were of individuals from different social groups but most highly related males were found within groups
aOne social group of
social group. The intra-specific variation of the pattern of dispersal has already been reported in primates. For example, in a well-studied group of spider monkeys (Ateles belzebuth; see Di Fiore et al., 2009), males were found to be more related within groups, with assignment tests also suggesting female-dispersal. This pattern was not found for a second well-studied group from a differ-ent population subject to strong anthropogenic pressure where hunting was suggested as the most likely expla-nation for the disruption in the groups’ male relatedness pattern. If in CNP, the P. b. temminckiisocial groups of different forest fragments are under different hunting pressures, as it seems to be the case (TM, personal obs.), we cannot discard the possibility that differences in dis-persal patterns among social groups exist. Nonetheless, adding to the evidence that dispersal might be mainly mediated by females in the Cantanhez P. b. temminckii population, is the fact that we identified no among group male-male dyads that were more likely to be related at parent-offspring level than to be unrelated, and only a few cases where males from different social groups were likely to be related at the full- or half-sib level. Clearly, more males from different social groups are needed to fully understand this dispersal system. However, our data indicate that males might not be completely phil-opatric as is thought for red colobus. Nevertheless, we were able to show that in P. b. temminckii, females should be the main sex promoting dispersal, as demon-strated by the AMOVA, assignment tests and pairwise relatedness. Adding to the evidence from the nuclear markers, the lack of mitochondrial structure among social groups and high genetic diversity for this molecu-lar marker also supports the extensive female dispersal for red colobus.
Current and historical or long-range dispersal
If the analysis of the mitochondrial DNA indicates his-torical or long range dispersal by males inC. polykomos and by females in P. b. temminckii, this signal becomes more complex when analyzing current within population dispersal. The combination of both low mitochondrial haplotype and nucleotide diversity inC. polykomos popu-lation suggests a scenario where the colonization of the peninsula was accomplished by one or a few mitochon-drial lineages (Grant and Bowen, 1998). We suggest that the fact that the males were the primary sex to immi-grate into the population may not have allowed for new mitochondrial haplotypes to be established in the popula-tion. As a consequence, historical and/or long-range dispersal mainly mediated by C. polykomos males is reflected not only in the present pattern of low mitochon-drial diversity of the population but has also left its signature in the colonization history of the Cantanhez Peninsula. Moreover, levels of haplotype and nucleotide diversity exhibited by P. b. temminckii population sug-gest the existence of, either a large stable population with deep evolutionary history, or secondary contact between divergent lineages (Grant and Bowen, 1998). The shape of the network supports the latter since three very divergent lineages were found within the popula-tion. The coexistence of large mitochondrial differences in the same geographical area can be explained by the secondary admixture between differentiated lineages (Avise, 1987). Their immigration into Cantanhez Penin-sula may reflect the species dispersal pattern during or after the colonization process.
Evidence from microsatellite data, which can be used to measure sex-biased dispersal in one genera-tion (Lawson Handley and Perrin, 2007), shows that within the C. polykomospopulation, dispersal is medi-ated by both sexes, whereas for P. b. temminckii, females seem to be the main dispersing sex, although we have evidence of some male dispersal. The forest in Cantanhez National Park is highly fragmented and episodes of colobus being hunted for bushmeat con-sumption have been recorded (Minho´s et al., unpub-lished data; Hockings and Sousa, 2011). Both species occupy patches of forest where anthropogenic pressure is high and the two main threats to their survival (habitat loss/fragmentation and poaching) co-exist. Consequently, the possibility that the colobus are changing their dispersal patterns in response to recent changes in their habitat cannot be excluded (Goossens et al., 2006). In addition, stochastic demo-graphic events (e.g. high mortality due to hunting) might have altered within- and among-group related-ness (Di Fiore et al., 2009). This might be the case for the colobus monkeys in Cantanhez as mitochondrial DNA data indicates historical and/or long-range dis-persal by one sex but nuclear data suggests that cur-rently both sexes may disperse within the population. It is recognized that the bias in dispersal might vary with geographical scale (Lawson Handley and Perry, 2007) with males being able to disperse larger distan-ces than females (Waser, 1985), and this black-and-white colobus might also illustrate this situation (long-range dispersal by males but within population dispersal by both sexes). The fact that most behav-ioral studies on black-and-white colobus species report only very few episodes of females dispersing, suggests that in those populations females disperse in a lesser extent than the males, and consequently, the female dispersal evidenced by the nuclear markers in Can-tanhez may correspond to local behavioral adaptation in response to changes in the environment. Proximate causes could include inbreeding avoidance and/or kin competition for resources, as dispersing over short distances is sufficient to avoid both problems (reviewed in Lawson Handley and Perrin, 2007; Korstjens and Schippers, 2003). Ultimately, genetic data integrated in the study of dispersal patterns can provide great insights not only on the socio-genetic dynamics of a species but also on the effect that anthropogenic disturbance might have on its endan-gered populations.
ACKNOWLEDGMENTS
LITERATURE CITED
Altmann J, Alberts SC, Haines SA, Bubach J, Muruthi P, Coote T, Geffen E, Cheesman DJ, Mututa RS, Saiyalel SN, Wayne RK, Lacy RC, Bruford MW. 1996. Behavior predicts genetic structure in a wild primate group. Proc Natl Acad Sci USA 93:5797–5801.
Avise JC, Arnold J, Ball RM, Bermingham E, Lamb T, Neigel JE, Reeb CA, Saunders NC. 1987. Intraspecific phylogeogra-phy: the mitochondrial bridge between population genetics and systematics. Annu Rev Ecol Syst 18:489–522.
Avise JC. 1994. Molecular markers, natural history and evolu-tion. New York: Chapman and Hall.
Avise JC. 1995. Mitochondrial DNA polymorphism and a connection between genetics and demography of relevance to conservation. Conserv Biol 9:686–690.
Avise JC. 2000. Phylogeography: the history and formation of species. Cambridge, MA: Harvard University Press.
Bandelt H-J, Forster P, Rohl A. 1999. Median-joining networks for inferring intraspecific phylogenies. Mol Biol Evol 16:37– 48.
Blair ME and Melnick DJ. 2012. Genetic evidence for dispersal by both sexes in the Central American squirrel monkey,
Saimiri oerstedii citrinellus. Am J Primatol 74:37–47. Boinski S, Ehmke E, Kauffman L, Schet S, Vreedzaam A. 2005.
Dispersal patterns among three species of squirrel monkeys (Saimiri oerstedii, S. boliviensis andS. sciureus). II. Within-species and local variation. Behaviour 142:633–677.
Clutton-Brock TH. 1989. Female transfer and inbreeding depression in mammals. Nature 337:70–71.
Corander J, Tang J. 2007. Bayesian analysis of population structure based on linked molecular information. Math Biosci 205:19–31.
Corander J, Siren J, Arjas E. 2008. Bayesian spatial modeling of genetic population structure. Comput Stat 23:111–129. Dasilva GL. 1989. The ecology of the western black-and-white
colobus (Colobus polykomos polykomos Zimmerman 1780) on a riverine island in southeastern Sierra Leone. PhD Thesis, University of Oxford, Oxford, England.
Di Fiore A. 2003. Molecular genetic approaches to the study of primate behavior, social organization, and reproduction. Yearb Phys Anthropol 46:62–99.
Di Fiore A, Link AL, Schmitt CA, Spehar SN. 2009. Dispersal patterns in sympatric woolly and spider monkeys: integrat-ing molecular and observational data. Behaviour 146:437– 470.
Dobson FS. 1982. Competition for mates and predominant juve-nile male dispersal in mammals. Anim Behav 30:1183–1192. Dobson SF, Chesser RK, Hoogland JL, Sugg DW, Foltz DW.
1998. Breeding groups and gene dynamics in a socially struc-tured population of prairie dogs. J Mammal 79:671–680. Eriksson J, Hohmann G, Boesch C, Vigilant L. 2004. Rivers
influence the population genetic structure of bonobos (Pan paniscus). Mol Ecol 13:3425–3435.
Excoffier LG, Laval, Schneider S. 2005. Arlequin v.3.0: An inte-grated software package for population genetics data analysis. Evol Bioinform Online 1:47–50.
Faulkes CG, Bennett NC, Bruford MW, O’Brien HP, Aguilar GH, Jarvis JUM. 1997. Ecological constraints drive social evolution in the African mole-rats. Proc R Soc B 264:1619– 1627.
Favre L, Balloux F, Goudet J, Perrin N. 1997. Female-biased dispersal in the monogamous mammalCrocidura russula: evi-dence from field data and microsatellite patterns. Proc R Soc Lond B Biol 264:127–132.
Fleury MC, Gautier-Hion A. 1999. Semi-nomadic ranging behavior in a population of black colobus (Colobus satanas) in Gabon and its ecological correlates. Int J Primatol 20:491– 509.
Galat G, Galat-Luong A. 1985. La communaute´ de primates diurnes de la foreˆt de Tai, Coˆte d’Ivoire. Rev Ecol (Terre Vie) 40:3–32.
Gippoliti S, Dell’Omo G. 1996. Primates of the Cantanhez Forest and the Cacine Basin, Guinea-Bissau. Oryx 30:74–80.
Gippoliti S, Dell’Omo G. 2003. Primates of Guinea-Bissau, West Africa: distribution and conservation status. Primate Conserv 19:73–77.
Gompper ME, Gittleman JL, Wayne RK. 1998. Dispersal, philo-patry, and genetic relatedness in a social carnivore: comparing males and females. Mol Ecol 7:157–163.
Goossens B, Setchell JM, James SS, Funk SM, Chikhi L, Abu-lani A, Ancrenaz M, Lackman-Ancrenaz I, Bruford MW. 2006. Philopatry and reproductive success in Bornean orang-utans (Pongo pygmaeus). Mol Ecol 15:2577–2588.
Goudet J. 2001. FSTAT, a program to estimate gene diversity and fixation indices. Institute for Ecology, Laboratory for Zool-ogy, University of Lausanne.
Goudet J, Perrin N, Waser P. 2002. Tests for sex-biased disper-sal using bi-parentally inherited genetic markers. Mol Ecol 11:1103–1114.
Grant WS, Bowen C. POLYKOMOS. 1998. Shallow population histories in deep evolutionary lineages of marine fishes: insights from sardines and anchovies and lessons for conser-vation. J Hered 89:415–427.
Hall TA. 1999. BioEdit: a user-friendly biological sequence alignment editor and analysis program for Windows 95/98/NT. Nucleic Acids Symp Ser (Oxf) 41:95–98.
Hamilton WD. 1967. Extraordinary sex ratios. Science 156:477– 488.
Hammond RL, Handley LJL, Winney BJ, Bruford MW, Perrin N. 2006. Genetic evidence for female-biased dispersal and gene flow in a polygynous primate. Proc R Soc B Biol Sci 273:479–484.
Hapke A, Zinner D, Zischler H. 2001. Mitochondrial DNA varia-tion in Eritrean hamadryas baboons (Papio hamadryas hama-dryas): life history influences population genetic structure. Behav Ecol Sociobiol 50:483–492.
Harris TR. 2005. Roaring, intergroup aggression, and feeding competition in black-and- white colobus monkeys (Colobus guereza) at Kanyawara, Kibale National Park, Uganda. PhD Thesis, Yale University.
Harris TR, Caillaud D, Chapman CA, Vigilant L. 2009. Neither genetic nor observational data alone are sufficient for under-standing sex-biased dispersal in a social-group-living species. Mol Ecol 18:1777–1790.
Hockings KJ, Sousa C. 2011. Human-chimpanzee sympatry and interactions in Cantanhez National Park, Guinea-Bissau: cur-rent research and future directions. Primate Conserv 26:1–9. Jack KM, Isbell LA. 2009. Dispersal in primates: advancing an
individualized approach. Behaviour 246:429–436.
Jones CB. 2003. The proximate and ultimate costs and benefits of dispersal in primates. Primate Rep 67:3–6.
Konovalov DA, Manning C, Henshaw MT. 2004. KINGROUP: a program for pedigree relationship reconstruction and kin group assignments using genetic markers. Mol Ecol Notes 4:779–782.
Korstjens AH. 2001. The mob, the secret sorority, and the phantoms. An analysis of the socio-ecological strategies of the three colobines of Tai. PhD Thesis, Utrecht University, Utrecht.
Korstjens AH, Sterck EHM, Noe¨ R. 2002. How adaptive or phy-logenetically inert is primate social behaviour? A test with two sympatric colobines. Behaviour 139:203–225.
Korstjens AH, Schippers EP. 2003. Dispersal patterns among olive colobus in Tai National Park. Int J Primatol 24:515–539. Korstjens AH, Nijssen EC, Noe¨ R. 2005. Intergroup relation-ships in western black-and-white colobus, Colobus polykomos polykomos. Int J Primatol 26:1267–1289.
Lawson Handley LJ, Perrin N. 2007. Advances in our under-standing of mammalian sex-biased dispersal. Mol Ecol 16: 1559–1578.
Li M, Liu Z, Gou J, Ren B, Pan R, Su Y, Funk SM, Wei F. 2007. Phylogeography and population structure of the golden monkeys (Rhinopithecus roxellana): inferred from mitochon-drial DNA sequences. Am J Primatol 69:1195–1209.
Marler P. 1970. Vocalizations of East African monkeys. I. Red colobus. Folia Primatol 13:81–91.
Marsh CW. 1979. Female transference and mate choice among Tana River red colobus. Nature 281:568–569.
Mbora DNM, McPeek MA. 2010. Endangered species in small habitat patches can possess high genetic diversity: the case of the Tana River red colobus and mangabey. Conserv Genet 11:1725–1735.
McDonald MM, Hamilton H. 2010. Phylogeography of the Ango-lan black-and-white colobus monkey, Colobus angolesnis palliatus, in Kenya and Tanzania. Am J Primatol 72:715–724. Melnick DJ, Hoelzer GA. 1992. Differences in male and female macaque dispersal lead to contrasting distributions of nuclear and mitochondrial DNA variation. Int J Primatol 13:379–393. Miquel C, Bellemain E, Poillot C, Taberlet P. 2006. Quality
indexes to assess the reliability of genotypes in studies using noninvasive sampling and multiple-tube approach. Mol Ecol Notes 6:985–988.
Morin PA, Moore J, Chakraborty R, Jin L, Goodall J, Woodruff DS. 1994. Kin selection, social structure, gene flow, and the evolution of chimpanzees. Science 265:1193–1201.
Munshi-South J, Bernard H. 2011. Genetic diversity and dis-tinctiveness of the proboscis monkeys (Nasalis larvatus) of the Klias Peninsula, Sabah, Malaysia. J Hered 102:342–346. Oates J. 1994. Natural history of African colobines. In: Davies
G, Oates J, editors. Colobine monkeys. Cambridge: Cambridge University Press. p75–128.
Oates J, Davies G, Delson E. 1994. Diversity of living Colobines. In: Davies G, Oates J, editors. Colobine monkeys. Cambridge: Cambridge University Press. p.45–73.
Peakall R, Smouse PE. 2006. GENALEX 6: Genetic analysis in Excel. Population genetic software for teaching and research. Mol Ecol Notes 6:288–295.
Pusey AE, Packer C. 1987. Dispersal and philopatry. In: Smuts BB, Cheney DL, Seyfarth RM, Wrangham RW, Struhsaker TT, editors. Primate societies. Chicago: University of Chicago Press. p250–266.
Queller DC, Goodnight KF. 1989. Estimating relatedness using molecular markers. Evolution (NY) 43:258–275.
Raaum R, Sterner KN, Noviello CM, Stewart CB, Disotell TR. 2005. Catarrhine primate divergence dates estimated from complete mitochondrial genomes: concordance with fossil and nuclear DNA evidence. J Hum Evol 48:237–257.
Roeder AD, Archer FI, Poinar HN, Morin PA. 2004. A novel method for collection and preservation of faeces for genetic studies. Mol Ecol Notes 4:761–764.
Rozas J, Librado P, Sanchez-DelBarrio JC. 2010. DNA Sequence Polymorphism. Version 5.10.01. Universitat de Barcelona. Sima˜o A. 1997. Identificac¸a˜o e delimitac¸a˜o cartogra´fica dos
grandes macic¸os florestais de Cantanhez. Relato´rio de Missa˜o. Acc¸a˜o para o Desenvolvimento: Bissau, Republica da Guine´-Bissau.
Sunnucks P. 2000. Efficient genetic markers for population biology. Trends Ecol Evol 15:199–203.
Starin ED. 1991. Socioecology of the red colobus in the Gambia with particular reference to female-male differences and transfer patterns. PhD Thesis. City University of New York, NY.
Starin ED. 1994. Philopatry and affiliation among red colobus. Behaviour 130:253–270.
Sterner KN, Raaum RL, Zhang YP, Stewart CB, Disotell TR. 2006. Mitochondrial data support an odd-nosed colobine clade. Mol Phylogenet Evol 40:1–7.
Struhsaker TT. 1975. The red colobus monkey. Chicago: Univer-sity of Chicago Press.
Struhsaker TT, Leland L. 1979. Socioecology of two sympatric monkey species in the Kibale Forest, Uganda. In: Rosenblatt J, Hinde RA, Beer C, Busnel MC, editors. Advances in the study of behavior , Vol.9. New York: Academic Press. p158– 228.
Struhsaker TT. 2010. The red colobus monkeys: variation in demography, behavior and ecology of endangered species. Oxford: Oxford University Press.
Taberlet P, Luikart G. 1999. Non-invasive genetic sampling and individual identification. Biol J Linn Soc 68:41–55.
Teichroeb JA, Wikberg EC, Sicotte P. 2009. Female dispersal patterns in six groups of ursine colobus (Colobus vellerosus): infanticide avoidance is important. Behaviour 146:551–582. Ting N. 2008. Mitochondrial relationships and divergence dates
of the African colobines: evidence of Miocene origins for the living colobus monkeys. J Hum Evol 55:312–325.
Waits LP, Luikart G, Taberlet P. 2001. Estimating the probabil-ity of identprobabil-ity among genotypes in natural populations: cau-tions and guidelines. Mol Ecol 10:249–256.
Wang J. 2011. COANCESTRY: a program for simulating, esti-mating and analyzing relatedness and inbreeding coefficients. Mol Ecol Resour 11:141–145.
Waser PM. 1985. Does competition drive dispersal? Ecology 66:1170–1175.
van Oosterhout C, Hutchinson WF, Wills DP, Shipley P. 2004. Micro-checker: software for identifying and correcting geno-typing errors in microsatellite data. Mol Ecol Notes 4:535– 538.
Valie`re N, Berthier P, Mouchiroud D, Pontier D. 2002. Gemini: software for testing the effects of genotyping errors and multitubes approach for individual identification. Mol Ecol Notes 2:83–86.
Valsecchi E, Hale P, Corkeron P, Amos W. 2002. Social structure in migrating humpback whales (Megaptera novaeangliae). Mol Ecol 11:507–518.