Time-to-treatment of diffuse large B-cell lymphoma
in Sa˜o Paulo
Fla´via Dias Xavier,IDebora Levy,II Juliana PereiraI
IHospital das Clı´nicas da Faculdade de Medicina da Universidade de Sa˜o Paulo (HC-FMUSP) and Instituto do Caˆncer do Estado de Sa˜o Paulo (ICESP),
Hematology Department, Sa˜o Paulo/SP, Brazil.IIHospital das Clı´nicas da Faculdade de Medicina da Universidade de Sa˜o Paulo (HC-FMUSP), Laboratory of Genetics and Molecular Hematology (LIM31), Sa˜o Paulo/SP, Brazil.
OBJECTIVE:Diffuse large B-cell lymphoma is the most common type of non-Hodgkin lymphoma, accounting for nearly 50% of the cases in the Hematology Department of the Hospital das Clı´nicas da Faculdade de Medicina da Universidade de Sa˜o Paulo and Instituto do Caˆncer do Estado de Sa˜o Paulo. The treatment outcome is influenced by age, abnormal lactate dehydrogenase levels, extranodal infiltration, the disease stage and the patient’s performance status. In this study, we sought to report the time-to-treatment of diffuse large B-cell lymphoma in Sa˜o Paulo’s public health system network and its impact on patient outcomes.
METHODS:We prospectively followed a cohort of 42 consecutive patients with de novodiffuse large B-cell lymphoma between 2008 and 2012.
RESULTS:Our patients had more advanced disease than that reported in the literature (61.9%vs.46%). In Sa˜o Paulo’s public health system network, it took an average of 7.4 months for a diagnosis to be made and an additional 1.4 months to obtain an appointment with a specialist. Once at our Hematology Department, it took less than 20 days for staging, confirmation of the diagnosis and treatment initiation. An interval from signs or symptoms to treatment of more than 6 months was associated with inferior progression-free survival in 3 years (p= 0.049).
CONCLUSION:A delay in the diagnosis of diffuse large B-cell lymphoma is a public health problem and may be associated with worse progression-free survival.
KEYWORDS: Lymphoma; Large B-Cell; Diffuse; Time-to-Treatment; Public Health; Diagnosis; Prognosis.
Xavier FD, Levy D, Pereira J. Time-to-treatment of diffuse large B-cell lymphoma in Sa˜o Paulo. Clinics. 2014;69(5):367-371.
Received for publication onSeptember 27, 2013;First review completed onOctober 10, 2013;Accepted for publication onOctober 15, 2013
E-mail: [email protected]
Tel.: 055 11 3061-5612
& INTRODUCTION
Non-Hodgkin lymphoma (NHL) is the ninth most common cancer type in Brazil and the thirteenth leading cause of cancer deaths (1). Diffuse large B-cell lymphoma (DLBCL) is the most prevalent NHL subtype. This subtype comprises approximately 35% of all cases in the Western world (2,3) and accounts for nearly 50% of the cases in the Hematology Department of the Hospital das Clı´nicas da Faculdade de Medicina da Universidade de Sa˜o Paulo (Clinics Hospital of the Medical School of the University of Sa˜o Paulo, hereafter referred to as ‘‘HC-FMUSP’’) and Instituto do Caˆncer do Estado de Sa˜o Paulo (Cancer Institute of the State of Sa˜o Paulo, hereafter referred to as ‘‘ICESP’’) (4).
According to the World Health Organization’s classifica-tion (5), the clinical and biological heterogeneity of DLBCL results in more than 20 subtypes. The condition is characterized by rapidly enlarging tumor masses, and 46% of patients present at advanced stages (6). We have recently demonstrated that this percentage can be as high as 61.9% in our department (7), possibly due to the difficulty in gaining access to a specialist in Brazil’s health system network (SUS).
In this study, we report the time-to-treatment of DLBCL in Sa˜o Paulo’s public health system network and its impact on patient outcomes.
& MATERIALS AND METHODS
Patients from HC-FMUSP and ICESP withde novo CD20-positive DLBCL were consecutively enrolled from September 2008 to March 2010. Patients with immunosuppression-related lymphomas were not included. The participants were treated with R-CHOP-21 (rituximab 375 mg/m2,
cyclopho-sphamide 750 mg/m2, doxorubicin 50 mg/m2and vincris-tine 1.4 mg/m2(maximum 2 mg) on day 1 and prednisone 100 mg/d for five days) (8,9). A prospective follow-up of the cohort was performed until July 2012.
Copyrightß2014CLINICS– This is an Open Access article distributed under the terms of the Creative Commons Attribution Non-Commercial License (http:// creativecommons.org/licenses/by-nc/3.0/) which permits unrestricted non-commercial use, distribution, and reproduction in any medium, provided the original work is properly cited.
No potential conflict of interest was reported.
The onset of lymphoma-related symptoms or signs was defined as the first disease manifestation recognized by the patients. These manifestations were B symptoms (night sweats, unexplained fever above 38
˚
C and/or unexplained weight loss above 10% of the total body weight over a period of 6 months), lymph node enlargement or a mass (palpable or discovered by imaging exams). These data were recorded during the first appointment of each patient by a hematologist. Time-to-treatment was defined as the interval between the first signs or symptoms and the beginning of treatment. This interval was divided into three steps: the time from first symptoms or signs until diagnosis by biopsy, the time from biopsy diagnosis until the first appointment with a hematologist and the time from the first appointment with a hematologist until the beginning of treatment. The staging and the response assessment were based on Cheson’s revised response criteria for malignant lymphoma (10). Overall survival was calculated as the time from diagnosis to the date of death or last follow-up, and the event was death. Progression-free survival was calcu-lated as the time from diagnosis to the date of progression, relapse, last follow-up or death, and the events were progression and relapse. A univariate analysis of categorical variables was performed using the Mantel-Haenszel test. The Kaplan-Meier method was used to estimate overall survival and progression-free survival, and the log-rank test was used to compare survival curves. STATA 9.1 software was used for the data analysis. Ap-value less than 0.05 was considered significant.Ethics
The study was approved by the Ethics Committees of HC-FMUSP and ICESP. The clinical investigations were con-ducted according to the principles contained in the Declaration of Helsinki.
& RESULTS
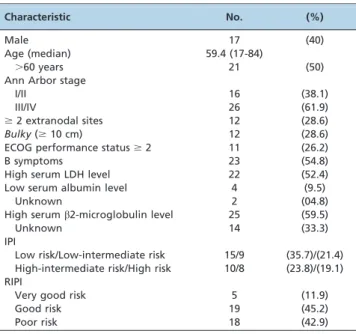
A total of 42 patients were enrolled in the study, with a female predominance (60% vs. 40%) and a median age of 59.4 years (17-84 years). Most patients presented with advanced disease (61.9%). Less than one third of the patients showed the involvement of at least two extranodal sites, bulky disease and a performance status of two or higher based on Eastern Cooperative Oncology Group (ECOG) analysis. More than one half of the patients presented B symptoms or elevated serum lactate dehydro-genase (LDH) levels. Patients with a high-intermediate risk/ high-risk International Prognostic Index (IPI) belonged to a poor Revised International Prognostic Index (RIPI) sub-group, representing 42.9% of the cases. The patients’ characteristics are described in Table 1.
The mean and median times from the first lymphoma sign or symptom to the final diagnosis by biopsy were 7.42 months and 5.25 months, respectively (range: 0.57 to 28 months). The interval from pathological diagnosis to the first appointment with a hematologist in our department ranged from 0.5 to 5.7 months, and the mean and median times were 1.43 and 1.2 months, respectively.
In the Hematology Department of HC-FMUSP/ICESP, the average time interval between the first appointment and the start of treatment, encompassing diagnostic biopsy review; staging by physical examination; computed tomo-graphy of the neck, thorax, abdomen and pelvis; and
positron emission tomography with fluorodeoxyglucose and bone marrow biopsy, was 20 days.
The time from the first sign or symptom to the start of treatment (TST) ranged from 2.17 to 29.4 months, with a mean of 9.3 months and a median of 6.4 months (Figure 1) (7).
The complete response rate was 82.5%, and the 3-year overall survival and progression-free survival were 82.8% (Figure 2) and 87.5%, respectively (7). In the univariate analysis, an interval from signs or symptoms to the beginning of treatment that exceeded 6 months was associated with inferior progression-free survival in 3 years (76.2% vs. 100%, p= 0.049) but not with inferior overall survival (72.1%vs. 93.3%,p= 0.13) (7) (Table 2).
Multivariate analysis by Cox logistic regression using the variables TST (#6 or.6 months), performance status (,2 vs.$ 2), age (#60 vs. .60 years), LDH levels (normalvs. elevated), extranodal sites (,2 vs. $2) and Ann Arbor clinical stage (I/IIvs.III/IV) did not yield any independent variable for progression-free survival or overall survival in the entire group (Table 3). Multivariate analysis of TST (#6 or.6 months) and IPI (low-risk plus low-intermediate-risk vs.high-intermediate-risk plus high-risk) and of TST (#6 or
.6 months) and RIPI (very good, good and poor) (Table 3) also did not reveal a correlation with prognosis. Because of the absence of a sufficient number of events in the good-risk group, we performed a survival analysis only in the poor-risk groups. Therefore, using only an IPI of intermediate-high/high-risk and a poor RIPI (all patients who had an intermediate-high/high risk IPI also had a poor RIPI), the survival curve obtained by log-rank analysis showed that a TST.6 months was an independent variable for progres-sion-free survival (44.43% vs. 100%, p= 0.0184), with a tendency toward a lower overall survival rate (37.53%vs. 87.5%,p= 0.0617) (Table 2 and Figure 3).
Table 1 -Characteristics of the cohort at diagnosis.
Characteristic No. (%)
Male 17 (40)
Age (median) 59.4 (17-84)
.60 years 21 (50)
Ann Arbor stage
I/II 16 (38.1)
III/IV 26 (61.9)
$2 extranodal sites 12 (28.6)
Bulky($10 cm) 12 (28.6) ECOG performance status$2 11 (26.2)
B symptoms 23 (54.8)
High serum LDH level 22 (52.4)
Low serum albumin level 4 (9.5)
Unknown 2 (04.8)
High serumb2-microglobulin level 25 (59.5)
Unknown 14 (33.3)
IPI
Low risk/Low-intermediate risk 15/9 (35.7)/(21.4) High-intermediate risk/High risk 10/8 (23.8)/(19.1) RIPI
Very good risk 5 (11.9)
Good risk 19 (45.2)
Poor risk 18 (42.9)
& DISCUSSION
In Brazil, there have been no studies on NHL that have assessed the impact of delayed diagnosis and treatment on patients’ survival. In our study, all DLBCL patients who did not respond to R-CHOP had waited more than 6 months from signs or symptoms to treatment, while just 54.55% of patients who exhibited a complete response were subjected to the same waiting period. An interval between signs or symptoms and treatment exceeding 6 months was statisti-cally significantly associated with inferior progression-free survival in three years (100% vs. 76.2%, p= 0.049) (7). Although there was no significant difference in general overall survival, in the group with a high clinical risk (an intermediate-high/high IPI or a poor RIPI), there was a
tendency toward a lower survival rate when the time-to-treatment was greater than 6 months (40% vs. 87.5%, p= 0.0617).
In the United Kingdom, the Review of Cancer Waiting Times Standards determined that (i) a patient with suspected cancer should be referred to a specialist for urgent evaluation within two weeks, (ii) the diagnosis should be made within one month and (iii) the total time-to-treatment should not be more than two months (11).
On November 22, 2012, the Brazilian government enacted law n. 12.732 (which became enforceable only 180 days after its publication), which specifies a maximum period of 60 days from diagnosis to treatment of cancer patients by the SUS (12), closing the gap between Brazil and certain developed countries concerning the regulation of the time-line for cancer treatment.
On average, the period from diagnosis to treatment in our service is already very close to what the law specifies (a mean of 2.08 months), which is the result of the joint work of the Hematology, Pathology, Radiology, Surgery and Intensive Care Departments as well as the available resources and physical structure. Together, departments, resources and physical structure are responsible for our positive results: a 3-year overall survival of 82.8% (Figure 2) and a progression-free survival of 87.5% (7).
Nonetheless, there remains a delay of approximately 7.4 months to obtain a biopsy. The shortening of this time is paramount for the achievement of improved results. However, the timeframe preceding biopsy is not addressed by law 12.732, despite the fact that such a delay can be responsible for disease dissemination and the deterioration of a patient’s performance status.
Due to the limited number of cases studied, we believe that our results should be confirmed in future studies. A public health bias likely contributed to our superior survival outcome; with a median of 6.4 months between symptoms/ signs to the first appointment with a hematologist, most patients with aggressive lymphomas with worse biological
Figure 1 -Time between first signs or symptoms and commencement of DLBCL patients’ treatment. Blue: Time from signs or symptoms to diagnostic biopsy. Red: Time from diagnostic biopsy to first appointment with a hematologist. Green: Time from first appointment with a hematologist (including image staging, bone marrow biopsy and diagnostic review) to treatment commencement.
Table 2 -Correlation between time-to-treatment and treatment outcomes.
TST (months) N (%) CR 3-year PFS 3-year OS
p-value* (%) p-value* (%) p-value*
.3 0.5518 0.439 0.688
No 4 (10.8) 100 75
Yes 33 (89.2) 84.4 81.5
.3 (intermediate-high/high IPI or poor RIPI subgroup1,2)
- 0.2995 0.9186
No 3 (16.7) 100 66.7
Yes 15 (83.3) 66.7 60,0
.6 0.8650 0.049 0.133
No 15 (16.7) 100 93.3
Yes 22 (59.5) 76.2 72.1
.6 (intermediate-high/high IPI or poor RIPI subgroup1,2)
- 0.0184 0.0617
No 8 (44.4) 100 87.5
Yes 10 (55.6) 44.43 37.53
TST: Time from signs or symptoms of disease onset to first treatment. CR: Complete response. PFS: Progression-free survival. OS: Overall survival. IPI: International Prognostic Index. RIPI: Revised International Prognostic Index.
1The patients’ distribution was the same for an intermediate-high/high IPI and a poor RIPI.
2Low-risk subgroup analysis was not possible because there was no event (relapse, disease progression or death) in this group. 32.8-year PFS.
*Significant at
p,0.05.
Table 3 -Multivariate analysis by Cox logistic regression.
Variable PFS OS
p-value* p-value*
TST (.6 or#6 months) 1.00 0.13
Performance status ($2vs.,2) 0.60 0.22
Age (#60vs..60 years) 0.75 0.91
Lactate dehydrogenase level (normalvs.elevated) 1.00 **
Extranodal sites ($2vs.,2) 0.59 0.36
Ann Arbor stage (I/IIvs.III/IV) 1.00 **
TST (.6 or#6 months) 1.00 0.09
IPI (low-intermediate risk plus low riskvs.intermediate-high risk plus high risk) 1.00 1.00
TST (.6 or#6 months) 1.00 0.09
RIPI (very good, good or poor) 1.00 1.00
TST: Time from signs or symptoms of disease onset to first treatment. PFS: Progression-free survival. OS: Overall survival. IPI: International Prognostic Index. RIPI: Revised International Prognostic Index.
*
Significant atp,0.05.
**Variables were excluded because of the absence of an event in patients with normal lactate dehydrogenase levels or Ann Arbor clinical stage I/II.
features or poor clinical conditions are likely to die before being diagnosed or before meeting a hematologist. Solving this public bias could rescue these missing data and allow for more realistic statistics.
In conclusion, we understand that it is necessary to invest in health care training and the capacitation of primary and secondary health care assistance in Brazil to accelerate the discovery of lymphoma in patients. We also understand that it is equally important to establish the proceedings for the transfer of such patients to specialized centers.
& AUTHOR CONTRIBUTIONS
This paper encompasses several results and observations of public health importance derived from Dr. Fla´via Dias Xavier’s PhD thesis. Xavier FD and Pereira J have treated and followed the cohort of patients with DLBCL since 2008. Pereira J guided the work. Xavier FD collected the data, performed the statistical analysis and wrote the manuscript. Levy D assisted with the laboratory data collection and analysis. All authors reviewed the data and statistical analysis and approved the manuscript.
& REFERENCES
1. Instituto Nacional do Caˆncer. Available from: http://www1.inca.gov. br/vigilancia.
2. Anderson JR, Armitage JO, Weisenburger DD. Epidemiology of the non-Hodgkin’s lymphomas: distributions of the major subtypes differ by geographic locations. Non-Hodgkin’s Lymphoma Classification Project. Annals of Oncology. 1998;9(7):717-20, http://dx.doi.org/10.1023/A: 1008265532487.
3. International Lymphoma Study Group. A clinical evaluation of the International Lymphoma Study Group classification of non-Hodgkin’s lymphoma. The Non-Hodgkin’s Lymphoma Classification Project. Blood. 1997;89(11):3909-18.
4. Gouveia GR, Siqueira SAC, Chamone DAF, Pereira J. Prevalence of non-Hodgkin lymphomas in Sa˜o Paulo, Brazil. Rev Bras Hematol Hemoter. 2011;33(4):317, http://dx.doi.org/10.5581/1516-8484.20110085. 5. The International Agency for Research on Cancer. WHO Classification of
Tumours of Haematopoietic and Lymphoid Tissue. 4th ed. Lyon; WHO Press; 2008. 310p.
6. Armitage JO, Weisenburger DD. New Approach to Classifying Non-Hodgkin’s Lymphomas: Clinical Features of the Major Histologic Subtypes. J Clin Oncol. 1998;16(8):2780-95.
7. Xavier FD. Padra˜o de expressa˜o e significado progno´stico dos genes BCL2, BCL6, CCND2, FN1, LMO2 e SCYA3 pela te´cnica de PCR em tempo real em linfoma difuso de grandes ce´lulas B tratado com rituximabe [thesis]. Sa˜o Paulo: Universidade de Sa˜o Paulo; 2013. 162p. 8. Coiffier B, Lepage E, Briere J, Herbrecht R, Tilly H, Bouabdallah R, et al.
CHOP chemotherapy plus rituximab compared with CHOP alone in elderly patients with diffuse large-B-cell lymphoma. N Engl J Med. 2002;346(4):235-42.
9. Moreno A, Colon-Otero G, Solberg LA Jr. The prednisone dosage in the CHOP chemotherapy regimen for non-Hodgkin’s lymphomas (NHL): is there a standard? Oncologist. 2000;5(3):238-49, http://dx.doi.org/10. 1634/theoncologist.5-3-238.
10. Cheson BD, Pfistner B, Juweid ME, Gascoyne RD, Specht L, Horninget SJ, et al. Revised response criteria for malignant lymphoma. J Clin Oncol. 2007;25(5):579-86, http://dx.doi.org/10.1200/JCO.2006.09.2403. 11. Department of Health. Review of Cancer Waiting Times Standards.
Improving Outcomes: A Strategy for Cancer. United Kingdom, 2011. Available from: https://www.gov.uk/government/uploads/system/ uploads/attachment_data/file/135516/dh_123394.pdf.pdf.