AR
TIGO
AR
TICLE
1 Instituto de Medicina Social, Universidade do Estado do Rio de Janeiro. R. São Francisco Xavier 524/Pavilhão João Lyra Filho/7º andar/blocos D e E, Maracanã. 20550-013 Rio de Janeiro RJ Brasil. [email protected] 2 Escola Nacional de Saúde Pública, Fundação Oswaldo Cruz. Rio de Janeiro RJ Brasil.
Car and motorcycle deaths: an evolutionary perspective
Mortes por batida de carro e moto: uma perspectiva evolucionista
Resumo Objetivamos averiguar diferenças entre
homens e mulheres na exposição ao trânsito como motorista de carro e de moto e no risco de morrer por batida desses veículos, para verificar até que ponto a teoria da seleção sexual de Darwin pode predizer os achados e ajudar a interpretá-los. A população de estudo foi composta por homens e mulheres de 18 a 60 anos residentes no Estado do Rio de Janeiro, entre 2004 e 2010, e no Estado do Rio Grande do Sul, entre 2001 e 2010. Elaboramos tabelas de frequência e gráficos de barras para ve-rificar se havia diferenças entre os sexos e intera-ção de sexo com idade. Homens se expuseram e morreram mais no trânsito do que mulheres, espe-cialmente os jovens. A sociedade deveria ter uma atitude especialmente vigilante com homens ao volante devido à tendência inata deles de maior exposição ao risco. A teoria da seleção sexual de Darwin pode ser uma potente aliada na postula-ção de hipóteses que busquem aperfeiçoar políticas públicas para reduzir a quantidade exagerada de mortes no trânsito, especialmente em sociedades onde o machismo for forte ou o estímulo à mascu-linidade exagerado.
Palavras-chave Acidentes de trânsito, Motocicle-tas, Automóveis, Sexo, Evolução biológica
Abstract Our aim was to assess differences
be-tween men and women in the likelihood of expo-sure to traffic as drivers of cars and motorcycles, and in the risk of dying from a car or a motor-cycle crash, in order to verify the extent to which Darwin’s Sexual Selection Theory could have pre-dicted the findings and can help to interpret them. Study population was composed of men and women aged 18 to 60 years residents in the state of Rio de Janeiro between 2004 and 2010, and in the state of Rio Grande do Sul between 2001 and 2010. We built frequency distribution tables and drew bar charts in order to check whether there were differences between the sexes and interac-tions of sex with age. More men exposed them-selves to and died in traffic than women, especial-ly the young. Society should have an especialespecial-ly vigilant attitude towards men on the wheel due to their increased innate tendency to exposure to risk. Darwin’s sexual selection theory can be an important ally when postulating hypotheses and interpreting epidemiological findings aiming at improving public policies to reduce the excessive number of traffic deaths, especially in societies where machismo is strong or the stimulus to mas-culinity is exaggerated.
Key words Accidents traffic, Motorcycles, Auto-mobiles, Sex, Biological Evolution
André Luís dos Santos Medeiros 1
M
ed
eir
os
ALS,
N
adano
Introduction
Everywhere there are more traffic crash deaths
among men, especially young, than women1.
Despite the social, cultural and political expla-nations presented by gender and masculinities scholars, there is a gap regarding explanations for the origin, i.e. the ultimate cause, of these differ-ences. An attempt to answer this ultimate cause question may point to risk factors, relevant in-teractions and effective interventions, scarcely or rarely contemplated up to now.
This study, differently from its predecessors1,
starts with a priori postulated hypotheses on how and why should the risk of dying in a traffic crash (TC) vary according to sex and age. The theoreti-cal basis of our hypotheses, and interpretation of findings, is Darwin’s Sexual Selection Theory ap-plied to the study of human behavior, specifically, the “Young Male Syndrome”, described ahead.
Risk factors (proximate causes)
The risk factors, or more proximate causes, of TC deaths include the amount or duration of trips, the mode of transport, the use of safety de-vices, the natural resistance of the individual and
the possibilities of cure2,3. Human factors alone,
such as reckless behavior, driver’s mistakes and sleep at the wheel, are involved in more than 90%
of TCs4,5. Drink and driving is one of the main
causes of TCs6-10. An increase in speed is
associat-ed with both the probability of a crash occurring and of it being severe and the reduction of speed
limits may reduce the rate of TCs9-13. The use of
seat belts seems to be the more effective way of
reducing fatal and non-fatal lesions9,14.
Who dies in TCs?
Men, especially the young, are the main vic-tims of TCs’ death everywhere. Among the pos-sible causes for this mortality predominance in young men is the reckless behavior in traffic in
addition to an increased use of alcohol1,8-10,15-19.
Another complementary hypothesis is simply that men drive more. However, even after con-trolling for distances driven, a large sex difference
remains, and this difference depends on age20,21.
In any case, increased exposure is also part of the explanation of why they die more.
So, how to explain this discrepancy? If men in fact take more risks by exposing themselves more to and in traffic, there must be a cause for this default behavior.
Darwin’s Sexual Selection Theory
Throughout history, males have been sub-ject to sexual selection through sexual courtship, fights and coercion more than females. This is es-pecially true in mammals, including humans, in whom the demands for pregnancy and lactation reduce the maximum reproduction limit of
fe-males22. This evolutionary history generated
dif-ferent adaptations in males and females. Under this perspective, evolutionary psy-chologists formulated a theory in which men are more prone to dangerous competition and, therefore, risk situations, than women and that this propensity was adaptive as it increased men’s
fitness (reproductive likelihood)23.
The Young Male Syndrome
“Women are, therefore, from the point of view of sexual selection, a “resource” for which men compete. This competition not necessarily takes place as a direct fight for women. Men may adopt different strategies in this fight, competing for other resources that may be converted into reproductive opportunities, such as political in-fluence and social status, for these resources are directly attractive for women or because they
help pacify (or repel) rival men”23.
Several lines of evidence support the conclu-sion that young men constitute a demographic class specialized by sexual selection for
maxi-mum competitive efforts and risk acceptance24,25.
There is morphological and physiological
evi-dence26. Young men seem to be psychologically
specialized to embracing danger. In several activ-ities, young men seem to be especially motivated by competition and less discouraged by danger
than older men and women27,28.
Driving and risky driving may not increase male fitness in the modern environment, but the psychological predispositions that lead modern men to drive more and drive riskily may have been adaptive for our ancestors. For example, overtaking by a man may trigger a risky driving reaction in modern young men and teenagers, who might feel humiliated in this situation. Male teenage drivers were less likely to wear seatbelt, more likely to drink and drive and to be involved
in TC, when carrying passengers29. On the other
be-aúd
e C
ole
tiv
a,
21(12):3691-3702,
2016
cause the women insisted that they drove more
carefully29.
To show off skills in the form of keen agility and reflexes while speeding may be an “honest” form of advertising value as a sexual partner to the opposite sex and as an able competitor to
other men30. To exhibit a lack of fear of driving
fast, to drive drunk or speaking on the phone could also be ways of advertising prowess even
when handicapped30.
Women revealed themselves to be more risk averse than men in several activities, including crime, gambling, sexual behavior and drugs and
alcohol consumption31.
Hypotheses and their rationale
If men are more competitive and, conse-quently, more prone to exhibit risky behavior than women, it is expected that they will expose themselves more to traffic as drivers and die more from TC, as these events are related to behaviors such as speeding, drinking and driving, not wear-ing a seatbelt, exhibitionism, and disrespectwear-ing traffic laws. Even when these reckless driving be-haviors are not directly exhibited, as is the case for example with many professional drivers and motorcyclists, if driving everyday for long hours is a way of earning an income, more men than women will feel the pressure to earn resources at any price, including risking themselves in traffic for long hours. The individuals who drive a car or a motorcycle are taking risks, provoked either by themselves or by other drivers. If that is a price to pay for some comfort or convenience, it is ex-pected no difference between men and women. However, if in addition to comfort and conve-nience driving a car or a motorcycle is a way of showing off personal skills, bravery or of earning resources such as an income, in a competition for sexual partners, more men than women will hold licenses to drive cars and especially motorcycles. Additionally, more male drivers will die from a TC, car or motorcycle, than female drivers.
If the main reason why a man competes and, consequently, risks himself, is to obtain sexu-al access to women (even if unconsciously), the psychological pressure to take risks should lessen, when he already has a woman and a child. There is a higher proportion of married men with chil-dren among older men so younger men should take more risks than the older. The younger are trying to obtain resources that older men already have and want to protect; to protect resources already obtained, it is better not to take many
risks. Therefore, the difference between the sexes in the exposure to traffic (proportions that hold a license) especially as motorcyclists, and in TC death should be higher among the younger than the older.
Our aim was to assess differences between men and women in the likelihood of exposure to traffic as drivers of cars and motorcycles, and in the risk of dying from a car or a motorcycle crash, in order to verify the extent to which Darwin’s Sexual Selection Theory could have predicted the findings and can help to interpret them.
Methods
Design, settings and population
We carried out an ecological study with an-nual sectional secondary data that included men and women aged 18 to 60 years, residents in the states of Rio de Janeiro, between 2004 and 2010, and Rio Grande do Sul, between 2001 and 2010.
Data
We collated data for car and motorcycle crash deaths, available at Mortality Information
Sys-tem (SIM), from the DATASUS website (www.
datasus.gov.br) in January 2012. We compiled the number of inhabitants in each state from the Brazilian Institute of Geography and Statistics
(IBGE), available at this same website. Anyone
visiting the DATASUS website can directly
ac-cess the same data used for our study. The exact link to these data is: http://www2.datasus.gov. br/DATASUS/index.php?area=0205. We asked representatives from the 27 Traffic Departments (DETRANS) in Brazil (26 states in Brazil and its capital, Brasília), by e-mail and telephone, about the number of licensed car and motorcycle driv-ers, by age and sex. Only Rio de Janeiro (RJ) and Rio Grande do Sul (RS) provided these data by sex and age; they provided these data in
elec-tronic format, the spreadsheet Excel. We did not
seek ethical approval because our research relied exclusively on publicly available information le-gally accessible to the public and appropriately protected by law through the data guardians, i.e., DATASUS and on secondary use of anonymous
information provided by the DETRANS of Rio
de Janeiro and of Rio Grande do Sul. These data are not individually identifiable and data linkage does not generate identifiable information. We
M
ed
eir
os
ALS,
N
adano
anonymous format; their representatives pro-vided the data without any participant´s names or any other form of identification. These
rep-resentatives from the DETRANS were civil
ser-vants who provided the data officially, and made sure that they were allowed to provide such data institutionally. The information collected from the DETRANS´ representatives was not publicly available at the time of collection; all of this in-formation is available in the tables of the present article.
Variables
The four outcome variables were:
- Death in a car crash. Driver or other occu-pant (International Classification of Disease - ICD10, V40 – V49);
- Death in a motorbike crash. Driver or other
occupant (ICD 10, V20 – V29);
- License to drive only cars (DETRAN,
cate-gory B);
- License to drive only bikes or bikes and
oth-er vehicles (DETRAN, categories A, AB, AC, AD
and AE).
The two exposure variables were: - Sex (men and women);
- Age group (18 to 30 and 31 to 60 years).
Data analysis
The data analyses rationale was to verify the association between sex and the outcomes con-sidering a possible interaction with age. We elab-orated frequency tables and bar charts.
We calculated the proportions of the licensed populations to drive car and motorcycle placing on the numerator the number of licensed drivers
in the respective categories (DETRAN categories
A and B) in RJ and RS, separated by sex and age group, between 2004 and 2010 in RJ and 2001 and 2010 in RS. We placed at the denominator the number of inhabitants in the same classes of sex and age in the referred states then multiplied this ratio by 100 to obtain the number of licensed drivers per 100 inhabitants.
The death to inhabitant ratio in car and mo-torbike crashes were calculated placing at the
nu-merator the number of car deaths (ICD 10, V40
– V49) and of motorcycle deaths (ICD 10, V20
– V29), respectively, in RJ and RS, categorized by sex and age group, between 2004 and 2010 in RJ, and 2001 and 2010 in RS. We placed at the denominator the number of inhabitants in the same classes of sex and age in the referred states
then multiplied this ratio by 100.000 to obtain the number of deaths per 100.000 inhabitants.
We calculated the death to licensed ratio in car and motorcycle crashes placing on the numerator
the number of car deaths (ICD 10, V40 – V49)
and of motorcycle deaths (ICD 10, V20 – V29),
respectively, in RJ and RS, categorized by sex and age group, between 2004 and 2010 in RJ, and 2001 and 2010 in RS. At the denominator we placed the
number of licensed drivers to drive only car (
DE-TRAN, category B) and the number of licensed
drivers to drive motorcycles (DETRAN,
catego-ries A, AB, AC, AD and AE), respectively, in the same classes of sex and age in the referred states. We multiplied these ratios by 10.000 to obtain the number of deaths per 10.000 licensed to drive only car, and to drive motorcycle.
Results
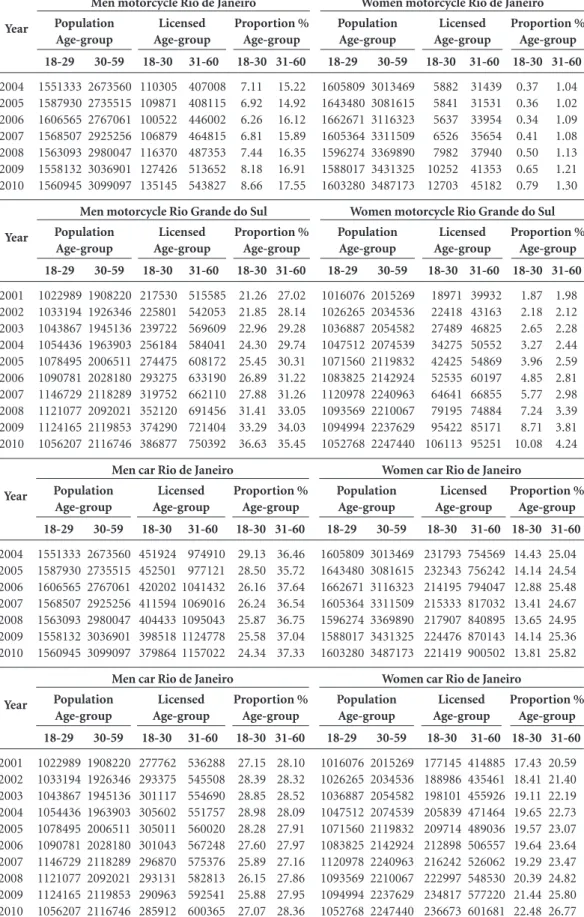
The proportion of individuals licensed to drive a car in the population varied from 36.8% in 31 to 60 year-old men to 13.8% in 18 to 30 year-old women in RJ (annual average in the years ana-lyzed). Regarding motorcycles, these proportions varied from 31% in 31 to 60 year-old men in RS to 0.5% in 18 to 30 year-old women in RJ. The most accentuated differences between the sexes were observed in relation to the proportions li-censed to drive motorcycles in RS. The difference between the sexes in relation to license to drive cars was most pronounced in the 18 to 30 age group in RS while in RJ this difference was equiv-alent in both age groups. The difference between the sexes in relation to license to drive motorcy-cles was most pronounced in the 31 to 60 year-old age group in RJ while in RS this difference was equivalent in both age groups (Graphic 1, Table 1).
The risk of dying in a car crash in the popu-lation varied from 10.3 per 100.000 in 18 to 30 year-old men in RS to 1.6 per 100.000 in 31 to 60 year-old women in RJ (annual average in the years analyzed). In a motorcycle crash, this risk varied from 15.9% in 18 to 30 year-old men in RJ to 0.4% in 31 to 60 year-old women in RS. The dif-ference between the sexes was more pronounced in relation to motorcycle than car deaths. Either regarding car or motorcycle deaths the difference between the sexes was larger in the 18 to 30 year-olds (Graphic 2 and Graphic 3, Table 2).
aúd
e C
ole
tiv
a,
21(12):3691-3702,
2016
men in RS to 0.6 per 10.000 in 31 to 60 year-old women in RJ (annual average in the years ana-lyzed). In a motorcycle crash this risk varied from 38.3 in 18 to 30 year-old women in RJ to 1.3 in 31 to 60 year-old women in RS. In RJ, the risk of dying in a motorcycle crash in relation to the number of individuals of the same sex and ages licensed to drive a motorcycle was higher among women than men in both age groups. The dif-ference between the sexes was more pronounced in relation to motorcycle than car deaths. Either regarding car or motorcycle deaths the difference between the sexes was larger in the 18 to 30 year-olds (Graphic 2 and Graphic 3, Table 2).
Discussion
Driving seems to be a very risky activity in the two Brazilian states analyzed, but it was not uni-formly distributed in these populations. Greater proportions of men than women had license to drive cars. In relation to license to drive
motor-cycles, a riskier activity, the proportions of men were markedly greater. The risk of dying in a car or motorcycle crash in the population followed the same pattern of the proportions licensed to drive; much higher risks among men than among women and more accentuated differences be-tween the sexes in the younger age group, espe-cially in relation to death in a motorcycle. Part of this greater risk of dying in TC among men may be, simply, due to greater exposure to traffic (greater proportions of men licensed to drive). For this reason, we thought useful to verify whether beyond this increased risk due to greater exposure, the risk, considering the level of expo-sure, that is, in relation to the number licensed to drive, would still be higher among men. Again, we found that the risk of dying in a TC, consid-ering the number licensed to drive, was high-er among men. Thhigh-erefore, the increased risk of death among men was not only a consequence of more men being drivers, but also of men´s behavior while driving. However, there were two exceptions in these ratios: men and women aged
Graphic 1. Proportions (%)* of the population licensed to drive motorcycle and car, according to sex and
age-group, in the states of Rio Grande do Sul and of Rio de Janeiro.
* Annual averages for the period 2001-2010 in RS and 2004-2010 in RJ, based on Table 1. ,00
M
en 18-30 b
ik
e
Me
an
10,00 20,00 30,00 40,00
W
o
me
n 18-30 b
ik
e
M
en 31-60 b
ik
e
W
o
me
n 31-60 b
ik
e
M
en 18-30 car
W
o
me
n 18-30 car
M
en 31-60 car
W
o
me
n 31-60 car
27,19
5,06 30,95
2,86 27,42
19,74 28,02
23,45
Rio Grande do Sul (RS)
,00
M
en 18-30 b
ik
e
Me
an
10,00 20,00 30,00 40,00
W
o
me
n 18-30 b
ik
e
M
en 31-60 b
ik
e
W
o
me
n 31-60 b
ik
e
M
en 18-30 car
W
o
me
n 18-30 car
M
en 31-60 car
W
o
me
n 31-60 car
7,34
0,49 16,14
1,12 26,54
13,78 36,78
25,12
M ed eir os ALS, N adano
Table 1. Population, number licensed to drive and proportion of the population licensed to drive motorcycle and
car, according to sex and age-group, in Rio de Janeiro between 2004 and 2010, and in Rio Grande do Sul between 2001 and 2010.
Year 2004 2005 2006 2007 2008 2009 2010 18-29 1551333 1587930 1606565 1568507 1563093 1558132 1560945 30-59 2673560 2735515 2767061 2925256 2980047 3036901 3099097 18-30 7.11 6.92 6.26 6.81 7.44 8.18 8.66 31-60 15.22 14.92 16.12 15.89 16.35 16.91 17.55 Population Age-group
Men motorcycle Rio de Janeiro
31-60 407008 408115 446002 464815 487353 513652 543827 18-30 110305 109871 100522 106879 116370 127426 135145 Licensed Age-group Proportion % Age-group 18-29 1605809 1643480 1662671 1605364 1596274 1588017 1603280 30-59 3013469 3081615 3116323 3311509 3369890 3431325 3487173 18-30 0.37 0.36 0.34 0.41 0.50 0.65 0.79 31-60 1.04 1.02 1.09 1.08 1.13 1.21 1.30 Population Age-group
Women motorcycle Rio de Janeiro
31-60 31439 31531 33954 35654 37940 41353 45182 18-30 5882 5841 5637 6526 7982 10252 12703 Licensed Age-group Proportion % Age-group Year 2001 2002 2003 2004 2005 2006 2007 2008 2009 2010 18-29 1022989 1033194 1043867 1054436 1078495 1090781 1146729 1121077 1124165 1056207 30-59 1908220 1926346 1945136 1963903 2006511 2028180 2118289 2092021 2119853 2116746 18-30 21.26 21.85 22.96 24.30 25.45 26.89 27.88 31.41 33.29 36.63 31-60 27.02 28.14 29.28 29.74 30.31 31.22 31.26 33.05 34.03 35.45 Population Age-group
Men motorcycle Rio Grande do Sul
31-60 515585 542053 569609 584041 608172 633190 662110 691456 721404 750392 18-30 217530 225801 239722 256184 274475 293275 319752 352120 374290 386877 Licensed Age-group Proportion % Age-group 18-29 1016076 1026265 1036887 1047512 1071560 1083825 1120978 1093569 1094994 1052768 30-59 2015269 2034536 2054582 2074539 2119832 2142924 2240963 2210067 2237629 2247440 18-30 1.87 2.18 2.65 3.27 3.96 4.85 5.77 7.24 8.71 10.08 31-60 1.98 2.12 2.28 2.44 2.59 2.81 2.98 3.39 3.81 4.24 Population Age-group
Women motorcycle Rio Grande do Sul
31-60 39932 43163 46825 50552 54869 60197 66855 74884 85171 95251 18-30 18971 22418 27489 34275 42425 52535 64641 79195 95422 106113 Licensed Age-group Proportion % Age-group Year 2004 2005 2006 2007 2008 2009 2010 18-29 1551333 1587930 1606565 1568507 1563093 1558132 1560945 30-59 2673560 2735515 2767061 2925256 2980047 3036901 3099097 18-30 29.13 28.50 26.16 26.24 25.87 25.58 24.34 31-60 36.46 35.72 37.64 36.54 36.75 37.04 37.33 Population Age-group
Men car Rio de Janeiro
31-60 974910 977121 1041432 1069016 1095043 1124778 1157022 18-30 451924 452501 420202 411594 404433 398518 379864 Licensed Age-group Proportion % Age-group 18-29 1605809 1643480 1662671 1605364 1596274 1588017 1603280 30-59 3013469 3081615 3116323 3311509 3369890 3431325 3487173 18-30 14.43 14.14 12.88 13.41 13.65 14.14 13.81 31-60 25.04 24.54 25.48 24.67 24.95 25.36 25.82 Population Age-group
Women car Rio de Janeiro
31-60 754569 756242 794047 817032 840895 870143 900502 18-30 231793 232343 214195 215333 217907 224476 221419 Licensed Age-group Proportion % Age-group Year 2001 2002 2003 2004 2005 2006 2007 2008 2009 2010 18-29 1022989 1033194 1043867 1054436 1078495 1090781 1146729 1121077 1124165 1056207 30-59 1908220 1926346 1945136 1963903 2006511 2028180 2118289 2092021 2119853 2116746 18-30 27.15 28.39 28.85 28.98 28.28 27.60 25.89 26.15 25.88 27.07 31-60 28.10 28.32 28.52 28.09 27.91 27.97 27.16 27.86 27.95 28.36 Population Age-group
Men car Rio de Janeiro
31-60 536288 545508 554690 551757 560020 567248 575376 582813 592541 600365 18-30 277762 293375 301117 305602 305011 301043 296870 293131 290963 285912 Licensed Age-group Proportion % Age-group 18-29 1016076 1026265 1036887 1047512 1071560 1083825 1120978 1093569 1094994 1052768 30-59 2015269 2034536 2054582 2074539 2119832 2142924 2240963 2210067 2237629 2247440 18-30 17.43 18.41 19.11 19.65 19.57 19.64 19.29 20.39 21.44 22.48 31-60 20.59 21.40 22.19 22.73 23.07 23.64 23.47 24.82 25.80 26.77 Population Age-group
Women car Rio de Janeiro
aúd e C ole tiv a, 21(12):3691-3702, 2016
Table 2. Number of deaths and ratios of the number of deaths per ten thousand licensed to drive (a) and per
one hundred thousand inhabitants (b) according to type of vehicle, sex and age-group in Rio de Janeiro between 2004 and 2010 and in Rio Grande do Sul between 2001 and 2010.
Year 2001 2002 2003 2004 2005 2006 2007 2008 2009 2010 18-30 82 96 113 110 115 105 112 117 124 137 31-60 101 113 117 131 128 132 137 127 153 160 Deaths Age-group
Men car State of Rio Grande do Sul
18-30 b 8.02 9.29 10.83 10.43 10.66 9.63 9.77 10.44 11.03 12.97 18-30 a 2.95 3.27 3.75 3.60 3.77 3.49 3.77 3.99 4.26 4.79 Ratios Age-group
Women car State of Rio Grande do Sul
31-60 b 5.29 5.87 6.02 6.67 6.38 6.51 6.47 6.07 7.22 7.56 31-60 a 1.88 2.07 2.11 2.37 2.29 2.33 2.38 2.18 2.58 2.67 18-30 20 30 31 20 22 24 20 29 25 28 31-60 25 38 36 31 33 25 23 38 37 58 Deaths Age-group 18-30 b 1.97 2.92 2.99 1.91 2.05 2.21 1.78 2.65 2.28 2.66 18-30 a 1.13 1.59 1.56 0.97 1.05 1.13 0.92 1.30 1.06 1.18 Ratios Age-group 31-60 b 1.24 1.87 1.75 1.49 1.56 1.17 1.03 1.72 1.65 2.58 31-60 a 0.60 0.87 0.79 0.66 0.67 0.49 0.44 0.69 0.64 0.96 Year 2001 2002 2003 2004 2005 2006 2007 2008 2009 2010 18-30 78 85 104 119 131 140 144 147 185 186 31-60 36 59 51 97 82 102 99 104 104 120 Deaths Age-group
Men motorcycle State of Rio Grande do Sul
18-30 b 7.62 8.23 9.96 11.29 12.15 12.83 12.56 13.11 16.46 17.61 18-30 a 3.59 3.76 4.34 4.65 4.77 4.77 4.50 4.17 4.94 4.81 Ratios Age-group
Women motorcycle State of Rio Grande do Sul
31-60 b 1.89 3.06 2.62 4.94 4.09 5.03 4.67 4.97 4.91 5.67 31-60 a 0.70 1.09 0.90 1.66 1.35 1.61 1.50 1.50 1.44 1.60 18-30 5 14 13 11 9 12 13 27 17 26 31-60 4 7 5 4 7 13 15 2 11 10 Deaths Age-group 18-30 b 0.49 1.36 1.25 1.05 0.84 1.11 1.16 2.47 1.55 2.47 18-30 a 2.64 6.24 4.73 3.21 2.12 2.28 2.01 3.41 1.78 2.45 Ratios Age-group 31-60 b 0.20 0.34 0.24 0.19 0.33 0.61 0.67 0.09 0.49 0.44 31-60 a 1.00 1.62 1.07 0.79 1.28 2.16 2.24 0.27 1.29 1.05 Year 2004 2005 2006 2007 2008 2009 2010 18-30 141 180 169 148 113 93 97 31-60 210 223 192 207 172 120 135 Deaths Age-group
Men car State of Rio de Janeiro
18-30 b 9.09 11.34 10.52 9.44 7.23 5.97 6.21 18-30 a 3.12 3.98 4.02 3.60 2.79 2.33 2.55 Ratios Age-group
Women car State of Rio de Janeiro
31-60 b 7.85 8.15 6.94 7.08 5.77 3.95 4.36 31-60 a 2.15 2.28 1.84 1.94 1.57 1.07 1.17 18-30 40 41 51 48 34 27 33 31-60 67 63 48 63 47 43 28 Deaths Age-group 18-30 b 2.49 2.49 3.07 2.99 2.13 1.70 2.06 18-30 a 1.73 1.76 2.38 2.23 1.56 1.20 1.49 Ratios Age-group 31-60 b 2.22 2.04 1.54 1.90 1.39 1.25 0.80 31-60 a 0.89 0.83 0.60 0.77 0.56 0.49 0.31 Year 2004 2005 2006 2007 2008 2009 2010 18-30 167 209 286 269 306 278 231 31-60 109 118 140 154 178 171 168 Deaths Age-group
Men motorcycle State of Rio de Janeiro
18-30 b 10.76 13.16 17.80 17.15 19.58 17.84 14.80 18-30 a 15.14 19.02 28.45 25.17 26.30 21.82 17.09 Ratios Age-group
Women motorcycle State of Rio de Janeiro
M
ed
eir
os
ALS,
N
adano
31 to 60 in Rio Grande do Sul presented similar risks of dying in a motorcycle crash, and women in Rio de Janeiro, especially the younger, showed a much higher risk of dying in a motorcycle crash than men in the same State.
The first exception was not a surprise, on the contrary, it was in the expected direction and reinforced the thesis that older men are less competitive and ostentatious of their skills than younger men, therefore, present a more prudent
Graphic 2. Ratios* of deaths per one hundred thousand inhabitants (a) and per ten thousand licensed to drive
(b) in car and motorcycle crashes in the state of Rio Grande do Sul (RS) according to sex and age-group.
* Annual averages for the period 2001-2010, based on Table 2.
Car
,00
M
en 18-30
Me
an
4,00 8,00 10,00 12,00
W
o
me
n 18-30
M
en 31-60
W
o
me
n 31-60
10,31
2,34
6,40
1,61
a) Per one hundred thousand inhabitants
6,00
2,00
,00
M
en 18-30
Me
an
3,00 4,00
W
o
me
n 18-30
M
en 31-60
W
o
me
n 31-60
3,77
1,19
2,29
,68
b) Per ten thousand licensed
2,00
1,00
Motorcycle
,00
M
en 18-30
Me
an
4,00 8,00 10,00 12,00
W
o
me
n 18-30
M
en 31-60
W
o
me
n 31-60
12,18
1,38
4,18
,36
a) Per one hundred thousand inhabitants
6,00
2,00
,00
M
en 18-30
Me
an 3,00
4,00
W
o
me
n 18-30
M
en 31-60
W
o
me
n 31-60
4,43
3,09
1,33 1,28
b) Per ten thousand licensed
2,00
aúd
e C
ole
tiv
a,
21(12):3691-3702,
2016
behavior profile, more similar to women. How-ever, the second finding was surprising, appar-ently refuting the hypothesis that men are more reckless in traffic than women are and, for that, run higher risk of dying.
Therefore, we observed a strong congruency of the findings and the postulated hypothesis; nearly all comparisons suggested that men took more risks than women did, especially the young. However, according to the number licensed to
Graphic 3. Ratios* of deaths per one hundred thousand inhabitants (a) and per ten thousand licensed to drive
(b) in car and motorcycle crashes in the state of Rio de Janeiro (RJ) according to sex and age-group.
* Annual averages for the period 2004-2010, based on Table 2.
Car
,00
M
en 18-30
Me
an
4,00 8,00 10,00
W
o
me
n 18-30
M
en 31-60
W
o
me
n 31-60
8,54
2,42
6,30
1,59
a) Per one hundred thousand inhabitants
6,00
2,00
,00
M
en 18-30
Me
an
3,00 4,00
W
o
me
n 18-30
M
en 31-60
W
o
me
n 31-60
3,20
1,76 1,72
,64
b) Per ten thousand licensed
2,00
1,00
Motorcycle
,00
M
en 18-30
Me
an
15,00 20,00
W
o
me
n 18-30
M
en 31-60
W
o
me
n 31-60
15,87
1,76
5,11
,40
a) Per one hundred thousand inhabitants
10,00
5,00
,00
M
en 18-30
Me
an
30,00
W
o
me
n 18-30
M
en 31-60
W
o
me
n 31-60
21,86
38,31
3,16 4,26
b) Per ten thousand licensed
20,00
M
ed
eir
os
ALS,
N
adano
drive a motorcycle, women died more frequently than men in Rio de Janeiro. How could we ex-plain this unexpected finding that apparently re-futed the postulated hypothesis?
One possibility is that the women in Rio de Janeiro died often not as conductors, but as pas-sengers on the motorcycles; as the number of female registered motorcyclists was very small in Rio, every death of a woman as a passenger in a motorcycle would have a strong artifact in-fluence on this death per registered driver ratio. Another possibility is that women motorcyclists in Rio composed a special group, with higher propensity to risk; traffic in Rio was knowingly so deadly for motorcyclists that only a special few would dare to face it driving a motorcycle (the very small proportion of women licensed to drive motorcycles in Rio reinforces this suspicion). A third possibility is that women, in general, appear
to have less spatial abilities than men32, and this
skill could be crucial to avoid motorcycle crashes in such difficult driving circumstances as the ag-gressive traffic in Rio.
One important limitation in our study was that the mortality data did not differentiate con-ductors from passengers. Therefore, there may be cases in which the conductor was a man, but a woman was a victim as passenger in the car or on the motorcycle and vice-versa. As in the Brazilian culture it is the man who usually drives the vehi-cle, we presume that it should have been uncom-mon the situation in which the woman was the driver and the man the victim as a passenger. On the other hand, the inverse should not have been such an uncommon situation; that is, the man driving and the woman being the victim as a pas-senger. If these assumptions are correct, the deaths of female drivers (based on the number of women licensed to drive) were overestimated in our study.
Another limitation was the small geographi-cal coverage of the data. We tried to obtain data from the 26 States in Brazil and its capital, Brasília, however only Rio de Janeiro and Rio Grande do Sul provided appropriate data. As we did not aim at comparing States or infer about the situation in Brazil as a whole, the analysis, in two States ap-pears to be adequate. Obviously, it is advisable to test this hypothesis in a larger number of popula-tions for it is likely that populapopula-tions` differences may reveal important interactions.
One advantage of our study was that we ob-tained information about the number of licensed drivers by age and sex. This made it possible to compare men and women regarding the level of exposure to traffic as drivers and to create an
indicator of traffic deaths placing the number of licensed drivers in the denominator.
Implications for public policies
There are important differences related to the risk of dying and killing in traffic, mainly by sex. Therefore, it may be appropriate to treat these groups differently, especially in societies where
machismo is strong23,33. Preventive strategies
to reduce deaths in traffic should contemplate, mainly, universal measures directed towards the
whole population34,35, such as to reduce the
lev-el of corruption in traffic29 and of impunity in
general36-38, but also, measures directed at specific
groups, where risk is increased. Some ideas are the following:
- Training, using cognitive-behavioral tech-niques, to enable men to avoid aggressive and reckless behavior in traffic, derived from situa-tions in which they take as insults to their mascu-linity and honor or as opportunities for maleness
exhibitionism39. Obviously, before instituting
this kind of training it is necessary to carry out interventional cost-effectiveness studies;
- Monitoring men’s traffic history to apply restrictive sanctions to those who have danger-ously broken traffic laws, such as speeding, risky overtaking and tailgating;
- Informing men and women about the risk they take exposing themselves in motorcycles in societies where traffic is highly dangerous, as it was the case in Rio de Janeiro in this study.
Obviously, these are exploratory ideas aiming at initiating a debate and not ready to take pre-scriptions.
Conclusion
Our central argument is that drivers and aspiring drivers of the male sex compose a special group, whom society should treat differently in order to cease traffic deaths from being a routine and be-come sporadic in Brazil and in other countries with similar or higher traffic death rates. Society should have an especially vigilant attitude to-wards men on the wheel in these countries.
aúd
e C
ole
tiv
a,
21(12):3691-3702,
2016
References
World Health Organization (WHO). Global Status Re-port on Road Safety: supRe-porting a decade of action. Lux-embourg: WHO; 2013.
Martin JL, Lafont S, Chiron M, Gadegbeku B, Laumon B. Differences between males and females in traffic accident risk in France. Rev Epidemiol Sante Publique
2004; 52(4):357-367.
Bouaoun L, Haddak MM, Amoros E. Road crash fatal-ity rates in France: A comparison of road user types, taking account of travel practices. Accid Anal Prev 2015; 75:217-225.
Evans L. The dominant role of driver behavior in traffic safety. Am J Public Health 1996; 86(6):784-786. Petridou E, Moustaki M. Human factors in the causation of road traffic crashes. Eur J Epidemiol 2000; 16(9):819-826.
Koizumi MS, Leyton V, Carvalho DG, Coelho CA, Mel-lo Jorge MHP, Gianvecchio V, Gawryzewski VP, Godoy CD, Sinagawa DM, Araújo GL, Muñoz DR. Alcoolemia e mortalidade por acidentes de trânsito no Município de São Paulo, 2007/2008. Revista ABRAMET 2010; 28(1):25-34.
Ramstedt M. Alcohol and fatal accidents in the United States - A time series analysis for 1950-2002. Accid Anal Prev 2008; 40(4):1273-1281.
World Health Organization (WHO). World report on road traffic injury prevention. Geneva: WHO; 2004. World Health Organization (WHO). Global status re-port on road safety 2013: supre-porting a decade of action.
Geneva: WHO; 2013.
Saldanha RF, Pechansky F, Benzano D, Barros CASM, Boni RB. Differences between attendance in emergen-cy care of male and female victims of traffic accidents in Porto Alegre, Rio Grande do Sul State, Brazil. Cien Saude Colet 2014; 19(9):3925-3929.
Aarts L, van Schagen I. Driving speed and the risk of road crashes: A review. Accid Anal Prev 2006; 38(2):215-224.
Chris G, Rebecca S, Phil E, Judith G, Ben A, Paul W. Effect of 20 mph traffic speed zones on road injuries in London, 1986-2006: controlled interrupted time series analysis. BMJ 2009; 339:b4469.
World Health Organization (WHO). Global status re-port on road safety: time for action. Geneva: WHO; 2009.
Dinh-Zarr TB, Sleet DA, Shults RA, Zaza S, Elder RW, Nichols JL, Thompson RS, Sosin DM. Task Force on Community Preventive Services. Reviews of evidence regarding interventions to increase the use of safety belts. Am J Prev Med 2001; 21(Supl. 4):48-65.
Andrade SM, Jorge M. Victims’ characteristics by road accidents in a city of Southern Brazil. Rev Saude Publica
2000; 34(2):149-156.
Ho R, Gee RY. Young men driving dangerously: De-velopment of the Motives for Dangerous Driving Scale (MDDS). Australian Journal of Psychology 2008; 60(2):91-100.
Brasil. Ministério da Saúde (MS). Mortalidade por aci-dentes de transporte terrestre no Brasil. Brasília: MS; 2007.
Tavris DR, Kuhn EM, Layde PM. Age and gender pat-terns in motor vehicle crash injuries: importance of type of crash and occupant role. Accid Anal Prev 2001; 33(2):167-172.
1.
2.
3.
4. 5.
6.
7.
8. 9.
10.
11.
12.
13.
14.
15.
16.
17.
18. Collaborations
M
ed
eir
os
ALS,
N
adano
Vasconcellos E. Urban development and traffic acci-dents in Brazil. Accid Anal Prev 1999; 31(4):319-328. Massie DL, Campbell KL, Williams AF. Traffic accident involvement rates by driver age and gender. Accid Anal Prev 1995; 27(1):73-87.
Massie DL, Green PE, Campbell KL. Crash involve-ment rates by driver gender and the role of average annual mileage. Accid Anal Prev 1997; 29(5):675-685. Jones D. Evolutionary Psychology. Annual Review of Anthropology 1999; 28:553-575.
Wilson M, Daly M. Competitiveness, risk-taking, and violence - The young male syndrome. Ethology and So-ciobiology 1985; 6(1):59-73.
Baker Junior MD, Maner JK. Risk-taking as a situa-tionally sensitive male mating strategy. Evolution and Human Behavior 2008; 29(6):391-395.
Byrnes J, Miller D, Schafer W. Gender Differences in Risk Taking: A Meta-Analysis. Psychol Bull 1999; 125(3):367-383.
Daly M, Wilson M. Killing the competition. Human Nature 1990; 1(1):81-107.
Bell NJ, Bell RW. Adolescent risk taking. Newbury Park, CA: Sage; 1993.
Gove W. The effect of age and gender on deviant be-haviour: A biopsychosocial perspective. New York: Al-dine; 1985.
Vanderbilt T. Traffic: why we drive the way we do (and what it says about us). New York: Vintage Books; 2008. Zahavi A. Mate selection – a selection for a handicap. J Theor Biol 1975; 53(1):205-214.
Harrant V, Vaillant NG. Are women less risk averse than men? The effect of impending death on risk-tak-ing behavior. Evolution and Human Behavior 2008; 29(6):396-401.
Voyer D, Voyer S, Bryden MP. Magnitude of Sex Dif-ferences in Spatial Abilities: A Meta-Analysis and Consideration of Critical Variables. Psychol Bull 1995; 117(2):250-270.
Daly M, Wilson M. Darwinism and the roots of ma-chismo. Sci Am 1999; 10:8-14.
19. 20.
21.
22. 23.
24.
25.
26. 27. 28.
29. 30. 31.
32.
33.
Staton C, Vissoci J, Gong E, Toomey N, Wafula R, Ab-delgadir J, Zhou Y, Liu C, Pei F, Zick B, Ratliff C, Rotich C, Jadue N, Andrade L, Isenburg M, Hocker M. Road Traffic Injury Prevention Initiatives: A Systematic Re-view and Metasummary of Effectiveness in Low and Middle Income Countries. Plos One 2016; 11:1-15 e0144971.
Maffei de Andrade S, Soares DA, Matsuo T, Barrancos Liberatti CL, Hiromi Iwakura ML. Road injury-relat-ed mortality in a minjury-relat-edium-sizinjury-relat-ed Brazilian city after some preventive interventions. Traffic Inj Prev 2008; 9(5):450-455.
Castillo-Manzano J, Castro-Nuño M, Fageda X. Are traffic violators criminals? Searching for answers in the experiences of European countries. Transport Policy
2015; 38:86-94.
Nadanovsky P, Celeste RK, Wilson M, Daly M. Homi-cide and impunity: an ecological analysis at state level in Brazil. Rev Saude Publica 2009; 43(5):733-742. Nadanovsky P, Cunha-Cruz J. The relative contribution of income inequality and imprisonment to the varia-tion in homicide rates among Developed (OECD), South and Central American Countries. Soc Sci Med
2009; 69(9):1343-1350.
Cohen D, Nisbett RE, Bowdle BF, Schwarz N. Insult, Aggression, and the Southern Culture of Honor: An “Experimental Ethnography”. J Pers Soc Psychol 1996; 70(5):945-960.
Artigo apresentado em 29/10/2015 Aprovado em 15/04/2016
Versão final apresentada em 17/04/2016 34.
35.
36.
37.
38.