FREE THEMES
1 Curso de Nutrição, Universidade Federal do Rio de Janeiro (UFRJ)- Campus UFRJ Macaé. R. Professor Aloisio Teixeira Gomes da Silva 50, Granja dos Cavaleiros. 27930-560 Macaé RJ Brasil. jcscapelli@gmail.com 2 Departamento de Epidemiologia e Métodos Quantitativos em Saúde, Escola Nacional de Saúde Pública, Fundação Oswaldo Cruz. Rio de Janeiro RJ Brasil.
3 Faculdade de Nutrição, Centro de Ciências Médicas, Universidade Federal Fluminense. Niterói RJ Brasil.
4 Curso de Enfermagem e Obstetrícia, UFRJ. Macaé RJ Brasil.
Situation of the supplementary diet of children
between 6 and 24 months attended in the Primary Care
Network of Macaé, RJ, Brazil
Abstract This study aimed to analyze the sup-plementary nutritional situation of children aged 6-24 months attended by the Primary Care unit of Macaé/RJ. It was conducted as a cross-section-al study, and data was obtained from the SISVAN Web website, including and analyzing all of the records (n=218) of children between 6-24 months in the year 2013. In infants between 6-12 months, the consumption of 72.3% of vegetables, 75.3% of fruits, and 63.4% of meats was detected, consid-ered indicators of healthy supplementary nutri-tion. In contrast, 23.8% were already consuming sugar-based food sources (honey, molasses, simple sugar, and unrefined cane sugar), 34.7% indus-trialized juice, and 17.8% soft drinks. The con-sumption of industrialized juice was significantly greater in boys (p-value <0.001). In children be-tween 12-18 months, 77.6% consumed vegetables, 77.4% fruits, and 86.3% meats. The consumption of sugar-based foods was 31%, 58.6% for indus-trialized juices, and 50% for soft drinks. Between 18-24 months, it was recorded that 89.9% of children consumed vegetables, 83.1% fruits, and 96.7% meat. The consumption of sugar-based foods was 33.9%, 69.5% for industrialized juic-es, and 55.5% for soft drinks. We conclude that the indicators of healthy complementary nutri-tion come close to the target set by the Ministry of Health (80%).
Key words Child health, infants, complementary nutrition
Leticia Maia Forte Marinho 1 Jane de Carlos Santana Capelli 1 Camilla Medeiros Macedo da Rocha 1 Alice Bouskela 1
M
ar
inho LMF
Introduction
Healthy nutritional practices in the first two years of a human being’s lifehave a positive impact on their nutritional status and their survival, favoring their full growth potential and
development, as well as their adult life1.
In the first six months of the life of an infant, exclusive breastfeeding is recommended, followed
by the introduction of adequate and suitable2,3
complementary nutrition, as this will satisfy their nutritional needs; prevent the appearance of illnesses; help with psychological, motor, and cognitive aspects of development; and enable the progressive acquisition of nutritional habits
in the family4-9. In this phase, the infant will
enter a new cycle in which new flavors, colors, aromas, textures, and knowledge are presented
that were previously unknown10. Thus, we refer
to supplementary nutrition as the nutrition in the period in which other foods – solid, semi-solid, or liquid – are offered to the child in
addition to breastmilk11. In this phase, it falls to
the health professional to translate the concepts of supplemental nutrition in a practical way for the community that they assist, remembering that family members and other caretakers of the child come to interact more with the infant in
contributing to their adequate nutrition3,4,10,12.
The type of supplemental nutrition introduced in early childhood not only influences the current nutritional status of the child, but
also their nutritional preferences as an adult10-12.
Because of this, it is perfectly acceptable that the increase in the consumption of vegetables and fruits in an early stage of life can lead to the maintenance of this habit, contributing in the future to the control of weight and the prevention of chronic non-communicable diseases (NCDs), such as high blood pressure
and diabetes mellitus13-17.
In analyzing the situation of supplementary nutrition in Brazil in the period between
1999 and 2008, the 2nd Research Project on the
Prevalence of Breastfeeding in the Brazilian Capitals and Federal District indicated the early introduction of water, tea, and other milk – with 13.8%, 15.3%, and 17.8% of children receiving these liquids, respectively, in the first month of life. The research also found that slightly more than one fifth of children between 3 and 6 months already had eaten salty food (20.7%) and nearly a fourth had received fruits (24.4%). On
the other hand, 26.8% of children between 6 and 9 months, the period in which the introduction of solid/semi-solid foods is recommended, did not have salty food. In this same age group, 69.8% of children had consumed fruit at some point, and 70.9% vegetables. In relation to the indicators of unhealthy food, the research found an elevated consumption of coffee (8.7%), of soft drinks (11.6%), and especially of cookies and chips (71.7%) among children between 9 and 12
months18.
Given this situation, in 2010 the Ministry of Health launched the National Plan for Healthy Supplementary Nutrition (ENPACS), which was incorporated into the Brazilian Nursing and Feeding Plan in 2012 as a way to guide and train health professionals, aiming to strengthen actions geared to the incentivizing and promoting of adequate and suitable supplementary nutrition for children younger than 24 months in the Primary Care Network, and consequently in the formation of nutritional habits from the
beginning of life4.
There are few studies on supplementary nutrition in the country, and there are no studies on the theme specifically in the municipality of Macaé. The Coordinating Committee in the Technical Area of Food and Nutrition – Catan/SemusaMacaé is responsible for SISVAN(Food and Nutrition Surveillance System) in the Healthcare Network, collecting continuously since 2012 monthly data about the food consumption and nutritional intake of the population in all the phases of life, with a reach of 36% of the serviced population. It is also responsible for furnishing data to SISVAN Web. In 2013, Catan carried out a nutritional survey for children under 60 months, seeking to broaden the knowledge about food consumption and nutritional intake of the infantile public living in Macaé. This survey took place during the Second Annual Vaccination Campaign, since there is a nearly universal demand from mothers and children at the vaccination posts, with a
reach of close to 90%13,14. The data obtained in
the nutritional survey was made available with restricted access on the website of the Ministry of Health/SAS/DAB/CGAN/SISVAN Web.
aúd
e C
ole
tiv
a,
21(3):977-986,
2016
Case Reports and Methods
A cross-sectional, descriptive, quantitative and secondary-source study was carried out with the restricted-access database available on the
website19. The database of SISVANWeb relevant
to the year 2013 furnished reports on the studied population, consisting of all of the records of children aged 6-24 months cared for in the Basic Healthcare Network of the municipality of Macaé, and is included in the analysis.
The variables selected from the demographic data were: sex (male and female) and age group (6-12 months; 12-18 months; 18-24 months). The variables of the markers of healthy diet were: consumption of vegetables, fruit, and meat; and the markers of unhealthy diet were: consumption of sugar-based foods (honey, molasses, simple sugar, and unrefined whole cane sugar), industrialized juice, and soft drinks.
For the purposes of analysis of a healthy supplemental diet, the following indicators, as
defined by ENPACS4, were utilized:
- Indicator 1: percentage of children aged 6-24 months that have consumed vegetables on the day before the registry.
- Indicator 2: percentage of children aged 6-24 months that have consumed fruit on the day before the registry.
- Indicator 3: percentage of children aged 6-24 months that have consumed meat on the day before the registry.
The target set by the Ministry of Health is that the prevalence of indicators of a healthy diet (vegetables, fruit, and meat) on the day before the registry, in children younger than 24 months
and according to sex and age group, would be
equal or superior to 80%4.
The descriptive analysis of the distribution of markers of healthy and unhealthy diets according to co-variables of the study was conducted by way of frequency distributions and the application ofChi-square and Fisher’s exact statistical tests for the comparison of the occurrence of the phenomenon between different groups. The data was presented in the form of a table and graphs. The computational program SPSS 20.0 was used in the statistical analysis, and a 5% level of significance was considered in all of them. The analysis and dissemination of the data was authorized by the management of the Coordinating Committee in the Technical Area of Food and Nutrition / Municipal Secretary of Health of Macaé /RJ. The Research Ethics Committee of the Medical School of Campos dos Goytacazes approved the present study.
Results
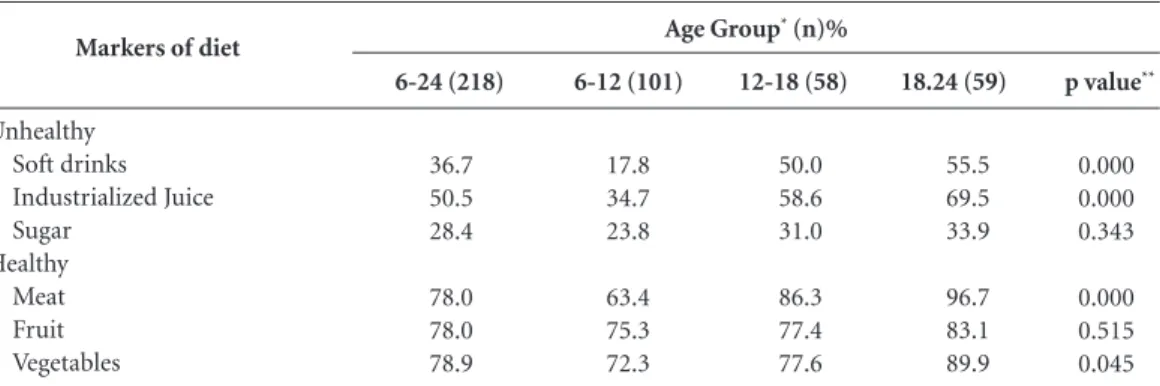
Information on 218 children between 6-24 months was analyzed, with the majority of them (50.4%) being male. According to the indicators of a healthy supplementary diet of the previous day, it was found that 78.9% (n = 172) of children aged 6-24 months consumed vegetables; 78% (n = 170) consumed fruit; and 78% (n = 170) consumed meat. These findings are close to the target recommended by ENPACS (80%).
Table 1 shows the markers of healthy and unhealthy diet, according to age group, of children cared for in the Basic Healthcare Network of the
p value**
0.000 0.000 0.343
0.000 0.515 0.045 Markers of diet
Unhealthy Soft drinks Industrialized Juice Sugar
Healthy Meat Fruit Vegetables
Table 1. Markers of unhealthy and healthy diet, according to age group, of children between 6-24 months (n=218), attended at the Primary Care Network of Macaé. Ministry of Health/SAS/DAB/CGAN/Sisvan Web, 2013.
6-12 (101)
17.8 34.7 23.8
63.4 75.3 72.3 6-24 (218)
36.7 50.5 28.4
78.0 78.0 78.9
12-18 (58)
50.0 58.6 31.0
86.3 77.4 77.6
18.24 (59)
55.5 69.5 33.9
96.7 83.1 89.9
* Age group of infants who formed the sample, expressed in months of life. ** P-value of the Chi-square test for the comparison of consumption prevalence between the three age groups (6-12 months, 12-18 months, and 18-24 months).
M
ar
inho LMF
municipality of Macaé. It was found that, between 6-12 months, children presented percentages for consumption of meat, vegetables, and fruit varying between 63.4% and 75.3%. In contrast, the percentage of consumption of soft drinks, sugar-based foods, and industrialized juice varied between 17.8% and 34.7%. In the age group of 12-18 months, it was found that percentages for the consumption of fruits, vegetables, and meats varied from 77.4% to 86.3%; while sugar-based foods, soft drinks, and industrialized juice showed percentages varying between 31% and 58.6%. Between 18-24 months, the percentage of consumption of fruits, vegetables, and meat varied from 83.1% to 96.7%; and the percentage for the consumption of sugar-based foods, soft drinks, and industrialized juice varied between 33.9% and 69.5%.
For the markers of a healthy diet, it was found that the prevalence of meat consumption was significantly higher in children between 18-24 months (p value = 0.000), as well as consumption of vegetables (p value = 0.045). In relation to the markers of unhealthy diet, it was verified that the consumption of the three categories is begun very early in the age group of 6-12 months, with growing prevalence until the age group of 18-24 months, having a statistically significant
increase for soft drinks (p value = 0.000) and industrialized juice (p value = 0.000) (Table 1).
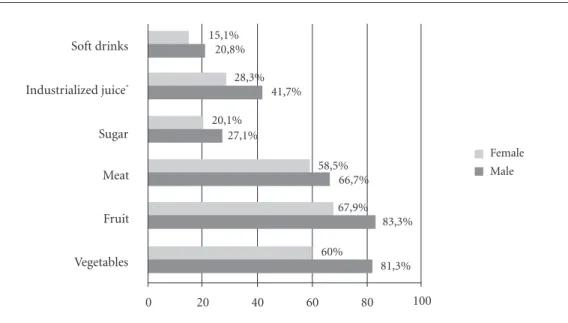
According to sex and age group, it was found there was elevated consumption of all of the supplementary foods in male children between 6-12 months, with markers of healthy diet varying between 66.7% and 83.3%, with emphasis on the consumption of fruits and vegetables. The markers of unhealthy diet varied between 20.1% and 43.7%, with emphasis on the consumption of industrialized juice, which was significantly greater in boys (41.7% versus 28.3%, p value < 0.001) (Figure 1).
In the age group between 12-18 months, this situation becomes inverted according to sex, finding elevated percentages for supplemental foods in female children, with the markers for healthy diet presenting values above 80%, with emphasis on the consumption of fruits (96.4%); and the markers of unhealthy diet varying between 28.6% and 60.7%, with emphasis on the consumption of soft drinks and industrialized juice. Sugar-based foods had the least percentage (28.6%) when compared to male children (33.3%) (Figure 2).
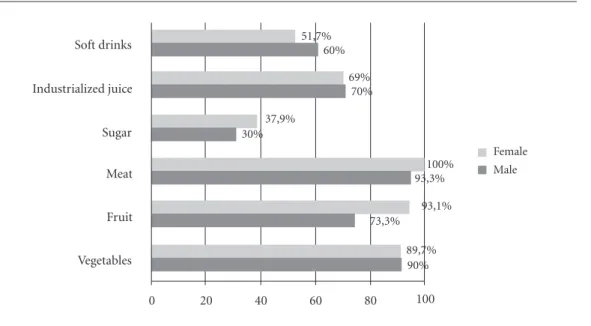
Analyzing the age group between 18-24 months, elevated percentages were found for the consumption of supplemental foods in
Figure 1. Markers of healthy and unhealthy diet, according to sex, of infants between 6-12 months (n = 101), attended at the Primary Care unit of Macaé. Ministry of Health/SAS/DAB/CGAN/Sisvan Web, 2013.
* p-value<0.001 in the Chi-square test for comparison of prevalence between sexes. Soft drinks
Industrialized juice*
Sugar
Meat
Fruit
Vegetables
Female Male
0 20 40 60 80 100
15,1% 20,8%
28,3% 41,7% 20,1%
27,1%
58,5% 66,7%
67,9% 83,3% 60%
aúd
e C
ole
tiv
a,
21(3):977-986,
2016
both sexes. The consumption of foods that are markers of a healthy diet was elevated, however, in male children, and fruits represented the least percentage in this age group (73.3%). Regarding the consumption of foods that are
markers of an unhealthy diet, percentages above 50% were found for the consumption of soft drinks and industrialized juice. Nevertheless, the consumption of sugar-based foods was close to 40% in female children, which is also elevated (Figure 3).
Figure 2. Markers of healthy and unhealthy diet, according to sex, of infants between 12-18 months (n=58), attended at the Primary Care unit of Macaé. Ministry of Health/SAS/DAB/CGAN/Sisvan Web, 2013.
Soft drinks
Industrialized juice
Sugar
Meat
Fruit
Vegetables
Female Male
0 20 40 60 80 100
60,7% 40,8%
60,7% 56,7% 28,6%
33,3%
96,4% 76,7%
85,7% 70%
82,1% 73,3%
Figura 3. Markers of healthy and unhealthy diet, according to sex, of infants between 18-24 months (n=59), attended at the Primary Care unit of Macaé. Ministry of Health/SAS/DAB/CGAN/Sisvan Web, 2013.
Soft drinks
Industrialized juice
Sugar
Meat
Fruit
Vegetables
Female Male
0 20 40 60 80 100
51,7% 60%
69% 70% 37,9%
30%
100% 93,3%
93,1% 73,3%
M
ar
inho LMF
Discussion
In the present study, the consumption of markers of a healthy diet in the evaluated population presented a prevalence close to that considered ideal by ENPACS, or rather, of at least 80%. In contrast, the introduction of markers of an unhealthy diet were shown early and growing according to age group (Table 1).
The introduction of foods considered markers of an unhealthy diet signaled the inadequate introduction of a supplementary diet to infants, as well as the adoption of at-risk behavior for the appearance of iron deficiency, development of excess weight, obesity, dyslipidemia, and alteration of blood
pressure10,20. It is known that food consumption
during early childhood is intimately associated with the health and nutrition profile, especially among children younger than two years of age. Or rather, inadequate food practices in the first two years of life, above all among disadvantaged populations, is intimately associated with an increase in morbidity, represented by infectious diseases, malnutrition, and the lack of specific micronutrients, particularly of iron, zinc, and
vitamin A21.
Garcia et al.22, studying 165 children aged
6-24 months in the Western Brazilian Amazon region, encountered a lower consumption of fruits, vegetables, and meats with an excessive consumption of cow’s milk and porridge, which resulted in the prevalence of 12% for height/age deficit and of 40% for anemia. The authors also encountered 20% of children aged 6 to 8 months were feeding exclusively on liquids.
In general, in our study we observed both an increase in the consumption of healthy foods (meat, fruit, vegetables) as well as unhealthy foods (sugar, soft drinks, industrialized juices) with the advance of age in both sexes. In children aged 6-12 months, as well as in the other age groups, industrialized juice was the food that stood out the most among the other markers of an unhealthy diet (Table 1) and presented a statistically significant difference between the sexes (p < 0.001). It is important to emphasize that industrialized juices, also known as artificial juices, should be excluded from a children’s diet for their elevated quantity of sugars, artificial flavors and colorings, presenting allergenic potential, contributing to excess weight as well as
the risk of tooth decay10.
Our data is similar to that found by Parada
et al.23 with children younger than 1 year in
Botucatu/SP, in which they verified that the supply of supplementary foods such as meat and beans increased with age. The contribution of the health professional in the promotion of a healthy children’s diet is extremely important to the successful development of healthy habits
in the first year of life. Vitolo et al.24 point to
the positive impact in the quality of childhood nutrition in Porto Alegre (RS) by way of the training of health professionals on the practices of supplemental nutrition. There was a greater prevalence of infants who received fruit, meat, and liver with adequate frequency in the health intervention units, which reflects one of the priorities of the recommended nutritional practices in the national guidelines for children younger than two years, with the supply of iron
of high bioavailability25.
The nutritional Guide for children younger than two years is a publication developed and recommended by the Ministry of Health and the Pan-American Health Organization (PAHO) for dissemination to the population and for the use of professionals in the children’s primary care network; this guide reinforces the importance of exclusive breastfeeding and the introduction of an adequate, healthy, and suitable supplementary diet that guaranties nutritional security. The Guide recommends the “Ten steps for a healthy diet for children younger than two years,” with the goal of guiding content and messages to be passed on mainly to mothers, women of reproductive age, pregnant women and nursing mothers, and caretakers/family members. Nevertheless, there is still much to invest in and incentivize in the field of childhood diet and nutrition, principally owing to the elevated consumption of foods rich in sugar, fat, and salt, such as industrialized juice, soft drinks, starchy foods, cookies, and salty
snacks, among others26.
Our study has revealed the early and inopportune introduction of sugar-based foods (honey, molasses, simple sugar, and unrefined whole cane sugar), soft drinks, and industrialized juice to the diet of the children being studied. The literature has already established the early introduction of unhealthy foods as a risk factor for the reduction in the duration and frequency of breastfeeding and predisposition for obesity
and development of NCDs in adult life27.
We found that the consumption of foods that are markers of a healthy diet in children older than 6 months was greater than in other studies
carried out in cities such as Acrelândia/AC22, Belo
aúd
e C
ole
tiv
a,
21(3):977-986,
2016
and Salvador/BA30. Palmeira et al.31 carried out
research in approximately 660 municipalities in the state of Paraíba and obtained results similar
to those observed in Salvador/BA30. In relation to
the markers of an unhealthy diet, Longo-Silva et
al.32, studying 636 children cared for in the public
daycare centers of São Paulo, verified that soft drinks were consumed before the first full year of life by more than half (53.8%) of the children studied, and that industrialized juice was consumed by almost two thirds of them (62.9%). The consumption of soft drinks (36.7%) and industrialized juice (50.5%) by children in Macaé was less than what was observed in the cities cited above, but the data is also worrisome. It is known that socioeconomic conditions and area of residence are factors that influence food consumption and nutritional intake of adults and, as a result, of children. The study carried out
by Kitoko et al.33 in the cities of João Pessoa/PB
and Florianópolis/SC, showed that 59.5% and 83.5%, respectively, of children between 6 and 9 months receiving supplementary nutrition were consuming beans and meat. When we compare our results to the studies developed in cities in
the southeast region – Belo Horizonte/MG28 and
São Bernarndo do Campo/SP29 – we verified that
the prevalence of supplementary nutrition in the municipality of Macaé/RJ was that which came closest to the target of ENPACS.
The better results found for the Municipality of Macaé in our study, when compared to those of other Brazilian cities, are due to the strong investment by the management of the Coordinator of the Technical Area of Diet and Nutrition – Catan/Municipal Health Secretary of Macaé, in actions geared toward educational activities in diet and nutrition for the health professionals, principally the community health agents, by way of training courses offered in partnership with the UFRJ campus and Macaé Professor Aloisio Teixeira. In addition, there are activities oriented to the community in general, such as the Traveling Nutrition project.Every month, this project brings themes linked to nutrition in the first year of life to the population in the town plazas and the Primary Care units. The annual staging of National Breastfeeding Week, taking place not only in the first week of August but during the entire month, also contributes to the good situation of the evaluated indicators.
The nutritional adequacy of supplementary foods is of fundamental importance in the prevention of morbimortality during early
childhood, including malnutrition and excess
weight2. The World Health Organization
(WHO) reveals that there have been important advances in the promotion of breastfeeding, yet unfortunately, adequate supplementary nutrition
has made less progress12. There remains much to
invest and incentivize in the field of childhood diet and nutrition, principally owing to the elevated consumption of foods rich in sugar, fat, and salt, such as industrialized juice, soft drinks, starchy foods, cookies, and salty snacks, among
others22,28-32.
For the Brazilian scenario, the study of
Bernardi et al.34 proposes that the early offer
of sweets and soft drinks, as well as the late introduction of fruits and vegetables in the childhood diet, associated with the increase of the maternal figure in the labor market, has a probable impact on the increase of obesity in the country.
Data from the Research on Household Budgets of 2008-2009 indicated that malnutrition in the first years of life, and excess weight and obesity at a more advanced age, constitute highly relevant problems for public health in Brazil. In childhood, malnutrition is concentrated in low-income families, principally in the North region. Beginning at 5 years of age, we more frequently encounter excess weight and obesity in all income
groups and regions throughout all of Brazil35.
In the area of policies and public programs oriented toward the nutrition of the infant, there are the actions of the Promotion of Healthy Eating (PAAS) program that must attend to the different phases of the life cycle. In this way, programs such as “Promotion of Breastfeeding,” which intersects with the Human Right to Adequate Nutrition (DHAA) and with the Food and Nutritional Security (SAN), as well as the “Brazilian Breastfeeding Network” and the “Friendly Breastfeeding Basic Unit Initiative” (IUBAAM), among innumerable others, increase the rates of maternal breastfeeding and decrease
early weaning36.
Regarding the incentive for the introduction of adequate and suitable complementary nutrition, the Ministry of Health, via the General Coordinator of Diet and Nutrition (CGAN); and in partnership with the International Network in Defense of the Right to Breastfeeding (IBAN Brazil) and PAHO/WHO, in 2010 proposed the
creation of ENPACS20.
M
ar
inho LMF
Plan for the Promotion of Breastfeeding and Healthy Supplemental Nutrition at SUS – Nurse and Nourish Brazil Plan,” whose objective is to qualify the work process of primary care professionals, and to reinforce and incentivize the promotion of breastfeeding and healthy nutrition oriented to children under two years
old, under the Unified Health System (SUS)37.
The Nurse and Nourish Brazil Plan is the result of an integration between the Brazil Breastfeeding Network and ENPACS, which came together to form this new strategy, having a commitment to
training experienced professionals38.
The present study has some limitations. The first is the bias of memory, in that during the process of data collection about food consumption with the children’s caretakers or those responsible, it is possible that some of these may have omitted details or not responded in a correct way. However, this bias is minimized owing to the questions that referred to the previous day (last 24 hours). For this reason, patience and care are needed in the application and utilization of the research instrument by the health professional in approaching the user. The form used in the study is the instrument recommended by the Ministry of Health, from the perspective of SISVAN, aiming to characterize the introduction of foods and adoption of risk behaviors for iron-deficiency anemia and the appearance of excess weight, permitting their early detection through markers of food consumption, while dividing these into
healthy and unhealthy39. However, it is worth
emphasizing that the instrument used in this study does not aim to quantify the diet, with its calories and nutrients, but to indicate the quality of nutrition and its characteristics, positive as
well as negative20.
Conclusion
Based on the results of this study, we observed a consumption of foods that are markers of a healthy supplemental diet close to the target proposed by the Ministry of Health. In spite of the relevant consumption of markers of unhealthy diet in children aged 6-24 months in the municipality of Macaé, this was found to be below that described for other studies. However, the consumption of these markers was shown to be increasing, from 6-12 months until 18-24 months in the life of the infant, which in the future may reach worrying figures in pre-school and school-aged children, pointing to a demand for more studies that clarify this trend.
aúd
e C
ole
tiv
a,
21(3):977-986,
2016
References
Guilherme JP, Nascimento MBR. O leite humano – Anatomia e fisiologia da lactação. In: Santiago LB, or-ganizador. Manual de Aleitamento Materno. Barueri: Manole; 2013. p. 1-19.
Monte CMG, Giugliani ERJ. Recomendações para ali-mentação complementar da criança em aleitamento materno. J. Pediatr 2004; 80(Supl. 5):s131-s141. Sociedade Brasileira de Pediatria (SBP). Manual de orientação para a alimentação do lactente, do pré-esco-lar, do escopré-esco-lar, do adolescente e na escola. 3a ed. Rio de Janeiro: SBP; 2012.
Brasil. Ministério da Saúde (MS). ENPACS: Estratégia Nacional Para Alimentação Complementar Saudável: Caderno Do Tutor. Brasília: MS; 2010.
Chaves RG. Por que amamentar exclusivamente até 6 meses e manter a amamentação até 2 anos ou mais? In: Santiago LB, organizador. Manual de Aleitamento Materno. Barueri: Manole; 2013. p. 21-30.
Correa EN, Corso ACT, Moreira EAM, Kazapi IAM. Alimentação complementar e características maternas de crianças menores de dois anos de idade em Floria-nópolis (SC). Rev Paul Pediatr 2009; 27(3):258-264. Marques ES, Cotta RMM, Priore SE. Mitos e crenças sobre o aleitamento materno. Cien Saude Colet 2011; 16(5):2461-2468.
Antunes LS, Antunes LAA, Corvino MPF, Maia LC. Amamentação natural como fonte de prevenção em saúde. Cien Saude Colet 2008; 13(1):103-109. Michaelsen KF. Breastfeeding. In: Koletzko B. Pediat-ric Nutrition in Practice. Switzerland: Karger; 2008. p. 85-89.
Brasil. Ministério da Saúde (MS). Secretaria de Aten-ção à Saúde. Departamento de AtenAten-ção Básica. Saúde da criança: nutrição infantil: aleitamento materno e ali-mentação complementar. Brasília: Editora do MS; 2009. World Health Organization (WHO). Complementa-ry feeding of young children in developing countries: a review of current scientific knowledge. Geneva: WHO, NUT; 1998.
World Health Organization (WHO). Global Strategy
for Infant and Young Child Feeding. Geneva: WHO,
UNICEF; 2003.
Coulthard H, Harris G, Emmett P. Delayed introduc-tion of lumpy foods to children during the comple-mentary feeding period affects child´s food acceptance and feeding at 7 years of age. Matern Child Nutr 2009; 5(1):75-85.
Skinner JD, Carruth BR, Wendy B, Ziegler PJ. Chil-dren’s food preferences: a longitudinal analysis. J Am Diet Assoc 2002; 102:1638-1646
Rolls BJ, Drewnowski A, Ledikwe JH. Changing the energy density of the diet as a strategy for weight man-agement. J Am Diet Assoc 2005; 105(5 Supl. 1):s98-s103. Dias MCA, Freire LMS, Franceschini SCC. Recomen-dações para alimentação complementar de crianças menores de dois anos. Rev. Nutr 2010; 23(3):475-486. World Health Organization (WHO). The optimal du-ration of exclusive breastfeeding: a systematic review.
Geneva: WHO; 2002. 1.
2.
3.
4.
5.
6.
7.
8.
9.
10.
11.
12.
13.
14.
15.
16.
17. Collaborators
LMF Marinho, JCS Capelli, CMM Rocha, A Bouskela, CN Carmo, SEAP Freitas, AS Anastácio, MFL Almeida, and JS Pontes contributed equally in all stages of the development of this article.
Acknowledgements
M
ar
inho LMF
Brasil. Ministério da Saúde (MS). Secretaria de Aten-ção a Saúde. Departamento de Ações Programáticas e Estratégicas. II Pesquisa de Prevalência de Aleitamento Materno nas Capitais Brasileiras e Distrito. Brasília: MS; 2009.
Brasil. Ministério da Saúde/SAS/DAB/CGAN/Sis-vanWEB. Dados do município de Macaé, Rio de Ja-neiro. [acessado 2015 fev 15]. Disponível em: http:// dabsistemas.saude.gov.br/sistemas/sisvan/relatorios_ publicos/relatorios.php
Brasil. Ministério da Saúde (MS). Secretaria de Atenção à Saúde. Departamento de Atenção Básica. Protocolos do Sistema de Vigilância Alimentar e Nutricional – SIS-VAN na assistência à saúde. Brasília: MS; 2008. O’Donnell A, Torun, B, Caballero B, Pantin EL, Bengoa JM. La Alimentación del niño menores de 6 años en Amé-rica Latina. Base para el desarrollo de Guias de Alimen-tación. Venezuela: Ediciones Cavendes; 1994.
Garcia MT, Granado FS, Cardoso MA. Alimentação complementar e estado nutricional de crianças me-nores de dois anos atendidas no Programa Saúde da Família em Acrelândia, Acre, Amazônia Ocidental Bra-sileira. Cad Saude Publica 2011; 27(2):305-316. Parada CMGL, Carvalhaes MABL, Jamas MT. Práticas de alimentação complementar em crianças no primei-ro ano de vida. Rev. Latino-Am. Enfermagem. 2007; 15(2):282-289.
Vitolo MR, Louzada MR, Rauber F, Grechi P, Gama CM. Impacto da atualização de profissionais de saúde sobre as práticas de amamentação e alimentação com-plementar. Cad Saude Publica 2014; 30(8):1695-1707. Institute of Medicine. Dietary Reference Intakes for Vi-tamin A, ViVi-tamin K, Arsenic, Boron, Chromium, Copper, Iodine, Iron, Manganese, Molybdenum, Nickel, Silicon,
Vanadium, and Zinc. National Academic Press. Food
and Nutrition Board. Washington: Institute of Medi-cine; 2001.
Brasil. Ministério da Saúde (MS). Secretaria de Polí-tica de Saúde. Organização Pan Americana da Saúde (OPAS). Guia alimentar para crianças menores de dois anos. Brasília: MS; 2002.
Brasil. Ministério da Saúde (MS). Política Nacional de Alimentação e Nutrição. Versão preliminar. Brasília: MS; 2012. Série B. Textos Básicos de Saúde.
Alves CRL, Santos LC, Goulart LMHF, Castro PR. Ali-mentação complementar em crianças no segundo ano de vida. Rev Paul Pediatr 2012; 30(4):499-506. Silva LMP, Venâncio SI, Marchioni DML. Práticas de alimentação complementar no primeiro ano de vida e fatores associados. Rev Nutr 2010; 23(6):983-992. Oliveira LPM, Assis AMO, Pinheiro SMC, Prado MS, Barreto, ML. Alimentação complementar nos primei-ros dois anos de vida. Rev Nutr 2005; 18(4):459-469. 18.
19.
20.
21.
22.
23.
24.
25.
26.
27.
28.
29.
30.
Palmeira PA, Santos SMC, Vianna RPT. Prática ali-mentar entre crianças menores de dois anos de idade residentes em municípios do semiárido do Estado da Paraíba, Brasil. Rev Nutr 2011;24(4):553-563. Longo-Silva G, Tolini MHA, Menezes RCE, Azakura L, Oliveira MAA, Taddei JAAC. Introdução de refrigeran-tes e sucos industrializados na dieta de lactenrefrigeran-tes que frequentam creches públicas. Rev Paul Pediatr 2015. [acessado 12 fev 2015]. Disponível em: http://dx.doi. org/10.1016/j.rpped.2014.06.009
Kitoko PM, Rea MF, Venâncio SI, Vasconcelos ACCP, Santos EKA, Monteiro CA. Situação do aleitamento materno em duas capitais brasileiras: uma análise com-parada. Cad Saude Publica 2000; 16(4):1111-1119. Bernardi, JLD, Jordão RE, Barros Filho, AA. Alimenta-ção complementar de lactentes em uma cidade desen-volvida no contexto de um país em desenvolvimento.
Rev Panam Salud Publica 2009; 26(5):405-411. Instituto Brasileiro de Geografia e Estatística (IBGE). Diretoria de Pesquisas Coordenação de Trabalho e Rendimento. Pesquisa de Orçamentos Familiares 2008-2009: Antropometria e Estado nutricional de Crianças, Adolescentes e Adultos no Brasil. Rio de Janeiro: IBGE; 2011.
Silva JP, Baião MR, Santos MS. Ações de alimentação e nutrição na Atenção Básica. In: Barros, DC, Silva DO, Santos MMAS, Baião MR, organizadoras. Alimentação e Nutrição: fundamentos para a prática em saúde coleti-va. Editora Fiocruz: Rio de Janeiro: EAD/ENSP; 2013. p.58-105.
Jaime PC, Silva ACF, Lima AMC, Bortolini GA. Ações de alimentação e nutrição na atenção básica: a experi-ência de organização no Governo Brasileiro. Rev Nutr
2011; 24(6):809-824.
Brasil. Ministério da Saúde (MS). Departamento de Atenção Básica. Estratégia amamenta e alimenta Brasil. [acessado 10 mar 2015). Disponível em: http://dab.sau-de.gov.br/portaldab/amamenta.
Santiago LB, Fernandez DF. Programas e políticas de saúde em favor do aleitamento materno. In: Santiago LB, organizador. Manual de Aleitamento Materno. Ba-rueri: Manole; 2013. p. 191-202.
Article submitted 21/04/2015 Accepted 22/07/2015
Final version submitted 24/07/2015 31.
32.
33.
34.
35.
36.
37.
38.