CLINICAL SCIENCE
Long-term stability of the oxygen pulse curve during
maximal exercise
Ricardo Branda˜o Oliveira,I Jonathan Myers,IIClaudio Gil Soares de Arau´joI,III
IGama Filho University - Exercise Physiology, Rio de Janeiro, Rio de Janeiro, Brazil.IIDivision of Cardiovascular Medicine, Stanford University and Veterans Affairs Palo Alto Health Care System, Palo Alto, USA.IIIClinimex – Clı´nica de Medicina do Exercı´cio, Rio de Janeiro, Brazil.
INTRODUCTION: Exercise oxygen pulse (O2 pulse), a surrogate for stroke volume and arteriovenous oxygen
difference, has emerged as an important variable obtained during cardiopulmonary exercise testing.
OBJECTIVES:We hypothesized that the O2pulse curve pattern response to a maximal cycling ramp protocol exhibits
a stable linear pattern in subjects reevaluated under the same clinical conditions.
METHODS:We retrospectively studied 100 adults (80 males), mean age at baseline of 59¡12 years, who performed two cardiopulmonary exercise testings (median interval was 15 months), for clinical and/or exercise prescription reasons. The relative O2pulse was calculated by dividing its absolute value by body weight. Subjects were classified
into quintiles of relative O2 pulse. Cardiopulmonary exercise testing results and the O2 pulse curve pattern,
expressed by its slope and intercept, were compared among quintiles of relative O2pulse at both cardiopulmonary
exercise testings.
RESULTS:After excluding the first minute of CPX (rest-exercise transition), the relative O2pulse curve exhibited a
linear increase, as demonstrated by high coefficients of determination (R2 from 0.75 to 0.90; p
,0.05 for all quintiles). Even though maximum oxygen uptake and relative O2pulse were significantly higher in the second
cardiopulmonary exercise testing for each quintile of relative O2pulse (p,0.05 for all comparisons), no differences
were found when slopes and intercepts were compared between the first and second cardiopulmonary exercise testings (p.0.05 for all comparisons; except for intercept in the 5thquintile).
CONCLUSION: Excluding the rest-exercise transition, the relative O2 pulse exhibited a stable linear increase
throughout maximal exercise in adults that were retested under same clinical conditions.
KEYWORDS: Stroke Volume; Coronary Artery Disease; Cardiopulmonary Exercise Testing, Heart Rate; Ramp Protocol.
Oliveira RB, Myers J, Arau´jo CGS. Long-term stability of the oxygen pulse curve during maximal exercise. Clinics. 2011;66(2):203-209.
Received for publication onOctober 13, 2010;First review completed onOctober 27, 2010;Accepted for publication onOctober 27, 2010 E-mail: [email protected]
Tel.: 55 21 2256-7183
INTRODUCTION
The stroke volume (SV) response to exercise is considered one of the most important indices of heart function.1 Unfor-tunately, its direct measurement during exercise requires intravascular catheterization, and therefore is rarely per-formed in the clinical setting. Consequently, several non-invasive methods to estimate exercise SV have been developed.2 Recently, attention has been given to the oxygen pulse (O2 pulse), a readily available variable
obtained during cardiopulmonary exercise testing (CPX), calculated by the ratio of oxygen uptake (VO2) and heart
rate (HR). The O2 pulse has been demonstrated to be a
powerful predictor of mortality in patients with cardiovas-cular diseases3,4and it has been associated to the onset of exercise-induced ischemia.5,6Although clinically useful, the
O2 pulse is not a simple variable to consider, since it is
influenced by many factors that can confound its inter-pretation, including the presence of diastolic dysfunction,7 valvular regurgitation,8fitness level (athletes may exhibit a plateau in oxygen pulse at higher levels of exercise, likely reflecting a physiological limitation of SV at the upper limits of HR),9testing protocol10and body dimensions.11
Rearranging the terms in the modified Fick equation, we have; VO2/HR = (CO6CaO2)/HR – (CO6CvO2)/HR,
where CO is cardiac output and CaO2 and CvO2 are the
arterial and mixed venous O2contents, respectively. Whipp
et al.11postulated that O2pulse, when plotted as a function
of 1/HR, results in a linear relationship that extrapolates to the asymptotic O2pulse. In other words, during progressive
exercise, when VO2changes as a linear function of HR, the
O2pulse equals the slope of the VO2-HR relationship. This
Copyrightß2011CLINICS– This is an Open Access article distributed under
relationship only holds true however, if it is assumed that the product of CO and CvO2is constant during steady-state
work rates as seen in graded exercise testing protocols (e.g.: Bruce protocol) and also that CaO2 is normally constant
during exercise. To our knowledge, the O2 pulse curve
pattern during the now-commonly used non-steady-state (ramp protocol) incremental exercise test has not been well described.
In addition, since SV is directly influenced by body dimensions12,13and O2pulse is related to the SV response to
exercise, adjustments for body dimensions or weight should be included in studies aiming to evaluate the O2 pulse
response to exercise. If only maximal values are considered, overweight or obese subjects would have a superior O2
pulse response, which is likely misleading considering the higher prevalence of cardiovascular disease in this parti-cular group. This aspect has been an important limitation of both clinical6,14and physiological studies15,16 and requires further exploration.
In the present study, we tested the hypothesis that O2
pulse corrected for body weight (hereafter termed relative O2 pulse) in response to non-steady-state incremental
exercise testing demonstrates a linear pattern in a well controlled data set of subjects referred for exercise testing at our institution. In addition, we tested the hypothesis that the relative O2 pulse curve pattern during progressive
exercise, expressed by its slope and intercept, remains stable during serial testing under the same clinical conditions and similar drug regimens.
MATERIALS AND METHODS
Study Population
We retrospectively studied a sample consisting of 502 adult non-athletes referred, at least twice, for exercise testing for clinical and/or exercise pre-participation reasons at our clinic from January 02, 2001 to October 31 2009. The study was designed to conform to the Declaration of Helsinki and approved by the Institutional Ethics Com-mittee. Inclusion criteria consisted of patients who: a) performed two maximal cycling ramp protocol CPX at least 3 months apart; b) did not change clinical status and regular
use of medications that might have affected the cardiovas-cular response to exercise (such as beta-blockers) at both CPXs. Subjects with valvular heart disease, lung disease, anemia and those who exhibited O2desaturation (more than
4% at maximal effort) during exercise were excluded from the study. In addition, all CPXs stopped early for clinical indications were not considered maximal and were excluded. After applying all inclusion and exclusion criteria, 100 subjects were considered for final analyses (80 men), of whom 50% had coronary artery disease. Baseline clinical characteristics are shown in Table 1. After undergoing the first CPX, 75% of the subjects attended a supervised exercise program at our clinic at least three times a week, while the remaining 25% received advice regarding exercise.
Cardiopulmonary Exercise Testing (CPX)
After providing written informed consent, all subjects underwent a symptom-limited CPX using an electronically-braked cycle ergometer (EC-1600; Cat Eye;, Japan or CG-04, Inbrasport, Brazil), according to an individualized ramp protocol designed to allow patients to reach maximum exercise within the desirable range of 8 to 12 minutes.17,18 The patients were verbally encouraged to exercise to volitional fatigue, regardless the maximal HR attained. No medications were stopped before the CPX. The electro-cardiogram (ECG) (Cardiolife TEC 7100; Nihon-Kohden, Japan; or Elite Ergo PC 3.2.1.5; Micromed, Brazil) was continuously monitored via a single lead (CC5 or CM5). Ventilatory expired gas analysis was obtained by a meta-bolic system (VO2000; MedGraphics, US). The air flow and oxygen and carbon dioxide sensors were calibrated before each test using 2-liter syringes and gases with known volumes of oxygen, nitrogen, and carbon dioxide concen-trations. No test results were classified as indeterminate. All exercise tests were performed, analyzed and reported according to a standardized protocol by a single experi-enced physician.
Hemodynamic and Ventilatory Assessments
The HR was analyzed beat-by-beat and expressed every 10-s. Maximum HR was considered as the highest 10-s average obtained during the CPX. The age-predicted
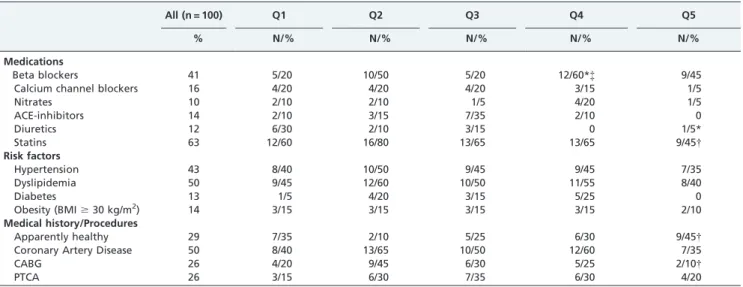
Table 1 -Baseline clinical characteristics by quintiles of maximum relative O2pulse.
All (n = 100) Q1 Q2 Q3 Q4 Q5
% N/% N/% N/% N/% N/%
Medications
Beta blockers 41 5/20 10/50 5/20 12/60*{ 9/45
Calcium channel blockers 16 4/20 4/20 4/20 3/15 1/5
Nitrates 10 2/10 2/10 1/5 4/20 1/5
ACE-inhibitors 14 2/10 3/15 7/35 2/10 0
Diuretics 12 6/30 2/10 3/15 0 1/5*
Statins 63 12/60 16/80 13/65 13/65 9/45{
Risk factors
Hypertension 43 8/40 10/50 9/45 9/45 7/35
Dyslipidemia 50 9/45 12/60 10/50 11/55 8/40
Diabetes 13 1/5 4/20 3/15 5/25 0
Obesity (BMI$30 kg/m2) 14 3/15 3/15 3/15 3/15 2/10
Medical history/Procedures
Apparently healthy 29 7/35 2/10 5/25 6/30 9/45{
Coronary Artery Disease 50 8/40 13/65 10/50 12/60 7/35
CABG 26 4/20 9/45 6/30 5/25 2/10{
PTCA 26 3/15 6/30 7/35 6/30 4/20
maximum HR was also calculated by the equation [210-(0.65
6age)]. 19 Expired ventilatory data were analyzed and
expressed at each 10-s. Maximum VO2 (VO2max) was
expressed as the highest 60-s average value obtained during the CPX. The age-predicted VO2max was also calculated
according to standard equations. 19 Delta VO
2/workload
was calculated as: VO2max – resting VO2 divided by
maximum workload and expressed in mL.min-1.watts-1.
For practical purposes, the resting VO2while sitting on the
cycle ergometer was considered to be 3.5 mL.kg-1.min-1for all subjects. O2pulse was calculated by dividing VO2by HR
obtained every 10-s during CPX. Maximum O2 pulse was
expressed as the highest 60-s average value and was expressed in milliliters per beat. In addition, this value was expressed as a percentage of age-predicted achieved, which corresponds to the ratio between the predicted values for maximum VO2and maximum HR. In order to remove
the influence of body weight on the magnitude of O2pulse
response during CPX, its values were then divided by weight in kilograms (relative O2pulse). In order to make the
mathematical manipulations of the study easier, all results related to the relative O2pulse were multiplied by 100.
Data management and statistical analyses
One of the strategies for testing our hypothesis was to divide the sample into quintiles, according to the results of maximum relative O2pulse obtained during the first CPX.
Dividing the sample by quintiles allowed us to compare the stability of relative O2pulse in subjects with different fitness
levels and values of maximum relative O2 pulse. Paired
students t-tests were used to assess the differences for key variables between the first and second CPX, when compar-isons were made for the entire sample. Ax2 statistics was used for comparisons of categorical variables among quintiles of relative O2 pulse. For comparisons made on
key variables among quintiles of maximum relative O2
pulse, a repeated-measures two-way ANOVA with Greenhouse-Geisser correction20was performed, in which
CPX (i.e., first versus second CPX) and quintiles of maximum relative O2were the main factors. After excluding
the first minute (rest-exercise transition) of the CPX, Pearson’s product-moment correlations between relative O2pulse and CPX duration were performed for each CPX,
in order to test the linearity of the relative O2pulse curve
during progressive exercise. After testing the adequacy of linear regression by the magnitude of coefficient of determination of the relative O2pulse, we then calculated
the slopes and intercepts among quintiles for both CPX. To compare the slopes and intercepts, a paired student t-test was performed. All continuous data were reported as mean ¡SEM or as otherwise indicated. NCSS statistical software (Kayesville, UT) was used to perform all analyses. Statistical significance was set at p,0.05 for all calculations.
RESULTS
The median time between the first and second CPX was 15 months (minimum and maximum of 5 and 62 months, respectively). Table 1 presents the baseline clinical char-acteristics of all patients divided by quintiles of maximum relative O2 pulse. Except for the higher proportion of
apparently healthy subjects and lower proportion of coronary artery bypass surgery in the 5thquintile compared to the 2nd quintile (p,0.05), clinical characteristics were homogeneously distributed among all groups. The propor-tion of subjects taking beta-blockers differed only between the 4thquintile versus 1stand 3rdquintiles (p,0.05 for both comparisons).
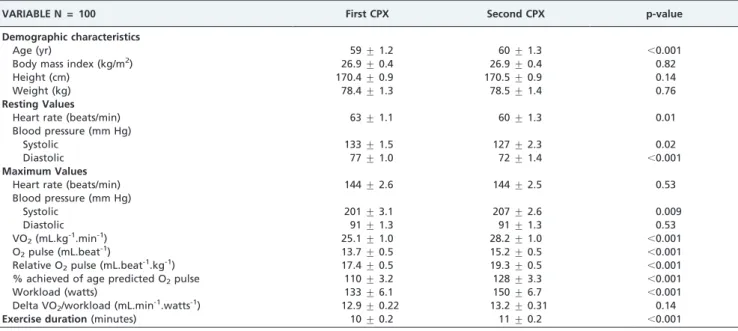
Demographic characteristics and exercise responses for both CPX are shown in Table 2 for the entire sample. No significant differences were found for body weight (p = 0.76). Except for maximum HR (p = 0.53), diastolic blood pressure (p = 0.53) and delta VO2/workload (p =
0.14), significant differences were found for all other maximum results when the first and second CPXs were compared; the average increases were 11% and 10% for VO2maxand maximum relative O2pulse, respectively.
Table 2 -Demographic characteristics and exercise test responses.
VARIABLE N = 100 First CPX Second CPX p-value
Demographic characteristics
Age (yr) 59¡1.2 60¡1.3 ,0.001
Body mass index (kg/m2) 26.9¡0.4 26.9¡0.4 0.82
Height (cm) 170.4¡0.9 170.5¡0.9 0.14
Weight (kg) 78.4¡1.3 78.5¡1.4 0.76
Resting Values
Heart rate (beats/min) 63¡1.1 60¡1.3 0.01
Blood pressure (mm Hg)
Systolic 133¡1.5 127¡2.3 0.02
Diastolic 77¡1.0 72¡1.4 ,0.001
Maximum Values
Heart rate (beats/min) 144¡2.6 144¡2.5 0.53
Blood pressure (mm Hg)
Systolic 201¡3.1 207¡2.6 0.009
Diastolic 91¡1.3 91¡1.3 0.53
VO2(mL.kg-1.min-1) 25.1¡1.0 28.2¡1.0 ,0.001
O2pulse (mL.beat-1) 13.7¡0.5 15.2¡0.5 ,0.001
Relative O2pulse (mL.beat-1.kg-1) 17.4¡0.5 19.3¡0.5 ,0.001
% achieved of age predicted O2pulse 110¡3.2 128¡3.3 ,0.001
Workload (watts) 133¡6.1 150¡6.7 ,0.001
Delta VO2/workload (mL.min-1.watts-1) 12.9¡0.22 13.2¡0.31 0.14
Exercise duration(minutes) 10¡0.2 11¡0.2 ,0.001
Table 3 presents the results of selected key variables divided by quintiles for maximum relative O2 pulse. No
interactions between factors (quintiles and CPX) were found for any of the variables (p.0.05; Table 3). No significant differences were found for body weight, maximum HR and delta VO2/workload in each quintile (p.0.05 for all
comparisons), except for body weight between first and second CPX in the 5thquintile (p,0.05). In contrast, when the first and second CPXs were compared in each quintile, significant differences were found for VO2max, maximum O2
pulse and maximum relative O2 pulse (p,0.05 for all
comparisons). When the respective CPX between 1st and 5th quintiles were compared, significant differences were found for all variables (p,0.05 for all comparisons), except for body weight.
VO2increased in a linear manner relative to HR in both
CPX from the second minute to maximum exercise (average
R2= 0.84 for both CPX in the entire sample). The average R2 between VO2and HR from the onset to the second minute of
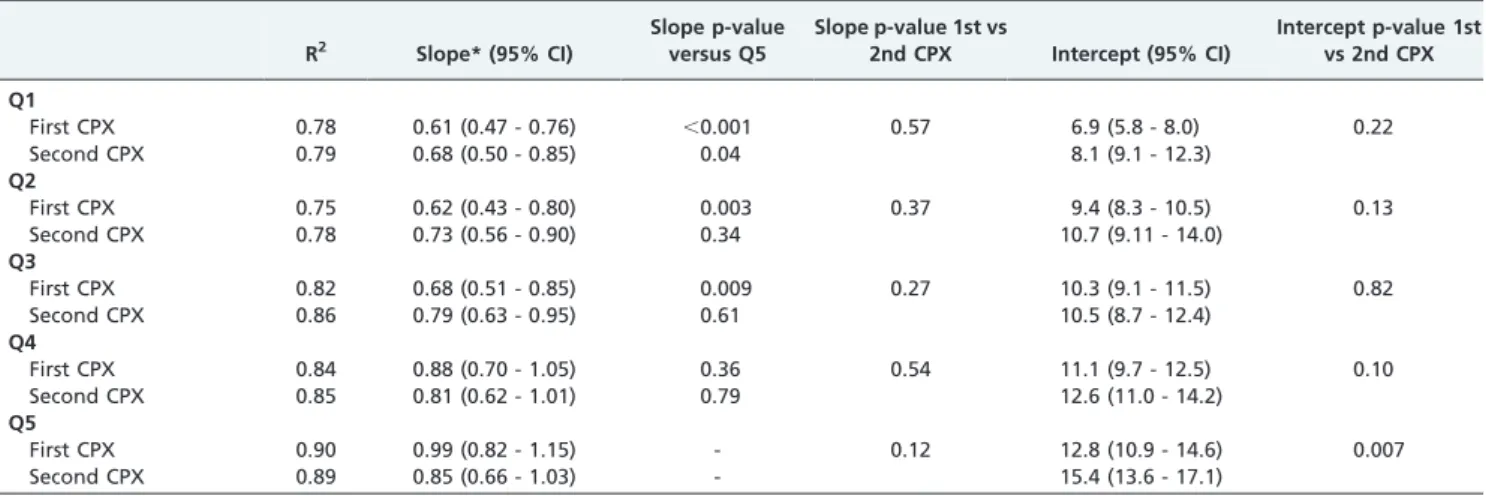
exercise in both CPX was 0.53. The results of the linear regression between relative O2pulse and CPX time divided
by quintiles of maximum relative O2 pulse are shown in
Table 4. The high coefficient of determination (R2) in each
quintile reveals the linearity of relative O2 pulse, after
exclusion of the first minute of CPX. After a median time of 15 months, no significant differences were found for the slopes and intercepts between the first and second CPX in each quintile of maximum relative O2pulse (p.0.05 for all
comparisons; except for intercept comparison in the 5th quintile, p = 0.007). When extremes of quintiles for max-imum relative O2pulse (i.e., 1stversus 5th quintiles) were
compared, its respective slopes were significantly different (p,0.05). In a subset analysis, similar results were found when the slopes between the first and second CPX were Table 3 -Cardiopulmonary exercise testing results by quintiles of maximum relative O2pulse.
Body Weight Maximum VO2 Maximum heart rate Maximum O2pulse
Maximum relative
O2pulse Delta VO2/workload
(kg) (mL.kg-1.min-1) (beats.min-1) (mL.beat-1) (mL.beat-1.kg-1)* (mL.min-1.watts-1)
Q1 (n = 20)
First CPX 74.2¡3.6 16.4¡0.6 143¡4 8.6¡0.4 11.6¡0.3 12.1¡0.6
Second CPX 74.1¡3.7 20.2¡1.0 143¡4 10.6¡0.6 14.3¡0.6 13.3¡0.7
Q2 (n = 20)
First CPX 75.2¡3.3 19.5¡1.0 138¡7 10.8¡0.5 14.3¡0.1 12.5¡0.4
Second CPX 74.9¡3.6 24.3¡1.3 140¡6 13.2¡0.8 17.6¡0.7 12.9¡0.5
Q3 (n = 20)
First CPX 82.3¡2.7 22.9¡0.7 142¡6 13.4¡0.4 16.3¡0.2 13.0¡0.4
Second CPX 81.5¡3.0 26.4¡1.3 143¡5 15.1¡0.6 18.7¡0.7 12.7¡0.4
Q4 (n = 20)
First CPX 82.2¡2.6 27.1¡1.5 139¡6 16.2¡0.6 19.7¡0.2 12.8¡0.4
Second CPX 82.6¡5.3 29.6¡2.2 139¡6 17.8¡1.1 21.4¡1.1 12.6¡0.4
Q5 (n = 20)
First CPX 78.2¡2.4 39.9¡2.5 159¡5 19.5¡1.0 24.9¡1.0 13.9¡0.5
Second CPX 79.6¡2.5 40.3¡2.6 160¡6 19.5¡1.1 24.4¡1.2 14.8¡1.1
p value
Quintile factor 0.018 ,0.001 0.002 ,0.001 ,0.001 0.021
CPX factor 0.949 0.004 ,0.843 0.002 ,0.001 0.312
Interaction 0.998 0.740 0.999 0.601 0.113 0.687
Values are mean¡SEM. VO2, oxygen uptake; O2, oxygen; Q, quintile. * All results of maximum relative O2pulse were multiplied by 100.
Table 4 -Linear regression results by quintiles of maximum relative O2pulse.
R2 Slope* (95% CI)
Slope p-value versus Q5
Slope p-value 1st vs
2nd CPX Intercept (95% CI)
Intercept p-value 1st vs 2nd CPX
Q1
First CPX 0.78 0.61 (0.47 - 0.76) ,0.001 0.57 6.9 (5.8 - 8.0) 0.22
Second CPX 0.79 0.68 (0.50 - 0.85) 0.04 8.1 (9.1 - 12.3)
Q2
First CPX 0.75 0.62 (0.43 - 0.80) 0.003 0.37 9.4 (8.3 - 10.5) 0.13
Second CPX 0.78 0.73 (0.56 - 0.90) 0.34 10.7 (9.11 - 14.0)
Q3
First CPX 0.82 0.68 (0.51 - 0.85) 0.009 0.27 10.3 (9.1 - 11.5) 0.82
Second CPX 0.86 0.79 (0.63 - 0.95) 0.61 10.5 (8.7 - 12.4)
Q4
First CPX 0.84 0.88 (0.70 - 1.05) 0.36 0.54 11.1 (9.7 - 12.5) 0.10
Second CPX 0.85 0.81 (0.62 - 1.01) 0.79 12.6 (11.0 - 14.2)
Q5
First CPX 0.90 0.99 (0.82 - 1.15) - 0.12 12.8 (10.9 - 14.6) 0.007
Second CPX 0.89 0.85 (0.66 - 1.03) - 15.4 (13.6 - 17.1)
R2, coefficient of determination for correlation between Relative O
compared separately in men (p = 0.75) and women (p = 0.24); among subjects taking beta-blockers (p = 0.78) and in subjects with known coronary artery disease (p = 0.31).
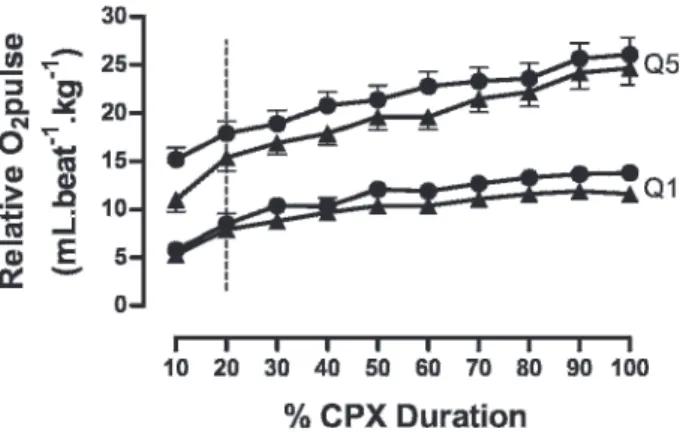
Figure 1 shows the relative O2pulse curves as a function
of percentage time during first and second CPX for 1stand 5thquintiles. No differences were found between CPXs for
each quintile (p.0.05). The vertical line highlights the linearity of the curves after exclusion of the first 10% of the CPX time.
DISCUSSION
The results of the present study add to the existing body of research showing a linear increase in O2pulse throughout
maximal incremental non-steady-state exercise testing. In addition, to our knowledge, this is the first study to demonstrate the stability of the O2 pulse curve pattern in
a large group of subjects under identical clinical status, who served as their own control in a test-retest design.
Our results are in agreement with previous studies,3,5,10,21 in that VO2maxand maximum O2pulse were within normal
limits and were significantly higher in the second CPX (p,0.05; Table 2 and 3). Even though the purpose of our study was not to assess the influence of exercise training, the higher values observed for VO2maxand maximum O2pulse
between tests probably occurred because of the training influence, since almost all the subjects increased their physical activity levels. In addition, an effect due to counseling may have occurred since the remaining 25% of the patients were underwent activity counseling after under-going their initial CPX.
A strong debate regarding the behavior of the SV res-ponse to progressive maximum exercise still exists. 9,22-24
Variations in these studies include a decrease,25a plateau26 or an increase in SV when approaching volitional exhaus-tion27when untrained, moderately trained or heart disease
patients are considered. 24 The prospective design and complexity of methods for measuring SV in most studies has generally limited sample sizes, and thus limited the external validity of the results. In addition, different testing
protocols (graded or constant), type of ergometer (treadmill or cycle), criteria for termination of the test (exhaustion or pre-determined % of age-predicted maximum HR) and also the lack of control of confounding variables such as body weight have limited the interpretation of previous results. Our results support the concept that SV, estimated by relative the O2 pulse response to maximum exercise,
increases in a linear fashion throughout exercise in non-athletes as shown by the high R2(Table 4). A decrease or a plateau in relative O2 pulse would lead to a reduced R2
which was not the case in our results. Our approach was novel in that we excluded the first minute of CPX to calculate the linearity and slopes of relative O2pulse. At the
onset of a ramp protocol, the lack of linearity in the intensity increment affects the linear increase of HR as a function of VO2(average R2 = 0.53 for both CPX).28As a consequence,
an artificial upward shift in O2 pulse slope occurs at the
onset of exercise, as seen in Figure 1 during the first 10% of the test (the slopes are visually different before and after the vertical line). Thus, excluding the first minute of the CPX has an advantage in that it allows the direct use of the O2
pulse slope, obviating the need to calculate the VO2and HR
slopes. Although linearity was present irrespective of quintile of maximum relative O2 pulse (high R2 in all
quintiles) it is clear that the higher the slope of the relative O2pulse, the higher will be its linearity, as demonstrated by
the positive trend shown in the results of R2among quintiles of relative O2pulse (Table 4).
Data have recently emerged in regard to the association between the O2pulse pattern during CPX and the presence
of ischemia during exercise5,6,29. Belardinelli et al.5studied 202 patients with known coronary heart disease who underwent both myocardial scintigraphy and cycle CPX. By logistic regression analysis, the only independent predictors of a positive myocardial scintigraphy were O2
pulse flattening duration (calculated from the inflection point occurring in VO2as related to work) and the slope of
VO2/workload. The slope of VO2/workload was within
normal limits from the start of exercise to a point corresponding to the onset of myocardial ischemia. However, as work rate increased further, an inflection point was evident in most patients with detectable myocardial ischemia, with the cutoff of 3.9 mL.min-1.watts-1 being the strongest independent predictor according to a hierarchical model. Supporting these results, Chaudhry et al.,29showed that at the onset of myocardial ischemia, a decrease in the O2
pulse with increasing work rate and a abrupt decrease in the slope of VO2/workload occurred in a 68 year old woman
referred for CPX as part of a preoperative evaluation. The O2pulse patterns observed in these studies are most likely
explained by reduced stroke volume at higher intensity exercise due to myocardial ischemia. In contrast, this was not the case in our relatively normal subjects, since delta VO2/workload was within normal limits in all quintiles of
maximum relative O2pulse (Table 3) and the slopes were
significantly different from zero (Table 4).
A novel finding shown by the present study was that, after a median time of 15 months in between first and second CPXs, the relative O2pulse curve pattern remained
unchanged as demonstrated by the lack of significant differences in slopes and intercepts regardless the max-imum relative O2pulse presented in each quintile (Table 4).
The slopes and intercepts were similar despite the sig-nificantly higher values of VO2max in second CPX in each
Figure 1 -First and second quintiles of relative O2pulse during
CPX. Triangles (m) stand for results obtained in the first CPX. Closed circles ($) stand for results obtained in the second CPX. The vertical line highlights the linearity of the curves after exclusion of the first 10% of the CPX time. All results of relative O2 pulse were multiplied by 100. The exercise responses and
quintile of maximum relative O2 pulse (on average 1% to
20% higher on the second CPX). This may have occurred because of the lower sub-maximal HR values during the second CPX, as a result of the improved VO2max (possible
training or counseling effect). In fact, three possible combinations of VO2 and HR kinetics may occur after a
period of exercise training, the first being that only the VO2
kinetics is modified with training, the second being that only the HR kinetics is modified with training and the third being that both VO2 and HR kinetics are modified with
training. The first two cases imply that modifications of O2
pulse slope only mirrors the modification of VO2 or HR
kinetics; if such is the case, the relevance of the O2 pulse
kinetics is limited. On the other hand, as may have occurred in our study (Tables 3 and 4); when both VO2 and HR
kinetics are modified, the O2pulse kinetics do not correlate
highly with any of these two variables. The results for the O2
pulse slopes were similar when comparisons between the first and second CPXs were performed, and were also similar when subsets of subjects were analyzed with known coronary artery disease and those taking beta-blockers, which extend the clinical applications of our results to these subgroups.
Finally, our study adjusted O2 pulse by body weight.
Given the close relationship between SV and body dimen-sions, 12,13 consideration of body dimensions is necessary when evaluating the O2pulse pattern to exercise. Otherwise,
an obese subject might misleadingly have a superior O2
pulse response when compared, for example, to a lean marathoner. To our knowledge, few studies have taken into account the influence of weight on O2pulse responses to
exercise.30-32This aspect has been an important limitation of
both clinical6,14and physiological studies.15,16In a study by Munhoz et al.,6 87 patients underwent both myocardial scintigraphy and treadmill CPX in order to compare the O2
pulse response to incremental exercise in patients with and without ischemia as detected by myocardial scintigraphy. Although a flattening of the O2pulse response occurred in
patients with extensive myocardial ischemia when com-pared to those with mild ischemia, the authors concluded that O2 pulse responses during exercise were not able to
discriminate those with and without myocardial ischemia. Caution is in order, however, when interpreting these results, since there were significant differences in the weight of the subjects, which was heavier in those with ischemic responses. It is possible then, that patients with ischemic responses performed better in terms of O2 pulse simply
because they were heavier. Unfortunately, the authors did not provide information on the relative O2pulse responses,
which limits comparisons between subjects with different body weights. The sub-maximal O2 pulse has also been
reported to be similar between trained and untrained men, when trained men were on average 14 kg lighter than untrained men.16Similarly, O2pulse was not significantly
different between obese and leaner women when obese women were 18 kg heavier on average than leaner women.15
Some limitations are of note in the present study. Even though direct measurements of SV were not made, collectively, the evidence is convincing that O2 pulse
correlates well with direct measurements of SV.11,16,21,33,34 According to the modified Fick equation, O2pulse equals
the product of SV and arterio-venous oxygen difference. Since the assessment of arterio-venous oxygen difference requires the placement of invasive catheters, we assumed
that arterio-venous oxygen difference increases in a pre-dictable way with respect to workload, reaching an approximate constant peak value at close to maximal intensity.25,35 Therefore, after the point where arterio-venous oxygen difference tends to reach its maximum value, any further increase in O2pulse will reflect changes
in SV. Finally, although the aim of the present study was not to assess the influence of exercise training of key dependent variables, we cannot exclude the possible influence of the supervised exercise program or counseling on our results. Considering all the above, some caution should be made when interpreting the results of the present study.
Clinical implications
The novelty of our study lays in the fact that it was the first study to demonstrate the stability of O2 pulse. By
showing the O2pulse curve stability after a median time of
15 months in subjects under similar clinical conditions and drug regimens, we reject the hypothesis that factors such as measurement variability inherent to any test (in our case CPX), could affect the O2 pulse pattern. This increases in
importance considering the established association between O2 pulse curve pattern and myocardial ischemia. In other
words, if such variability in the O2pulse curve pattern was
present, rejecting our hypothesis, it could be difficult to discriminate those with a flat O2pulse curve truly caused by
myocardial ischemia from those with a flat curve caused just by variations in measurements inherent to CPX.
CONCLUSIONS
After excluding the first minute of CPX (rest-exercise transition), the relative O2pulse exhibited a linear increase
throughout maximum exercise. In addition, in a test-retest design, where subjects served as their own controls, the pattern of relative O2pulse remained stable.
ACKNOWLEDGMENTS
Ricardo Oliveira was supported by FAPERJ (Brazil). Claudio Gil Arau´jo is a recipient of research fellowships from CAPES and FAPERJ (Brazil)
REFERENCES
1. Astrand PO, Cuddy TE, Saltin B, Stenberg J. Cardiac Output during Submaximal and Maximal Work. J Appl Physiol. 1964;19:268-74. 2. Linton DM, Gilon D. Advances in noninvasive cardiac output
monitor-ing. Ann Card Anaesth. 2002;5:141-8.
3. Oliveira RB, Myers J, Araujo CG, Abella J, Mandic S, Froelicher V. Maximal exercise oxygen pulse as a predictor of mortality among male veterans referred for exercise testing. Eur J Cardiovasc Prev Rehabil. 2009;16:358-64, doi: 10.1097/HJR.0b013e3283292fe8.
4. Oliveira RB, Myers J, Araujo CG, Arena R, Mandic S, Bensimhon D, et al. Does peak oxygen pulse complement peak oxygen uptake in risk stratifying patients with heart failure? Am J Cardiol. 2009;104:554-8, doi: 10.1016/j.amjcard.2009.04.022.
5. Belardinelli R, Lacalaprice F, Carle F, Minnucci A, Cianci G, Perna G, et al. Exercise-induced myocardial ischaemia detected by cardiopul-monary exercise testing. Eur Heart J. 2003;24:1304-13, doi: 10.1016/ S0195-668X(03)00210-0.
6. Munhoz EC, Hollanda R, Vargas JP, Silveira CW, Lemos AL, Hollanda RM, et al. Flattening of oxygen pulse during exercise may detect extensive myocardial ischemia. Med Sci Sports Exerc. 2007;39:1221-6, doi: 10.1249/mss.0b013e3180601136.
7. Lim JG, McAveney TJ, Fleg JL, Shapiro EP, Turner KL, Bacher AC, et al. Oxygen pulse during exercise is related to resting systolic and diastolic left ventricular function in older persons with mild hypertension. Am Heart J. 2005;150:941-6, doi: 10.1016/j.ahj.2004.12.021.
9. Rowland T. Endurance athletes’ stroke volume response to progressive exercise: a critical review. Sports Med. 2009;39:687-95, doi: 10.2165/ 00007256-200939080-00005.
10. Wasserman K, Hansen JE, Sue DY, Casaburi R, Whipp BJ. Principles of exercise testing and interpretation. Baltimore: Lippincott, Williams & Wilkins, 2004. p. 151.
11. Whipp BJ, Higgenbotham MB, Cobb FC. Estimating exercise stroke volume from asymptotic oxygen pulse in humans. J Appl Physiol. 1996;81:2674-9.
12. Collis T, Devereux RB, Roman MJ, de Simone G, Yeh J, Howard BV, et al. Relations of stroke volume and cardiac output to body composition: the strong heart study. Circulation. 2001;103:820-5.
13. de Simone G, Devereux RB, Daniels SR, Mureddu G, Roman MJ, Kimball TR, et al. Stroke volume and cardiac output in normotensive children and adults. Assessment of relations with body size and impact of overweight. Circulation. 1997;95:1837-43.
14. Laukkanen JA, Kurl S, Salonen JT, Lakka TA, Rauramaa R. Peak oxygen pulse during exercise as a predictor for coronary heart disease and all cause death. Heart. 2006;92:1219-24, doi: 10.1136/hrt.2005.077487. 15. Babb TG, Korzick D, Meador M, Hodgson JL, Buskirk ER. Ventilatory
response of moderately obese women to submaximal exercise. Int J Obes. 1991;15:59-65.
16. Bhambhani Y, Norris S, Bell G. Prediction of stroke volume from oxygen pulse measurements in untrained and trained men. Can J Appl Physiol. 1994;19:49-59.
17. Myers J, Buchanan N, Smith D, Neutel J, Bowes E, Walsh D, et al. Individualized ramp treadmill. Observations on a new protocol. Chest. 1992;101:236S-241S.
18. Myers J, Buchanan N, Walsh D, Kraemer M, McAuley P, Hamilton-Wessler M, et al. Comparison of the ramp versus standard exercise protocols. J Am Coll Cardiol. 1991;17:1334-42, doi: 10.1016/S0735-1097(10)80144-5.
19. Jones N. Clinical Exercise Testing. Philadelphia, PA: WB Saunders Company, 1997. p. 167.
20. Ludbrook J. Repeated measurements and multiple comparisons in cardiovascular research. Cardiovasc Res. 1994;28:303-11, doi: 10.1093/ cvr/28.3.303.
21. Bhambhani YN. Prediction of stroke volume during upper and lower body exercise in men and women. Arch Phys Med Rehabil. 1995;76:713-8, doi: 10.1016/S0003-9993(95)80524-9.
22. Lucia A, Foster C. Decrease or no decrease in the stroke volume of healthy humans approaching volitional exhaustion during large muscle mass exercise. J Appl Physiol. 2008;104:281; author reply 284-5., doi: 10. 1152/japplphysiol.01073.2007
23. Vella CA, Robergs RA. A review of the stroke volume response to upright exercise in healthy subjects. Br J Sports Med. 2005;39:190-5, doi: 10.1136/bjsm.2004.013037.
24. Warburton DE, Gledhill N. Counterpoint: Stroke volume does not decline during exercise at maximal effort in healthy individuals. J Appl Physiol. 2008;104:276-8; discussion 278-9, doi: 10.1152/japplphysiol. 00595.2007a.
25. Proctor DN, Beck KC, Shen PH, Eickhoff TJ, Halliwill JR, Joyner MJ. Influence of age and gender on cardiac output-VO2 relationships during submaximal cycle ergometry. J Appl Physiol. 1998;84:599-605. 26. Hagberg JM, Allen WK, Seals DR, Hurley BF, Ehsani AA, Holloszy JO. A
hemodynamic comparison of young and older endurance athletes during exercise. J Appl Physiol. 1985;58:2041-6.
27. Gledhill N, Cox D, Jamnik R. Endurance athletes’ stroke volume does not plateau: major advantage is diastolic function. Med Sci Sports Exerc. 1994;26:1116-21.
28. Palange P, Ward SA, Carlsen KH, Casaburi R, Gallagher CG, Gosselink R, et al. Recommendations on the use of exercise testing in clinical practice. Eur Respir J. 2007;29:185-209, doi: 10.1183/09031936.00046906. 29. Chaudhry S, Arena R, Wasserman K, Hansen JE, Lewis GD, Myers J, et al.
Exercise-induced myocardial ischemia detected by cardiopulmonary exercise testing. Am J Cardiol. 2009;103:615-9, doi: 10.1016/j.amjcard. 2008.10.034.
30. Hsi WL, Wong PL, Lai JS. Submaximal oxygen pulse divided by body weight during incremental exercise test. Am J Phys Med Rehabil. 1997;76:297-303, doi: 10.1097/00002060-199707000-00008.
31. Lavie CJ, Milani RV, Mehra MR. Peak exercise oxygen pulse and prognosis in chronic heart failure. Am J Cardiol. 2004;93:588-93, doi: 10. 1016/j.amjcard.2003.11.023.
32. Salvadori A, Fanari P, Fontana M, Buontempi L, Saezza A, Baudo S, et al. Oxygen uptake and cardiac performance in obese and normal subjects during exercise. Respiration. 1999;66:25-33, doi: 10.1159/000029333. 33. Klainman E, Fink G, Lebzelter J, Krelbaumm T, Kramer MR. The
relationship between left ventricular function assessed by multigated radionuclide test and cardiopulmonary exercise test in patients with ischemic heart disease. Chest. 2002;121:841-5, doi: 10.1378/chest.121.3. 841.
34. Klainman E, Kusniec J, Stern J, Fink G, Farbstein H. Contribution of cardiopulmonary indices in the assessment of patients with silent and symptomatic ischemia during exercise testing. Int J Cardiol. 1996;53:257-63, doi: 10.1016/0167-5273(95)02551-0.