CLINICAL SCIENCE
The slope of the oxygen pulse curve does not depend
on the maximal heart rate in elite soccer players
Raphael Rodrigues Perim,IGabriel Ruiz Signorelli,IJonathan Myers,IIRoss Arena,III Claudio Gil Soares de Arau´joI,IV
IPhysical Education Graduate Program, Gama Filho University, Rio de Janeiro, Brazil.IIDivision of Cardiovascular Medicine, Stanford University and
Veterans Affairs, Palo Alto Health Care System, Palo Alto, USA.IIIPhysical Therapy Program, Department of Orthopaedics and Rehabilitation, University of New Mexico School of Medicine, Albuquerque, USA.IVClinimex, Exercise Medicine Clinic, Rio de Janeiro, Brazil.
INTRODUCTION: It is unknown whether an extremely high heart rate can affect oxygen pulse profile during progressive maximal exercise in healthy subjects.
OBJECTIVE:Our aim was to compare relative oxygen pulse (adjusted for body weight) curves in athletes at their maximal heart rate during treadmill cardiopulmonary exercise testing.
METHODS:A total of 180 elite soccer players were categorized in quartiles according to their maximum heart rate values (n = 45). Oxygen consumption, maximum heart rate and relative oxygen pulse curves in the extreme quartiles, Q1 and Q4, were compared at intervals corresponding to 10% of the total duration of a cardiopulmonary exercise testing.
RESULTS: Oxygen consumption was similar among all subjects during cardiopulmonary exercise testing; however subjects in Q1 started to exhibit lower maximum heart rate values when 20% of the test was complete. Conversely, the relative oxygen pulse was higher in this group when cardiopulmonary exercise testing was 40% complete (p,.01). Although the slopes of the lines were similar (p = .25), the regression intercepts differed (p,.01) between Q1 and Q4. During the last two minutes of testing, a flat or decreasing oxygen pulse was identified in 20% of the soccer players, and this trend was similar between subjects in Q1 and Q4.
CONCLUSION:Relative oxygen pulse curve slopes, which serve as an indirect and non-invasive surrogate for stroke volume, suggest that the stroke volume is similar in young and aerobically fit subjects regardless of the maximum heart rate reached.
KEYWORDS: Cardiopulmonary exercise testing; Maximum oxygen consumption; Ramp protocol; Athletes; Soccer.
Perim RR, Signorelli GR, Myers J, Arena R, de Arau´jo CGS. The slope of the oxygen pulse curve does not depend on the maximal heart rate in elite soccer players. Clinics. 2011;66(5):829-835.
Received for publication onMarch 30, 2011;First review completed onApril 1, 2011;Accepted for publication onApril 1, 2011
E-mail: [email protected]
Tel.: 55 21 2599 7138
INTRODUCTION
Adult athletes competing primarily in aerobic modalities are characterized by higher levels of maximum cardiac output and aerobic power when compared with non-athletes or those who participate in predominantly anaero-bic modalities.1-3As the heart rate (HR) accelerates during exercise, there is a reduction in the duration of the cardiac cycle, especially in diastole, and consequently, ventricular filling time is also reduced. Thus, it has been hypothesized that end-diastolic volume is limited in some individuals by progressively higher HR levels, potentially resulting in an
increase in blunted stroke volume (SV) during exercise as a result of the Frank-Starling mechanism.4
The ratio between oxygen consumption (VO2) and HR
defines the oxygen pulse (O2pulse), which according to the
Fick equation, is numerically equal to the product of SV and arteriovenous O2 concentration difference.5-7 Thus, because
VO2and HR tend to increase linearly but at different rates
based on exercise intensity, the shape of the O2pulse curve
will reflect the relative differences in the magnitude of the incremental adjustments in these variables. Because the shape of the curve representing the arteriovenous O2 difference
does not vary appreciably between healthy individuals subjected to an incremental exercise protocol,5 O2 pulse
reflects SV (i.e., the effective blood volume ejected from the left ventricle with each heart beat).8-11 This phenomenon occurs even more consistently in high-performance athletes.8
Therefore, it is possible to analyze the behavior of SV by following the O2 pulse curve during progressively more
intense exercise, e.g., during cardiopulmonary exercise
Copyrightß2011CLINICS– This is an Open Access article distributed under
testing (CPET) performed with a ramp protocol. Although some studies12-14 suggest that increases in SV may be limited at higher HR levels, there is evidence15, 16that this does not actually occur in the last few minutes of CPET and that the SV may continue to increase up to the end of an exercise protocol in which intensity is progressively increased.
To establish a better physiological understanding of these responses, we evaluated a large group of professional soccer players from whom expired gases were sampled every ten seconds, and continuous electrocardiograms were recorded during a maximally progressive exercise test. We compared the O2pulse curves throughout CPET between two groups
of athletes with high and low maximum HR values. Our hypothesis was that the O2pulse curves would have similar
slopes but different intercepts. This would suggest that SV, reflected by the O2 pulse curves, would behave similarly
during progressive exercise testing, regardless of the magnitude of the maximum HR achieved. In addition, we sought to describe a normal pattern for the relative O2pulse
curves for young, healthy individuals with high aerobic fitness during a CPET performed using a treadmill ramp protocol in which only the velocity was continuously increased.
MATERIALS AND METHODS
Sample
We retrospectively analyzed the results of sports medi-cine evaluations of 180 professional soccer players from first-division clubs in Brazil (n = 151) and Angola (n = 29) that were overseen by our research team between 2005 and 2010. We started with a total sample of 189 players and excluded those who a) did not provide valid data for a true maximal CPET, i.e., due to poor motivation and/or limiting muscle/joint pain; or b) were prescribed any medication that could affect the physiological response to exercise.
The players included in this study were evaluated immediately after the holidays, which is the typical time for pre-season assessment. In the preceding week, subjects did not participate in any formal training or competition. Subjects underwent a specialized medical evaluation aimed at identifying relevant diseases or clinical conditions that could affect their performance or competitive eligibility. Any abnormalities in the resting electrocardiogram were identified and, when necessary, confirmed as physiological adaptations based on clinical findings and echocardiogra-phy.17 After this medical evaluation, all athletes were cleared for professional soccer training and competition. The mean age, weight and height of the players were 24¡4
years, 75 ¡ 8 kg and 178 ¡ 6 cm (mean ¡ standard
deviation), respectively. All players provided informed consent explicitly authorizing the evaluation and use of the data (excluding identifiable information) for research and statistical purposes.
Maximum Cardiopulmonary Exercise Testing
All players were assessed using the same ramp protocol on an ATL Master treadmill (Inbrasport; Porto Alegre, Brazil) programmed to achieve a maximum duration of 10 to 15 minutes. After one minute at 5.5 km/h, the velocity was rapidly increased to 8 km/h and then increased by 0.1 km/h every 7.5 s (0.8 km/h every minute). Considering that the sport of soccer is played on a level field, we
intentionally did not incline the treadmill. The criteria we adopted to ensure a maximal test were a) achievement of maximum voluntary exhaustion, despite verbal encourage-ment, accompanied by a maximum effort sensation (a grade of 10 on the Borg scale); and b) a respiratory exchange ratio greater than 1.10.
Ventilatory and HR measurements
Ventilatory and HR data were collected starting at the third minute of the CPET, at a velocity of 8.8 km/h. We eliminated data collected during the first two minutes, which included the initial walking and running phases. We disregarded these initial phases, which comprise the transition between rest and exercise, because the responses during that time tended to be non-linear.
HR was measured every 10 s from a continuous recording on a single derivation (using CC5 or CM5 chest leads) measured by a digital Micromed electrocardiograph with the Elite ErgoPC software versions 3.2.1.5 or 3.3.6.2 (Micromed; Brası´lia, Brazil). Later, in an effort to eliminate artifacts, the HR values were visually compared, and when there was a difference between two consecutive measure-ments that exceeded five beats, the values were confirmed on the electrocardiographic tracing and, if appropriate, corrected from the reading of five R-R intervals (cardiac cycles). In about 3% of the readings, excess electrocardio-graphic tracing artifacts hindered this measurement and, as a result, the HR values were interpolated. The greatest observed HR value over a 10-s interval during the CPET was considered to be the maximum achieved HR.
Ventilatory expired gas was collected using a preVentH pneumotachograph (MedGraphics; Saint Paul, United States) with the aid of a nose clip and was expressed every 10 s by a VO2000 metabolic analyzer (MedGraphics; Saint
Paul, United States), which was calibrated with known gas concentrations before and after the CPET. The values were corrected as necessary. The O2pulse values were collected
every 10 s during the maximum CPET and divided by the athlete’s body weight to provide the relative O2 pulse. To
facilitate reading of the data, the relative O2 pulse values
were multiplied by 100. To minimize the intrinsic variability of ventilatory measurements, the maximum relative VO2
and the maximum relative O2 pulse were defined as the
highest mean values obtained from a 10-s interval during the maximum CPET.
Data processing
The CPET data were analyzed at intervals equaling 10% of the maximum effective running time (as previously explained) for each player, corresponding to approximately one-minute time intervals. This approach allowed us to compare data at specific intervals regardless of the final treadmill speed achieved. To test the hypothesis of this study, the players were divided into quartiles according to their maximum HR values. For this initial analysis, we considered the extreme quartiles, Q1 and Q4, to represent the lowest and highest maximum HR values.
Statistical analysis
The results of CPET for Q1 and Q4 were compared in two distinct ways: 1) analyzing the HR, relative VO2 and O2
post-hoc procedures as needed; and b) using the coefficient of determination, slope and intercept for the linear regres-sions of the relative O2pulse curves; these were compared
using Student’s t-test.
To determine the normal standards for relative O2pulse
curves in young, healthy individuals with high aerobic fitness, we analyzed data from all 180 players, regardless of the maximum recorded HR. The coefficient of determina-tion, slope and intercept of each relative O2 pulse curve
were also calculated following the same criteria adopted for the quartiles.
In addition, we verified the plateau frequency in the VO2
and relative O2 pulse curves during CPET in these elite
soccer players. The VO2 curve was considered to have
reached a plateau when the difference between the averages of the measurements for the last two minutes of the CPET was less than 1.4 mLO2?kg-1?min-1. This criterion for
defining a plateau in the VO2curve is similar to what has
been used in previous studies,3,18. The O2pulse curve was
considered to have reached a plateau when an absence or decrease at this variable was observed in the last two minutes of CPET. The plateau frequencies between the groups were compared using a chi-squared test to deter-mine whether this behavior could be influenced by extreme HR values. The same procedure was applied to test the hypothesis that there was no difference between Q1 and Q4 with respect to the positions played by each player. For this analysis, the players were divided according to the following positions: goalkeepers, defenders, midfielders and forwards. Finally, we assessed the relationship between maximum HR and age using a linear regression analysis.
We considered p,0.05 as the criterion for statistical significance. All descriptive data are presented as mean and standard deviation, and the data from the inferential analyses are reported as the mean and standard error of the mean. The analyses were performed using Prism software version 5.01 (GraphPad; San Diego, United States).
RESULTS
Comparison between groups
Among the 180 soccer players included in this study, there was an inverse and relatively weak relationship between age and maximum HR (r = -.23; p,.01). Table 1 shows the demographic data and cardiopulmonary responses for the entire sample and for Q1 and Q4 based on the maximum CPET results. Participants in Q1 were slightly older (p,.01), although the mean difference was only two years.
The relative VO2did not significantly differ between the
subjects in Q1 and Q4 at any of the CPET time intervals. Starting when 20% of the CPET duration was complete, the HR was lower among the participants in Q1. Conversely, the relative O2pulse was higher in the Q1 when 40% of the
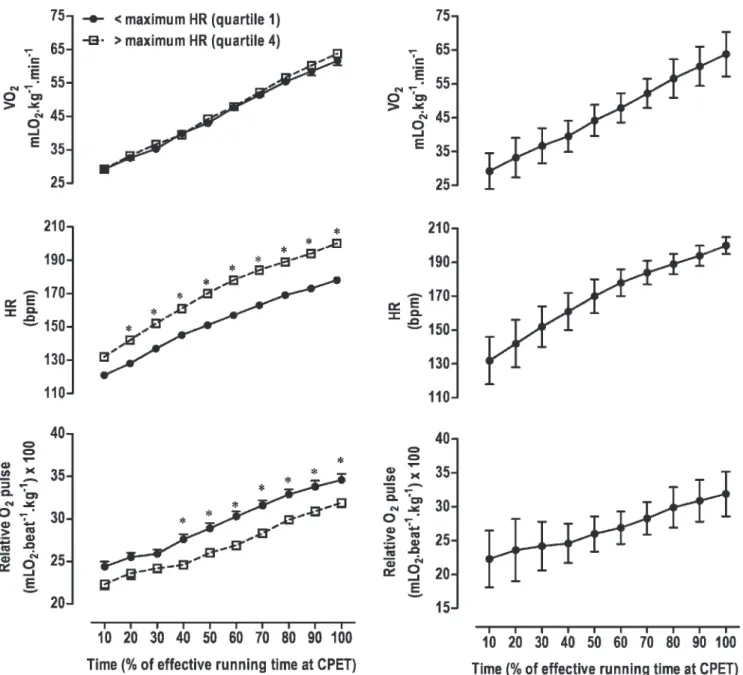
CPET duration was complete (p,0.01) (Figure 1).
The linear regression model for the relative O2pulse fit
equally well for both quartiles, as shown by the high coefficients of determination (0.69 ¡0.03 and 0.67 ¡0.02
for the first and fourth quartiles, respectively). The values of the slope and the intercepts of the relative O2pulse curves
for participants in Q1 (lower maximum HR values) were 0.015 ¡ 0.001 and 23.2 ¡ 0.5, respectively, and for participants in Q4 (higher maximum HR values), they were 0.014 ¡ 0.001 and 21.1 ¡ 0.6, respectively. Whereas the
relative O2 pulse curve slopes were virtually identical
between the quartiles (p = .25), the curve intercepts differed (p,.01).
Normal values for the relative O2pulse curve The average exercise time during CPET was 13.2 ¡
1.2 min. The maximal relative O2 pulse (6100) value was
33.4¡ 4.0 mLO2?beat-1?kg-1. The coefficient of
determina-tion, slope and intercept for the relative O2 pulse curves
were 0.68¡0.18, 0.014¡0.006 and 23.0¡3.2, respectively.
Figure 2 shows the behavior of the relative VO2, HR and
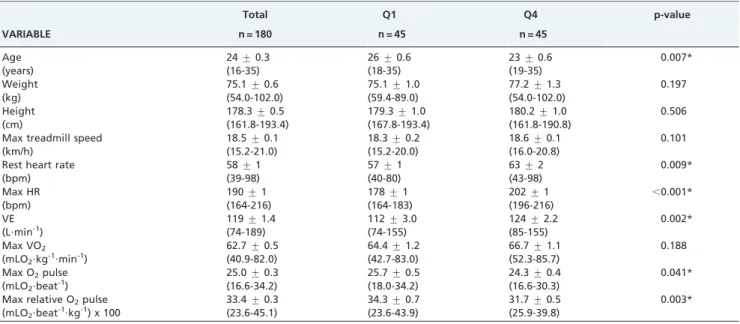
Table 1 -Demographic characteristics and exercise responses during CPET in the entire sample and for the Q1 and Q4 quartiles.
Total Q1 Q4 p-value
VARIABLE n = 180 n = 45 n = 45
Age 24¡0.3 26¡0.6 23¡0.6 0.007*
(years) (16-35) (18-35) (19-35)
Weight 75.1¡0.6 75.1¡1.0 77.2¡1.3 0.197
(kg) (54.0-102.0) (59.4-89.0) (54.0-102.0)
Height 178.3¡0.5 179.3¡1.0 180.2¡1.0 0.506
(cm) (161.8-193.4) (167.8-193.4) (161.8-190.8)
Max treadmill speed 18.5¡0.1 18.3¡0.2 18.6¡0.1 0.101
(km/h) (15.2-21.0) (15.2-20.0) (16.0-20.8)
Rest heart rate 58¡1 57¡1 63¡2 0.009*
(bpm) (39-98) (40-80) (43-98)
Max HR 190¡1 178¡1 202¡1 ,0.001*
(bpm) (164-216) (164-183) (196-216)
VE 119¡1.4 112¡3.0 124¡2.2 0.002*
(L?min-1) (74-189) (74-155) (85-155)
Max VO2 62.7¡0.5 64.4¡1.2 66.7¡1.1 0.188
(mLO2?kg-1?min-1) (40.9-82.0) (42.7-83.0) (52.3-85.7)
Max O2pulse 25.0¡0.3 25.7¡0.5 24.3¡0.4 0.041*
(mLO2?beat-1) (16.6-34.2) (18.0-34.2) (16.6-30.3)
Max relative O2pulse 33.4¡0.3 34.3¡0.7 31.7¡0.5 0.003*
(mLO2?beat-1?kg-1) x 100 (23.6-45.1) (23.6-43.9) (25.9-39.8)
relative O2 pulse in response to the increase in treadmill
velocity. Each value is plotted as a percentage of the maximum CPET running time.
The VO2curves for a total of 67 (37%) subjects reached a
plateau according to the criterion defined for this study, and the average relative VO2variation between two consecutive
minutes was 2.2¡2.1 mLO2?kg-1?min-1. Among the subjects
whose VO2curves reached a plateau, 10 were from Q1, and
17 were from Q4 (p = .17); the remaining players were in Q2 and Q3. Similarly, when the entire sample of 180 soccer players was considered, a plateau was observed for the relative O2 pulse values at the end of CPET in 20% of the
study participants, including 9 from Q1 and 14 from Q4. As previously described, these subjects showed no increase or reduction in this variable during the last two minutes of
CPET (p = 0.33). Additionally, the positional roles on the soccer field were similar between Q1 and Q4 (p = .87).
DISCUSSION
This study assessed trends in VO2, HR and the
relation-ship between these two variables among healthy young male athletes with high aerobic fitness under controlled exercise conditions, in which the intensity was gradually increased to a maximum level. We compared these responses between athletes at high and low extremes of maximum HR values. The results indicate that the relative VO2levels at all of the intervals analyzed as percentages of
the total exercise time were not significantly different between the groups. Nevertheless, as expected, HR values
Figure 1 - Heart rate, oxygen consumption and oxygen pulse
curves during maximal cardiopulmonary exercise testing for athletes at extreme quartiles of maximum heart rate (n = 45). Error bars represent the standard error of the mean.
Figure 2 - Heart rate, oxygen consumption and oxygen pulse
were lower in the group with a lower maximum HR starting at the time point corresponding to 20% of the CPET; consequently, starting at the time point corresponding to 40% of the CPET, we observed an opposite trend in the relative O2pulse curve. Specifically, the participants in Q1,
who had lower maximum HR values, had higher average relative O2pulse values when compared with the
partici-pants in Q4. Figure 1 shows the behavior of VO2, HR and
relative O2pulse expressed as a percentage of the duration
of the running time in the CPET. Considering the adequacy of the linear regression models for analyzing the relative O2
pulse curves as indicated by the high coefficients, we were able to compare the intercepts and slopes of the curves for the two groups, which had similar slopes and distinct intercepts.
Interestingly, as illustrated in Figure 3, our results show a weak inverse relationship between the maximum HR and the age of the players, supporting the idea that, although maximum HR tends to decrease with age, this may vary considerably between young individuals and is poorly predicted by general formulae. We therefore chose to analyze the subjects of this study using quartiles that were assigned based on the maximal HR achieved during CPET regardless of age.
We found that the trends for the relative VO2were similar
for both groups and that they remained directly related to the exercise intensity during the CPET despite the varia-bility in the HR and relative O2pulse values. Thus, although
there was a difference between the relative O2pulse curves
observed in the extreme quartiles, HR compensated for this discrepancy at most of the intervals defined as the percentage of the maximal CPET time; i.e., we observed lower HR values in the group with higher relative O2pulse
values. As shown in Figure 1, even at the earliest intervals of the CPET, when relative O2 pulse and HR did not differ
statistically between the extreme quartiles, participants in Q1 already had a lower HR and higher relative O2 pulse.
Other studies have shown19-21a strong association between VO2and cardiac output in incremental exercise tests. This
suggests that both VO2 and cardiac output should have
been similar between the groups during the CPET. Thus, even with the differences in HR and relative O2 pulse
between the groups, there were no differences in the demand of the active muscles for oxygen at any time point, and were there no marked differences in mechanical efficiency. In addition, the lack of differences between the slopes of the relative O2 pulse curves suggests that these
trends were not affected by differing maximum HR values and that the proportion of the increase in the relative O2
pulse did not vary between the groups during the CPET. On the other hand, the intercept of the relative O2pulse curves
was significantly lower in the group with higher maximal HR values, suggesting that changes in cardiac output in response to incremental increases in exercise intensity occurred with a proportionally smaller SV.
For some of the soccer players in both groups, a pronounced plateau or decreasing pattern was observed in the relative O2 pulse curve. The reason for this is that,
whereas HR tends to present a linear pattern throughout the CPET, VO2 often damps during the last minutes. When
exercise intensity exceeds the anaerobic threshold, a higher proportion of the energy produced will come from anaerobic metabolism, which allows the subject to tolerate the increase in exercise intensity without any further increase in VO2. In this context, HR continues to increase
throughout the entire CPET duration, whereas VO2follows
a less steep pattern or even keeps constant, resulting in a plateau of the relative O2pulse. Because the O2pulse can be
considered a surrogate for SV, this finding corroborates the observations described in other studies15,16,21-23that suggest a trend of continuously increasing SV in high-performance athletes during a maximal CPET. For example, Gledhill et al.15 reported a continuous increase in SV in elite cyclists during a maximum CPET. Notably, the athletes in the Gledhill study had high HR values (180-190 bpm), which were comparable to those found in the athletes who participated in the present study. Similarly, Zhou et al.16 observed that in elite long-distance runners, the SV increased (by approximately 52 mL) between light and maximum exercise intensities during CPETs. Although it may be possible to observe a continuous SV increase during a CPET with increasing intensity, these studies analyzed individuals with a higher maximal aerobic power than that found in our sample of professional soccer players. Based on these results, we sought to compare the SV behavior in individuals with similar aerobic conditioning to our sample. Vanfraechem21 assessed 17 well-trained soccer players at 25%, 50% and 75% of the maximum VO2and reported an SV
increase of 37% between 50% and 75% of the maximal aerobic capacity. This suggests that it is possible to produce increases in SV during more intense exercise in healthy individuals with high aerobic fitness. Thus, in different studies and populations with similar or even greater aerobic fitness, the linear pattern of the SV response to increasingly intense exercise appears to be feasible, at least for the large majority of the subjects, despite the significant reduction in the ventricular filling time that occurs during a very intense effort.
It is important to mention that these studies’ results are in contrast the conventional view that SV tends to plateau starting at 40-50% of maximum VO2in progressive exercise
tests.12,13,24 In some of these studies,12,13 the aerobic conditioning of the subjects was relatively low. Boutcher et al.,24 however, also failed to observe increases in SV
during the final stage of the CPET even among trained subjects, although it was concluded that there were
Figure 3 -Relationship between maximum heart rate (HR) values
differences in the SV when comparing non-trained, active and aerobically-trained men. However, a detailed analysis of these responses revealed that the HR was only analyzed to 150 bpm due to excessive movements that hindered the continuity of data collection, and the authors were unable to observe whether the SV increased beyond that point.
As our sample was composed only of individuals with a high level of aerobic conditioning (VO2 = 66.2 ¡
7.4 mLO2?kg-1?min-1), it is likely that their inotropic and
lusitropic cardiac characteristics prevented the SV from being substantially limited at the end of the CPET, even in individuals with high HR values. Studies on cardiac structure25,26 show significant differences in the posterior
wall and interventricular septum thickness in the heart and differences in the dimensions of the left ventricular in aerobically trained individuals cavity when compared with apparently healthy sedentary individuals. These findings could contribute to the preservation of a high SV in conjunction with a highly elevated HR at peak exercise. Additionally, it has been argued16,27that a lower resistance offered by the pericardium in aerobically trained indivi-duals may explain an elevated end-diastolic volume and a potential for further increases in SV by the Frank-Starling mechanism, even in the final minutes of the CPET. Data obtained in dogs appear to show that this mechanism is physiologically possible,28 as these animals were able to
generate an increase in the end-diastolic volume and SV after pericardiotomy.
The characteristics of the O2pulse curve were previously
analyzed by other authors29 who scored O2 pulse curve
behavior according to reference values. However, the criteria they adopted appear to be subjective and over-simplify the phenomenon; moreover, this method has not been adopted in other studies since its original publication. Another objective of this study was to define a standard for the relative O2 pulse curve in young, healthy males with
high aerobic fitness. Although the O2 pulse has been
consistently reported in the literature in absolute terms (mLO2?beat-1),7,8,10,30,31 it is known that obese individuals
have higher submaximal VO2values when compared with
non-obese individuals at the same exercise intensity due to gravity effects and the greater effort that is required for obese individuals to run at a fixed velocity.5Thus, although two individuals may have the same maximum O2 pulse,
their functional capacity (measured by maximum running speed) can vary significantly. Therefore, to avoid the influence of body dimension variability on O2pulse values,
we analyzed this variable relative to body weight (mLO2?beat-1?kg-1), as was recently done in other studies
of our group.7,23,32Therefore, our reported relative O2pulse
values allow the extrapolation of the results to a wider range of individuals and situations. Our results indicate that relative O2 pulse is quasi-linear throughout a CPET. This
was somewhat less evident in the last two minutes, and it was independent of the final maximum treadmill speed or the magnitude of the maximum HR.
One final salient observation was that the presence of a plateau in VO2 is rather uncommon, as it occurs in only
about one third of the players. This is consistent with other studies that have reported similar percentages for VO2
plateaus when trained individuals were evaluated.1,3 Concerning relative O2pulse curves, a flattening or decrease
in the last two minutes of CPET was seen in 36 (20%) of the 180 players. Additionally, our data indicate that the
occurrence of plateaus in the VO2 and relative O2 pulse
curves was not significantly influenced by the magnitude of the maximal HR achieved in these professional male soccer players.
This study has several limitations. Importantly, we did not directly measure cardiac output, arteriovenous O2
differences or SV. Therefore, the behavior of the SV can only be inferred from the relative O2pulse data. In addition,
we did not acquire invasive readings of the mean arterial pressure during CPET. These readings could contribute to a better understanding of the mechanisms that allow an increase in SV in young individuals with good to excellent aerobic conditioning. Additional studies employing other methodologies for data collection are necessary to further understand these issues.
CONCLUSION
The major finding of this study is that a shorter diastolic filling time, as seen in young, healthy and fit athletes with high maximum HR values, did not influence the shape of the relative O2pulse curve, suggesting that the SV profile
was likely to be unaffected. Relative O2pulse also tended to
increase in a linear fashion throughout a maximal CPET. However, in 20% of these young, healthy and aerobically fit soccer players, regardless of the maximal HR achieved, the relative O2 pulse curve did not increase in the last
two minutes of CPET, which suggests that there is some physiological limitation of stroke volume in these individuals.
ACKNOWLEDGMENTS
Mr. Raphael Perim and Gabriel Signorelli were supported by theConselho Nacional de Desenvolvimento Cientı´fico e Tecnolo´gico(Brazil). Dr. Claudio Gil is a recipient of research grants/fellowships from Conselho Nacional de Desenvolvimento Cientı´fico e Tecnolo´gico and Fundac¸a˜o Carlos Chagas Filho de Amparo a` Pesquisa do Estado do Rio de Janeiro(Brazil). We thank Mr. Altamiro Bottino for helping with some specific aspects of soccer physiology.
REFERENCES
1. Doherty M, Nobbs L, Noakes T. Low frequency of the "plateau phenomenon" during maximal exercise in elite British athletes. Eur J Appl Physiol. 2003;89:619-23.
2. Mihl C, Dassen WR, Kuipers H. Cardiac remodelling: concentric versus eccentric hypertrophy in strength and endurance athletes. Neth Heart J. 2008;16:129-33, doi: 10.1007/BF03086131.
3. Lucı´a A, Rabada´n M, Hoyos J, Herna´ndez-Capilla M, Pe´rez M, San Juan A, et al. Frequency of the VO2max plateau phenomenon in world-class cyclists. Int J Sports Med. 2006;27:984-92.
4. Turkevich D, Micco A, Reeves JT. Noninvasive measurement of the decrease in left ventricular filling time during maximal exercise in normal subjects. Am J Cardiol. 1988;62:650-2.
5. Wasserman K, Hansen JE, Sue DY, Casaburi R, Whipp BJ. Principles of Exercise Testing and Interpretation. 3 ed. Baltimore: Lippincott Williams & Wilkins; 1999. p. 2-129.
6. Pinkstaff S, Peberdy MA, Fabiato A, Finucane S, Arena R. The clinical utility of cardiopulmonary exercise testing in suspect or confirmed myocardial ischemia. Am J Lifestyle Med. 2010;4:327-48, doi: 10.1177/ 1559827610362955.
7. Oliveira RB, Myers J, Araujo CG, Abella J, Mandic S, Froelicher V. Maximal exercise oxygen pulse as a predictor of mortality among male veterans referred for exercise testing. Eur J Cardiovasc Prev Rehabil. 2009;16:358-64, doi: 10.1097/HJR.0b013e3283292fe8.
8. Bhambhani Y, Norris S, Bell G. Prediction of stroke volume from oxygen pulse measurements in untrained and trained men. Can J Appl Physiol. 1994;19:49-59.
10. Crisafulli A, Piras F, Chiappori P, Vitelli S, Caria MA, Lobina A, et al. Estimating stroke volume from oxygen pulse during exercise. Physiol Meas. 2007;28:1201-12, doi: 10.1088/0967-3334/28/10/006.
11. Balady GJ, Arena R, Sietsema K, Myers J, Coke L, Fletcher GF, et al. Clinician’s Guide to cardiopulmonary exercise testing in adults: a scientific statement from the American Heart Association. Circulation. 2010;122:191-225, doi: 10.1161/CIR.0b013e3181e52e69.
12. Holmgren A, Jonsson B, Sjostrand T. Circulatory data in normal subjects at rest and during exercise in recumbent position, with special reference to the stroke volume at different work intensities. Acta Physiol Scand. 1960;49:343-63, doi: 10.1111/j.1748-1716.1960.tb01957.x.
13. Astrand PO, Cuddy TE, Saltin B, Stenberg J. Cardiac output during submaximal and maximal work. J Appl Physiol. 1964;19:268-74. 14. Higginbotham MB, Morris KG, Williams RS, McHale PA, Coleman RE,
Cobb FR. Regulation of stroke volume during submaximal and maximal upright exercise in normal man. Circ Res. 1986;58:281-91.
15. Gledhill N, Cox D, Jamnik R. Endurance athletes’ stroke volume does not plateau: major advantage is diastolic function. Med Sci Sports Exerc. 1994;26:1116-21.
16. Zhou B, Conlee RK, Jensen R, Fellingham GW, George JD, Fisher AG. Stroke volume does not plateau during graded exercise in elite male distance runners. Med Sci Sports Exerc. 2001;33:1849-54, doi: 10.1097/ 00005768-200105001-00610.
17. Araujo CG, Castro CL, Franca JF. Prevaleˆncia de marcador de risco tardio no eletrocardiograma de repouso de futebolistas brasileiros e africanos. Rev SOCERJ. 2008;21:42-9.
18. Taylor HL, Buskirk E, Henschel A. Maximal oxygen intake as an objective measure of cardio-respiratory performance. J Appl Physiol. 1955;8:73-80.
19. Farinatti PT, Soares PP. Cardiac output and oxygen uptake relationship during physical effort in men and women over 60 years old. Eur J Appl Physiol. 2009;107:625-31.
20. Proctor DN, Beck KC, Shen PH, Eickhoff TJ, Halliwill JR, Joyner MJ. Influence of age and gender on cardiac output-VO2 relationships during submaximal cycle ergometry. J Appl Physiol. 1998;84:599-605. 21. Vanfraechem JH. Stroke volume and systolic time interval adjustments
during bicycle exercise. J Appl Physiol. 1979;46:588-92.
22. Ekblom B, Hermansen L. Cardiac output in athletes. J Appl Physiol. 1968;25:619-25.
23. Perim RR, Signorelli GR, Araujo CG. Stability of relative oxygen pulse curve during repeated maximal cardiopulmonary testing in professional soccer players. Braz J Med Biol Res. Forthcoming 2011.
24. Boutcher SH, McLaren PF, Cotton Y, Boutcher Y. Stroke volume response to incremental submaximal exercise in aerobically trained, active, and sedentary men. Can J Appl Physiol. 2003;28:12-26.
25. Abergel E, Chatellier G, Hagege AA, Oblak A, Linhart A, Ducardonnet A, et al. Serial left ventricular adaptations in world-class professional cyclists: implications for disease screening and follow-up. J Am Coll Cardiol. 2004;44:144-9, doi: 10.1016/j.jacc.2004.02.057.
26. Sharma S, Maron BJ, Whyte G, Firoozi S, Elliott PM, McKenna WJ. Physiologic limits of left ventricular hypertrophy in elite junior athletes: relevance to differential diagnosis of athlete’s heart and hypertrophic cardiomyopathy. J Am Coll Cardiol. 2002;40:1431-6, doi: 10.1016/S0735-1097(02)02270-2.
27. Rowland T. Endurance athletes’ stroke volume response to progressive exercise: a critical review. Sports Med. 2009;39:687-95, doi: 10.2165/ 00007256-200939080-00005.
28. Hoit BD, Dalton N, Bhargava V, Shabetai R. Pericardial influences on right and left ventricular filling dynamics. Circ Res. 1991;68:197-208. 29. Klainman E, Fink G, Lebzelter J, Krelbaumm T, Kramer MR. The
relationship between left ventricular function assessed by multigated radionuclide test and cardiopulmonary exercise test in patients with ischemic heart disease. Chest. 2002;121:841-5, doi: 10.1378/chest.121.3. 841.
30. Lavie CJ, Milani RV, Mehra MR. Peak exercise oxygen pulse and prognosis in chronic heart failure. Am J Cardiol. 2004;93:588-93. 31. Munhoz E, Hollanda R, Vargas J, Silveira C, Lemos A, Hollanda R, et al.
Flattening of oxygen pulse during exercise may detect extensive myocardial ischemia. Med Sci Sports Exerc. 2007;39:1221-6, doi: 10. 1249/mss.0b013e3180601136.