Can Optimism, Pessimism, Hope, Treatment
Credibility and Treatment Expectancy Be
Distinguished in Patients Undergoing Total
Hip and Total Knee Arthroplasty?
Tsjitske M. Haanstra1*, Claire Tilbury2, Steven J. Kamper1,3, Rutger L. Tordoir4, Thea P. M. Vliet Vlieland2, Rob G. H. H. Nelissen2, Pim Cuijpers5, Henrica C. W. de Vet1,
Joost Dekker6, Dirk L. Knol7, Raymond W. Ostelo1,8
1Department of Epidemiology and Biostatistics and the EMGO Institute for Health and Care Research, VU University Medical Centre, Amsterdam, The Netherlands,2Department of Orthopaedics, Leiden University Medical Center, Leiden, The Netherlands,3Musculoskeletal Division, The George Institute for Global Health, The University of Sydney, Sydney, New South Wales, Australia,4Department of Orthopaedics, Rijnland Ziekenhuis, Leiderdorp, The Netherlands,5Department of Clinical Psychology and the EMGO Institute for Health and Care Research, VU University Amsterdam, The Netherlands,6Department of Rehabilitation Medicine and the EMGO Institute, VU University Medical Centre, Amsterdam, The Netherlands,7Department of Epidemiology and Biostatistics, VU University Medical Centre, Amsterdam, The Netherlands,8Department of Health Sciences and the EMGO Institute for Health and Care Research, VU University, Amsterdam, The Netherlands
Abstract
Objectives
The constructs optimism, pessimism, hope, treatment credibility and treatment expectancy are associated with outcomes of medical treatment. While these constructs are grounded in different theoretical models, they nonetheless show some conceptual overlap. The purpose of this study was to examine whether currently available measurement instruments for these constructs capture the conceptual differences between these constructs within a treatment setting.
Methods
Patients undergoing Total Hip and Total Knee Arthroplasty (THA and TKA) (Total N = 361; 182 THA; 179 TKA), completed the Life Orientation Test-Revised for optimism and pessi-mism, the Hope Scale, the Credibility Expectancy Questionnaire for treatment credibility and treatment expectancy. Confirmatory factor analysis was used to examine whether the instruments measure distinct constructs. Four theory-driven models with one, two, four and five latent factors were evaluated using multiple fit indices andΔχ2tests, followed by some posthoc models.
OPEN ACCESS
Citation:Haanstra TM, Tilbury C, Kamper SJ, Tordoir RL, Vliet Vlieland TPM, Nelissen RGHH, et al. (2015) Can Optimism, Pessimism, Hope, Treatment Credibility and Treatment Expectancy Be Distinguished in Patients Undergoing Total Hip and Total Knee Arthroplasty? PLoS ONE 10(7): e0133730. doi:10.1371/journal.pone.0133730
Editor:Jelte M. Wicherts, Tilburg University, NETHERLANDS
Received:December 10, 2014
Accepted:June 30, 2015
Published:July 27, 2015
Copyright:© 2015 Haanstra et al. This is an open access article distributed under the terms of the
Creative Commons Attribution License, which permits unrestricted use, distribution, and reproduction in any medium, provided the original author and source are credited.
Data Availability Statement:All relevant data are available via Figshare (http://dx.doi.org/10.6084/m9. figshare.1373550).
Results
The results of the theory driven confirmatory factor analysis showed that a five factor model in which all constructs loaded on separate factors yielded the most optimal and satisfactory fit. Posthoc, a bifactor model in which (besides the 5 separate factors) a general factor is hypothesized accounting for the commonality of the items showed a significantly better fit than the five factor model. All specific factors, except for the hope factor, showed to explain a substantial amount of variance beyond the general factor.
Conclusion
Based on our primary analyses we conclude that optimism, pessimism, hope, treatment credibility and treatment expectancy are distinguishable in THA and TKA patients. Postdoc, we determined that all constructs, except hope, showed substantial specific variance, while also sharing some general variance.
Introduction
Growing evidence supports the importance of psychological constructs in predicting outcomes of medical treatment including surgery [1–7]. Usually epidemiological studies investigating the relationship between psychological factors and outcome of treatment restrict their assessment to one or two psychological questionnaires. However, in order to disentangle their unique con-tribution to outcome, the roles of separate constructs need to be explored simultaneously [8]. It is therefore necessary that the instruments that aim to measure these constructs are able to dis-criminate between them.
Much attention has been given to the future oriented constructs‘optimism’, and‘hope’ [1,9]. Both these constructs reflect expectancies about one’s future. More specifically, optimism has been defined as“generalized positive outcome expectancies”[10] and hope as“a cognitive set that is based on a reciprocally derived sense of successful agency (goal directed determina-tion) and pathways (planning of ways to meet goals)”[11]. Theory suggests that a hopeful per-son is more explicitly concerned with self-initiated actions that will enable him to achieve a favourable future while an optimistic person believes that somehow (through either internal or external factors) his future will be successful [12]. Substantial empirical work investigating optimism and hope has been done within mental health settings. But evidence suggests these constructs may also be related to outcomes in medical treatments like surgery. For example: optimism explains close to 10% of the variance in post-surgical pain after total hip arthroplasty (THA) and total knee arthroplasty (TKA) [13].
Besides these general future oriented constructs interest in treatment specific psychological constructs like‘treatment expectancy’and‘treatment credibility’has also grown [14].
Treatment expectancy is defined as“improvements that clients believe will be achieved”and treatment credibility as“how believable, convincing and logical the treatment is”[15]. Concep-tually, expectations for a given treatment may develop (at least partly) from how credible the treatment seems. Both these constructs may be related to treatment outcomes. For example it was found that expectancies about treatment outcome help predict return to work outcomes [16].
While the abovementioned psychological constructs are grounded in different theoretical models, some studies have hypothesized that there is some conceptual overlap between them
[1,10–12,17–21]. Optimism, hope, treatment credibility and treatment expectancy have for instance all been conceptualized as an anticipatory state and beliefs about the future [11,12,22,23]. Others have emphasized the conceptual differences between the constructs. Some suggest hope is an emotional state, while optimism is a cognitive state [24]. Treatment credibility also has been defined as a cognitive concept, whereas treatment expectancy as a more affective or emotional concept, similar to hope [15]. Furthermore, treatment credibility and treatment expectancy are conceptualized to be situational (i.e. treatment specific), in con-trast to hope and optimism which are dispositional [15,25].
Multiple studies have empirically explored the distinction between the constructs optimism (and pessimism) and hope. A recent meta-analysis concluded that these constructs are posi-tively associated but not redundant (rho<0.8) and that hope and optimism have differential
relationships with outcomes like well-being or personality [9]. Treatment expectancy and treat-ment credibility however have not been included in studies examining the distinctiveness of future oriented constructs, yet. It may be that in medical situations like upcoming elective sur-gery patients answer items belonging to the hope and optimism questionnaires more in a situa-tional way, referring to their treatment or illness. Consequently in medical treatments, and more specifically in the invasive treatments like surgery, optimism and hope could possibly show similarities to treatment credibility and treatment expectancy.
This study aims to examine whether the instruments for optimism, pessimism, hope treat-ment credibility and treattreat-ment expectancy measure distinct constructs in a population of patients scheduled for THA or TKA.
Materials and Methods
Participants and procedures
This study was part of a larger prospective cohort study on the outcomes of THA and TKA. It included consecutive patients undergoing a primary THA or TKA because of osteoarthritis in the Rijnland Hospital in Leiderdorp, the Netherlands between October 2010 and September 2012. Assessments were done pre-operatively and 12 months after surgery. Between July 2011 and September 2012 a subgroup of participants received additional questionnaires concerning optimism, hope and expectancies pre-operatively. For the present analysis pre-operative data of this subgroup were used. The larger study, as well as the extension for the subgroup was approved by the Medical Ethical Committee of the Rijnland General Hospital, Leiderdorp, the Netherlands (registration number 10/07). All participants gave written informed consent.
Measurement
One day prior to surgery all participants completed a questionnaire including sociodemo-graphic, disease characteristics, Quality of Life and the Life Orientation Test-Revised (LOT-R), the Hope Scale (HS) and the Credibility Expectancy Questionnaire (CEQ). Demographic characteristics included: age (years), sex and education level. Disease characteristics pain and functioning were measured using the Pain and ADL subscales of the HOOS (for THA patients) [26] and KOOS (for TKA patients) [27] questionnaires. Quality of Life was measured using the SF-36 questionnaire [28] from which mental component scores (MCS) and physical compo-nent scores (PCS) were derived.
Optimism (and pessimism)
optimistic about my future), 3 negatively formulated items (e.g. I rarely count on good things happening to me) and 4 filler items (e.g. It’s easy for me to relax), all items are answered on a 5 point Likert-type scale. The LOT-R was originally developed by Scheier and Carver in 1994 [20] who called the LOT-R a unidimensional questionnaire in which the observed variables represent one latent factor called trait optimism. However others have argued that the items in the LOT-R represent two latent factors namely optimism and pessimism [29,30]. Hence, sum-scores range from 3–15 when two subscale scores are calculated or from 3–30 when one total score is calculated. The factor structure of the Dutch version of the LOT-R was tested recently [31]. Results showed that the two factor model had the best fit.
Hope
The Hope Scale consists of 12 items of which 4 items measure‘pathways’(e.g. There are lots of ways around the problem), 4 items measure‘agency’(e.g. I meet the goals that I have set for myself) and 4 are filler items (e.g. I worry about my health) [11]. All items are answered on an 8 point scale with two anchors (1 = totally disagree and 8 = totally agree).The hope scale is sidered to be a unidimensional scale in which agency and pathways together represent the con-struct‘trait hope’. Analysis of the Dutch version of the HS has shown good model fits for a one factor structure [32]. Hence, a sumscore which ranges from 8–64 points is derived by summing the 8 items of the HS.
Treatment credibility and treatment expectancy
The Credibility Expectancy Questionnaire is a self-reported six item questionnaire that aims to measure treatment credibility and expectancy for improvement. Originally it was developed by Devilly et al in 2000 [15], and validated in several groups. The Dutch translation was done by Smeets et al in 2008 [14]. In both the original and the Dutch version three items (e.g. at this point, how successfully do you think the surgery will be in reducing your complaints) were found to load on the credibility factor and three items (e.g. at this point, how much do you really feel that the surgery will help to reduce your complaints) on the expectancy factor. Intro-ductory instructions tell the patient that beliefs about how well the therapy might help contain both thoughts and feelings about the therapy and that these may be the same or different [14]. Items 1 to 3 and 5 are answered on a scale ranging from 1 (not at all) to 9 (very much), Items 4 and 6 are answered on a 0 (not at all) to 100% (very much). In accordance with Smeets et al scores on item 4 and 6 were transformed with a minimum of 1 and a maximum of 9, and a sum score was formed for each factor ranging from 3 to 27.
Statistical analysis
Confirmatory factor analysis (CFA) for ordered categorical items was used to examine whether the constructs optimism (LOT-R), pessimism (LOT-R), hope (HS), treatment credibility (CEQ credibility subscale) and treatment expectancy (CEQ expectancy subscale), are distinguishable. Because observed variables were all answered on ordinal scales, a matrix based on polychoric correlations was used for CFA. Negatively formulated items of the LOT-R were reverse scored prior to entry into the CFA models. Analyses were conducted using the weighted least squares mean and variance adjusted estimator (WLSMV) in Mplus 6.12. For the total group of THA and TKA patients four theory-driven models with five, four, two and one latent factors, in which the factors were allowed to correlate within the CFA models, were evaluated using multi-ple fit indices and compared usingΔχ2tests [33]. The following fit indices and thresholds were used to denote a satisfactory model: Tucker-Lewis index (TLI)>0.95; comparative fit index
significantΔχ2test indicates that the model with the smallestχ2(in this case the least stringent model) has a significantly better fit.
Model 1 hypothesised a full differentiation between the five constructs treatment credibility, treatment expectancy, hope, optimism and pessimism. Thus items of each construct was forced to load on a separate factor. Model 2 hypothesised a differentiation between four constructs; the treatment credibility, treatment expectancy and hope items were still forced to load on sep-arate factors, but in this model the optimism and reverse-scored pessimism items were forced to load on one factor as it is controversial whether LOT-R has a uni- or bidimensional structure [29,30]. Model 3 hypothesised a two factor structure in which the optimism, pessimism and hope (LOT-R and HS) items were forced to load on one factor representing‘generalized posi-tive beliefs about the future’and the treatment credibility and treatment expectancy (CEQ) items were forced to load on one factor representing‘treatment specific beliefs about the future’. This model was tested because of the theoretical plausibility that patients may have general and situational, in this case treatment specific, beliefs about the future. Model 4 hypothesised that treatment credibility, treatment expectancy, hope, optimism and pessimism items load on a single underlying latent factor. This model was tested because when it is assumed that optimism, pessimism, hope, treatment credibility and treatment expectancy are not distinguishable at all, the data should fit this one factor model. If necessary (eg because of ambiguities or high correlations between factors) post-hoc models were tested. Guttman’s lambda 2 was used to determine internal consistency reliability of each subscale. A value>0.7
was considered indicative of good internal consistency reliability [35,36]. All the analyses above were done using the total sample of THA and TKA patients.
When using the same questionnaire in different groups Factorial Invariance (FI) should be established to show that the items of the questionnaire measure the particular latent construct similarly across groups. In our study both TKA and THA patients were included, and as patients with scheduled for knee arthroplasty may face different difficulties to patients sched-uled for hip arthroplasty, the constructs measured in this study may also have different mean-ings for these groups.
Assessing factorial invariance involves a process of comparing the fit indices for a series of models with increasingly stringent constraints on the relationships between the model parame-ters. The best-fitting model for the total sample (TKA and THA) identified in the previous analysis was assessed in multigroup CFA’s to test for factorial invariance across the TKA and THA groups[37]: Four multigroup CFA models with increasingly stringent model constraints were tested (Table 1):
• A baseline model (configural invariance): in which only the factor structure (number of fac-tors and the pattern of the free and fixed loadings) was constrained to be equal across groups. In this model no equality constraints were imposed on the intercepts and factor loadings.
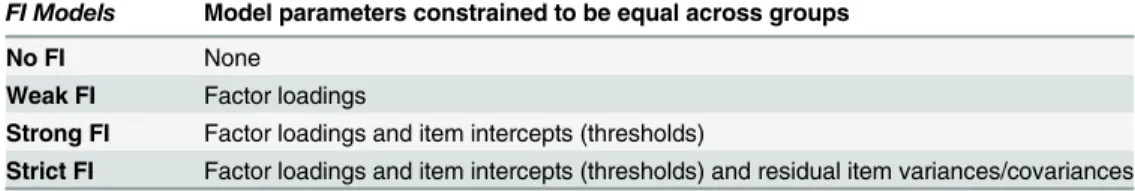
Table 1. Levels of factorial invariance
FI Models Model parameters constrained to be equal across groups
No FI None
Weak FI Factor loadings
Strong FI Factor loadings and item intercepts (thresholds)
Strict FI Factor loadings and item intercepts (thresholds) and residual item variances/covariances
• A weak FI model: in which the factor structure and factor loadings were constrained to be equal across groups, intercepts were allowed to vary among groups and factor variances were fixed to one in both groups.
• A strong FI model: in which factor structure and loadings and intercepts (thresholds) were constrained to be equal across groups.
• A strict FI model: in which factor structure, factor loadings, intercepts and residual variances were constrained to be equal across groups.
To evaluate the degree of measurement invariance, the recommendations by Cheung and Rensvold [38] were followed, which state that the null hypothesis (invariance) is kept if the incremental change in comparative fit index (CFI) is equal to or smaller than 0.01 [38]. Accep-tance of the strong or the strict invariance model was sufficient to assume that the measure-ment instrumeasure-ments used measure the same constructs in all participants (both THA and TKA).
Missing data were incorporated by using the default option available in Mplus. For WLMSV estimation, Mplus computes polychoric correlations based on pairwise present data between two variables, treating missing data as missing completely at random (MCAR). Under MCAR, the missingness is assumed to occur entirely at random and not depend on observed covariates or on the response itself.
Results
Characteristics of the sample and internal consistency reliability of the
subscales
A total of 745 patients were admitted for THA and 614 patients were admitted for TKA from October 2010 to September 2012. Of these, 420 THA (63.2%) and 395 TKA (65.9%) patients consented to participate and completed the surveys. A subgroup of 184 THA and 191 TKA patients, the ones enrolled in the study between July 2011 and September 2012, received addi-tional questionnaires including the LOT-R, the HS and the CEQ. Of these, 14 had missing responses on all items and were therefore excluded, leaving in total 361 patients for analysis (182 THA, 179 TKA). Characteristics of the subgroup of participants that completed the addi-tional questionnaires and mean scores (sd) on the subscales of these questionnaires are pre-sented inTable 2for THA and TKA groups separately. In both TKA and THA groups the majority of patients were females, the mean age was 67 years for both groups. The mean pain score was 41.9 for THA patients and 39.7 for TKA patients. The mean functioning score (HOOS/KOOS ADL) was 43.8 for THA patients and 45.6 for TKA patients. THA patients on average scored 23.7 on the credibility and 22.5 on the expectancy subscale of the CEQ, TKA patients scored 23.5 and 22.1 on these subscales respectively. HS scores were 43.2 for THA and 41.3 for TKA patients. Optimism was scored 9.9 for THA patients and 10.0 for TKA patients, Pessimism scores were 10.8 for THA and 10.4 for TKA patients. Internal consistency reliability (lambda 2) of each of the subscales was acceptable (Table 2). For 14 patients responses on all items were missing and therefore they were excluded from analysis. All the questionnaire items had missing responses, though in most items<7% responses were missing. An exception was
one of the HS items which had 42% missing responses (item 6) due to a printing error in the questionnaire. The amount of data in the pairwise coefficients ranged between 0.57 and 0.98.
Confirmatory factor analysis
two factor model, and the two factor model with the one factor model. The five factor model showed fit indices that satisfied the cut-off criteria determined by Hu and Bentler [34], whilst the models with four, two and one latent factor did not satisfy these criteria. Further,Δχ2tests also indicated that the four factor model fit significantly worse than the five factor model, the two factor model fit significantly worse than the four factor model and the one factor model fit significantly worse than the two factor model. Thus, of the four models tested the five factor model is to be preferred based on all fit indices.
The five factor model including the standardized factor loadings and correlations between factors is presented inFig 1. In this five factor model a very strong correlation was seen between Table 2. Characteristics of the sample included in this study and lambda 2 values for the subscales included in the Confirmatory Factor Analysis.
Total hip arthroplasty (N = 182) mean (SD)/ %
Total knee arthroplasty (N = 179) mean (SD)/%
Total sampleN = 361 Mean (SD)/%
Gutmann’s lambda 2 for the total sample
Gender % female 58.1% 71.6% 64.8%
-Age 67.1 (9.9)) 67.6 (9.3) 67.4 (9.6)
-Education level
-Low 33.7% 50.3% 42.0%
Medium 32.0% 31.2% 31.6%
High 34.3% 18.5% 26.4%
BMI 27.5 (4.7) 29.5 (4.8) 28.5 (4.9)
-SF-36 Physical summary scale (range 0–100)
38.8 (7.1) 39.1 (7.7) 38.9 (7.4)
-Sf-36 Mental summary scale (range 0–100)
51.8 (10.7) 52.2 (11.2) 52.0 (10.9)
-HOOS/KOOS*pain (range 0–100)
41.9 (17.8) 39.7 (16.7) 40.6 (17.2)
-HOOS/KOOS*Activities of Daily Living (range 0–100)
43.8 (17.6) 45.6 (17.6) 44.7 (17.5)
-CEQ Credibility (range 3–27) 23.7 (3.0) 23.5 (3.1) 23.6 (3.1) 0.714
CEQ Expectancy (range 3–27) 22.5 (3.0) 22.1 (3.0) 22.3 (3.0) 0.779
HS Hope (range 8–64) 43.2 (11.6) 41.3 (11.8) 42.2 (11.7) 0.941
LOT-R Optimism (range 3–15) 9.9 (2.9) 10.0 (2.8) 9.9 (2.8) 0.834
LOT-R Pessimism, reverse scored (range 3–15)
10.8 (2.8) 10.4 (2.7) 10.6 (2.8) 0.709
*The THA patients completed the HOOS questionnaire and the TKA patients completed the KOOS questionnaire.
HOOS = the Hip injury and Osteoarthris Outcome Score, KOOS = the Knee injury and Osteoarthritis Outcome Score, CEQ = Credibility Expectancy Questionnaire, HS = Hope Scale, LOT-R = Life Orientation Test Revised.
doi:10.1371/journal.pone.0133730.t002
Table 3. χ2difference tests and model fit indices for the models tested for the total group (THA and TKA).
χ2(df) P-value Δχ2(df) P-value TLI CFI RMSEA
Five factor model 400.9 (160) <0.01 237.1 (4)$ <0.01 0.981 0.984 0.065
Four factor model 1121.8(164) <0.01 86.7 (5)# <0.01 0.927 0.937 0.127
Two factor model 1220.4(169) <0.01 271.1 (1) § <0.01 0.922 0.930 0.131
One factor model 3081.9 (170) <0.01 0.785 0.807 0.218
$five factor model compared to four factor model model # four factor model compared to two factor model
§ two factor model compared to one factor, TLI = Tucker-Lewis Index, CFI = comparativefit index, RMSEA = root mean square error of approximation.
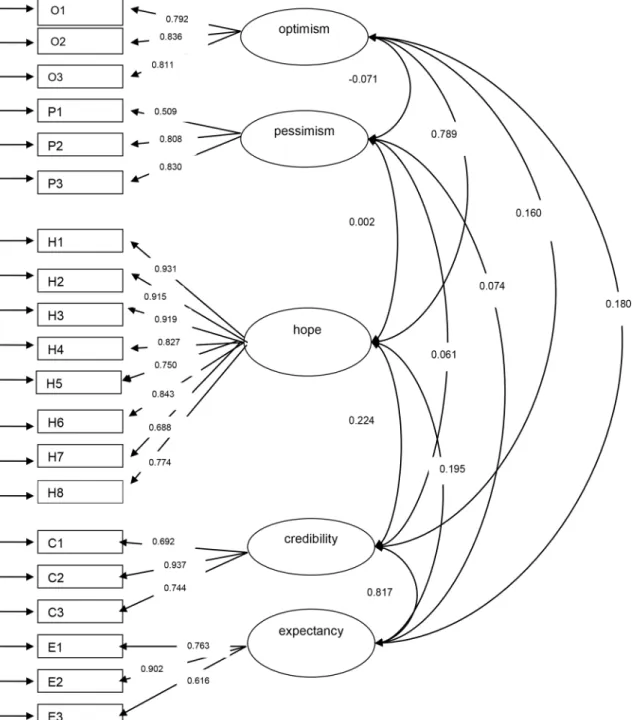
the treatment credibility and treatment expectancy factors, and a strong correlation between the optimism and hope factors.
Factorial Invariance testing (seeTable 4) showed that the baseline model was well-fitting and thereby supported configural invariance. For the increasingly stringent models none of the subse-quent null-hypotheses of measurement invariance were rejected using the recommendations of Fig 1. Path diagram and standardized factor loadings and correlations between factors for the 5 factor model.O1—O3 = LOT-R optimism items 1 to
3,P1—P3 = LOT-R reverse scored pessimism items 1 to 3,H1—H8 = ADHS hope items 1 to 8,C1—C3 = CEQ credibility items 1 to 3,E1—E3 = CEQ
expectancy items 1 to 3 ovals represent latent factors, squares represent observed variables, factor loadings are represented by the arrows between ovals and squares and correlations between factors are represented by the arrows between the ovals.
Cheung and Rensvold [38] which state that the null hypothesis (invariance) is not rejected if the incremental change in CFI is equal to or smaller than 0.01. Thus, strict invariance could be supported.
Because of the very strong correlation between treatment expectancy and treatment credi-bility, and between hope and optimism, three post-hoc analyses were performed. A four factor model with separate factors for hope, optimism and pessimism but in which expectancy and credibility items were forced to load on one factor (S1 Fig) showed fit indices equal to the five factor model (TLI = 0.98, CFI = 0.98, RMSEA = 0.06,χ2(df) = 412.5 (164)) TheΔχ2test indi-cated that the four factor model fit significantly worse than the five factor model (Δχ2(df) = 16.1 (4) p<0.01)).A four factor model with separate factors for treatment expectancy,
treat-ment credibility and pessimism but in which optimism and hope were forced to load on one factor (S2 Fig), had a slightly worse fit compared to the five factor model (TLI = 0.97, CFI = 0.97, RMSEA = 0.08,χ2(df) = 568.7 (164)). TheΔχ2test indicated that the four factor model fit significantly worse than the five factor model (Δχ2(df) = 102.7 (4) p<0.01).
Further, a bifactor model in which (besides the 5 separate factors) there is a general factor (gf) that is hypothesized to account for the commonality of the items of the 5 separate con-structs was tested (S3 Fig). This bifactor model showed better fit indices than the 5 factor model and the four factor model in which the expectancy and credibility items were forced to load on one factor (TLI = 0.99, CFI = 0.99, RMSEA = 0.06,χ2(df) = 304.6 (140)). TheΔχ2test indicated that the bifactor model fit statistically significantly better than the five factor model (Δχ2(df) = 86.8 (20) p<0.01). For the bifactor model we calculated the proportion of variance
accounted for by all factors (ωk), the proportion of variance accounted for by the general factor (ω
H). For each of the 5 separate factors we calculated the proportion of variance unique from
the general factor (ωNk) (for example see [39,40]). For these unique proportions of variance a value ofωNk0.30 was regarded as substantial, a value of 0.20ωNk<0.30 was regarded as
moderate, and a value ofωNk<0.20 was regarded low [40].Table 5shows that the total amount
of variance accounted for by all factors is large (0.94). Also, a substantial amount of variance of all factors (ωk) is accounted for by variation in the general factor (0.79). This suggest that all Table 4. Model fit indices of the multigroup models for factorial invariance testing across THA and TKA.
Factorial Invariance models Χ2(df) P value TLI CFI RMSEA
Baseline model (configural invariance) 640.1 (415) <0.01 0.986 0.985 0.055
Weak Invariance 653.6 (430) <0.01 0.987 0.985 0.054
Strong Invariance 672.4 (405) <0.01 0.983 0.982 0.060
Strict Invariance 718.6 (425) <0.01 0.983 0.981 0.062
doi:10.1371/journal.pone.0133730.t004
Table 5. The proportion of variance explained by all factors (ωk), the proportion of variance of the
total scale explained by the general factor (ω
H) and the proportion of variance of the separate con-structs explained by the specific factors (ωNk).
Scale ωk ωH ωNk
Total model (general factor) 0,942 0,787
Separate constructs
Treatment credibility 0,838 0,789
Treatment expectancy 0,809 0,782
Hope 0,956 0,015
Optimism 0,857 0,329
Pessimism 0,769 0,769
items indeed measure a common construct. However the specific factors differ in how much variance they account for unique from the general factor. Treatment expectancy, treatment credibility, optimism and pessimism explain a substantial amount of variance unique from the general factor, however hope does not explain a substantial amount of variance unique from the general factor (Table 5).
Discussion
This study examined whether the existing instruments for optimism, pessimism, hope, treat-ment credibility and treattreat-ment expectancy measure distinct psychological constructs in patients undergoing TKA or THA. Because it was not our purpose to develop new instruments or to revise the existing ones, we chose a confirmatory approach (CFA) in all our analyses instead of an exploratory approach (EFA). Moreover, we aimed to use all instruments in the same way as they are currently utilized in research and practice and therefore did not delete items with low factor loadings.
The results of the theory driven CFA showed that a five factor model in which optimism (LOT-R subscale optimism), pessimism (LOT-R subscale pessimism), hope (HS), treatment credibility (CEQ subscale credibility) and treatment expectancy (CEQ subscale expectancy) had the most optimal fit. However, there were two interesting observations. First, a strong cor-relation (r = 0.82) was observed between expectancy and credibility. Therefore a post-hoc anal-ysis was performed in which a four factor model in which expectancy and credibility were forced to load on one factor was tested. Although fit indices were very similar as the five factor model, theΔχ2test indicated the five factor model was the preferred model. Earlier studies found moderate to very high correlations between expectancy and credibility (r = 0.56 [14], r = 0.68 [15] and r = 0.83 [15]), though exploratory as well as confirmatory factor analyses sug-gest expectancy and credibility are two separate factors [14,15]. Although the current study cannot provide the definite answer regarding the distinctiveness of the constructs treatment expectancy and treatment credibility in patients undergoing THA or TKA, it seems reasonable that the a-priori, theory driven 5 factor model is preferred. Additionally the five factor model is also supported by the results of those earlier studies on the constructs expectancy and credibil-ity. Nevertheless, future studies should investigate the factorial structure of the CEQ and the distinctiveness of the constructs treatment credibility and treatment expectancy to determine if our findings are replicable or unique to our study sample.
Secondly, a strong correlation was also observed between optimism and hope (r = 0.79). A priori we hypothesized that these two factors would be correlated but still distinct because both are defined as general future oriented constructs but do have considerable theoretical differ-ences, though we did not expect such a strong correlation. We therefore also performed a post-hoc analysis to investigate the influence of the strong correlation between hope and optimism on model fit. Results showed that the five factor model had a significantly better fit than the four factor model in which optimism and hope were forced to load on one factor.
Our findings are consistent with previous factor analyses that have shown hope and opti-mism to be related but distinct constructs [9,12]. Our study has extended these findings by demonstrating this in patients undergoing THA and TKA as well as by additionally consider-ing treatment specific future oriented psychological constructs. Our results however slightly differ from Magaletta and Olivers [12] study because we found that the five factor model which included pessimism as a separate factor showed better model fit compared a four factor model in which all items of the LOT-R loaded on one factor. This could be a result of the use of the Dutch translation of the LOT-R which has shown to have a two-dimensional structure [31] Similar to previous studies we found that optimism and hope are positively related and that both of these are negatively related to pessimism [9,22].
Studying the conceptual overlap of psychological constructs seems to gain more impor-tance. A reason for this is that many psychological measures have been developed in the last decades and all of them have individually shown to measure important constructs in medical care but considerable overlap may exist between these constructs (and measures), causing lack of conceptual clarity and confusion among researchers and care providers about which psycho-logical measures to use in studies and daily practice. Therefore, studies investigating conceptual overlap or distinctiveness of these constructs within a medical care setting are important. Recently, two of such studies have been published. De Rooij et al [41] investigated the concep-tual overlap between cognitive concepts in patients with chronic widespread pain and found that 16 different cognitive subscales could be reduced to three factors namely 1. negative emo-tional cognitions, 2.active cognitive coping and 3.control belief and expectations of chronicity. Campbell et al [42] studied the conceptual overlap of psychological constructs in low back pain patients and found that 20 subscales of psychological questionnaires could be reduced into four factors namely 1.pain-related distress, 2.cognitive coping, 3.causal beliefs and 4.percep-tions of the future. Our study also addresses this issue; however we had a slightly different approach. De Rooij et al and Campbell et al performed factor analyses on a subscale level thereby aiming to identify the most complete though comprehensive set of cognitive (de Rooij) or psychological (Campbell) constructs. We however assessed whether individual item of ques-tionnaires measuring the constructs of interest indeed load on the factors as intended by the developers of the subscale. Our approach therefore, may be seen as the first in a two-step approach in examining overlap between constructs. Once distinctive measurement has been established on an item level, a next step could then be assessing overlap between subscales as de Rooij and Campbell did.
Strengths and limitations
assumption that missing data are missing completely at random (MCAR). Because of the rea-son of the missing data and the fact that that participants with and without missing data (on item 6 of the HS) did not significantly differ on baseline characteristics we believe that the MCAR assumption may hold for our data.
Furthermore, we usedΔχ2-test to compare models, which is controversial as theχ2is influ-enced by sample size; therefore we also included other model fit statistics and based our conclu-sions on a combination of a-priori defined cut-points. CFA is a test of acceptance of a-priori defined models that are not data driven. A limitation of this method is however, that besides the theoretically plausible models tested in this study, there might be other models that show an even better fit to the data. Our results have furthermore not been validated in an external dataset we therefore encourage future research in TKA and THA and also in other patient groups.
Conclusions and Implications
Based on the results of the current study and previous work we suggest that the constructs treatment expectancy, treatment credibility, hope, optimism and pessimism are distinguishable in THA and TKA patients. Posthoc, a bifactor model in which (besides the 5 separate factors) a general factor is hypothesized accounting for the commonality of the items showed a signifi-cantly better fit than the five factor model. All specific factors, except for the hope factor, showed to explain a substantial amount of variance beyond the general factor. Future studies should investigate the factorial structure of the CEQ. Our results may be valuable for the design of clinical studies aiming to measure one or more of these constructs as well as for the evalua-tion of intervenevalua-tions focussed on altering treatment expectancy which have been initiated lately by several groups [43–45]. As optimism and hope have been hypothesized to be relatively sta-ble traits, it is necessary for researchers evaluating interventions aimed at altering treatment expectancy, to measure the possibly alterable treatment expectancy distinct from optimism and hope.
A next step in making these constructs of benefit for the patient undergoing THA and TKA is to investigate the relationships between these factors (e.g. Does optimism influence treatment specific expectancies?) and to find out which one or which combination of constructs predicts with more accuracy treatment outcomes after THA and TKA like pain, quality of life and phys-ical well-being the best. In the future clinicians may use these constructs in addition to other tools, in order to identify patients with a high-risk for poor outcome in their decision for the type of intervention, either surgical or conservative.
Supporting Information
S1 Fig. Post-hoc model 1; four factor model in which the items of treatment credibility and treatment expectancy load on one factor.O1—O3 = LOT-R optimism items 1 to 3,P1— P3 = LOT-R reverse scored pessimism items 1 to 3,H1—H8 = ADHS hope items 1 to 8,C1— C3 = CEQ credibility items 1 to 3,E1—E3 = CEQ expectancy items 1 to 3 ovals represent latent factors, squares represent observed variables.
(TIF)
observed variables. (TIF)
S3 Fig. Post-hoc model 3; the bifactor model.O1—O3 = LOT-R optimism items 1 to 3,P1— P3 = LOT-R reverse scored pessimism items 1 to 3,H1—H8 = ADHS hope items 1 to 8,C1— C3 = CEQ credibility items 1 to 3,E1—E3 = CEQ expectancy items 1 to 3 ovals represent latent factors, squares represent observed variables.
(TIF)
Author Contributions
Conceived and designed the experiments: TMH CT SJK PC HCWdV JD DLK RWO. Per-formed the experiments: TMH CT RLT TPMVV RGHHN. Analyzed the data: TMH CT SJK DLK RWO. Contributed reagents/materials/analysis tools: TMH CT RLT TPMVV RGHHN. Wrote the paper: TMH CT SJK TPMVV RGHHN PC HCWdV JD DLK RWO.
References
1. Achat H, Kawachi I, Spiro A, DeMolles DA, Sparrow D (2000) Optimism and depression as predictors of physical and mental health functioning: the Normative Aging Study. Ann Behav Med 22: 127–130.
PMID:10962705
2. Dawn AG, Lee PP (2004) Patient expectations for medical and surgical care: a review of the literature and applications to ophthalmology. Surv Ophthalmol 49: 513–524. PMID:15325196
3. Flood AB, Lorence DP, Ding J, McPherson K, Black NA (1993) The role of expectations in patients' reports of post-operative outcomes and improvement following therapy. Med Care 31: 1043–1056.
PMID:7694013
4. Fontaine KR, Cheskin LJ (1999) Optimism and obesity treatment outcomes. J Clin Psychol 55: 141–
143. PMID:10100841
5. Main CJ, Foster N, Buchbinder R (2010) How important are back pain beliefs and expectations for satis-factory recovery from back pain? Best Pract Res Clin Rheumatol 24: 205–217. doi:10.1016/j.berh.
2009.12.012PMID:20227642
6. Sears SF, Serber ER, Lewis TS, Walker RL, Conners N, Lee JT, et al.(2004) Do positive health expec-tations and optimism relate to quality-of-life outcomes for the patient with an implantable cardioverter defibrillator? J Cardiopulm Rehabil 24: 324–331. PMID:15602153
7. Vissers MM, Bussmann JB, Verhaar JA, Busschbach JJ, Bierma-Zeinstra SM, Reijman M (2012) Psy-chological factors affecting the outcome of total hip and knee arthroplasty: a systematic review. Semin Arthritis Rheum 41: 576–588. doi:10.1016/j.semarthrit.2011.07.003PMID:22035624
8. Smith TW, MacKenzie J (2006) Personality and risk of physical illness. Annu Rev Clin Psychol 2: 435–
467. PMID:17716078
9. Alarcon GM, Bowling NA, Khazon S (2013) Great expectations: A meta-analytic examination of opti-mism and hope. Personality and Individual Differences.
10. Scheier MF, Carver CS (1985) Optimism, coping, and health: assessment and implications of general-ized outcome expectancies. Health Psychol 4: 219–247. PMID:4029106
11. Snyder CR, Harris C, Anderson JR, Holleran SA, Irving LM, Sigmon ST, et al. (1991) The will and the ways: Development and validation of an individual-differences measure of hope. J Pers Soc Psychol 60: 570–585. PMID:2037968
12. Magaletta PR, Oliver JM (1999) The hope construct, will, and ways: their relations with self-efficacy, optimism, and general well-being. J Clin Psychol 55: 539–551. PMID:10392785
13. Pinto PR, McIntyre T, Ferrero R, Almeida A, Raujo-Soares V (2013) Predictors of acute postsurgical pain and anxiety following primary total hip and knee arthroplasty. J Pain 14: 502–515. doi:10.1016/j.
jpain.2012.12.020PMID:23541065
14. Smeets RJ, Beelen S, Goossens ME, Schouten EG, Knottnerus JA, Vlaeyen JW (2008) Treatment expectancy and credibility are associated with the outcome of both physical and cognitive-behavioral treatment in chronic low back pain. Clin J Pain 24: 305–315. doi:10.1097/AJP.0b013e318164aa75
PMID:18427229
16. Iles RA, Davidson M, Taylor NF, O'Halloran P (2009) Systematic review of the ability of recovery expec-tations to predict outcomes in non-chronic non-specific low back pain. J Occup Rehabil 19: 25–40. doi:
10.1007/s10926-008-9161-0PMID:19127345
17. Snyder CR, Sympson SC, Michael ST, Cheavens J (2001) Optimism and hope constructs: Variants on a positive expectancy theme. In: Chang EC, editors. Optimism & pessimism: Implications for theory, research, and practice. Washington, DC US: American Psychological Association. pp. 101–125. 18. Snyder CR, Michael ST, Cheavens JS (1999) Hope as a psychotherapeutic foundation of common
fac-tors, placebos, and expectancies. In: Hubble MA, Duncan BL, Miller SD, editors. The heart and soul of change: What works in therapy. Washington, DC US: American Psychological Association. pp. 179–
200.
19. Carver CS, Scheier MF, Segerstrom SC (2010) Optimism. Clin Psychol Rev 30: 879–889. doi:10.
1016/j.cpr.2010.01.006PMID:20170998
20. Scheier MF, Carver CS, Bridges MW (1994) Distinguishing optimism from neuroticism (and trait anxi-ety, self-mastery, and self-esteem): a reevaluation of the Life Orientation Test. J Pers Soc Psychol 67: 1063–1078. PMID:7815302
21. Chemers MM, Watson CB, May ST (2000) Dispositional affect and leadership effectiveness: A compar-ison of self-esteem, optimism, and efficacy. Personality and Social Psychology Bulletin 26: 267–277. 22. Bryant FB, Cvengros JA (2004) Distinguishing hope and optimism: Two sides of a coin, or two separate
coins? Journal of Social and Clinical Psychology 23: 273–302.
23. Gallagher MW, Lopez SJ (2009) Positive expectancies and mental health: Identifying the unique contri-butions of hope and optimism. The Journal of Positive Psychology 4: 548–556.
24. Bruininks P, Malle BF (2005) Distinguishing Hope from Optimism and Related Affective States. Motiva-tion and EmoMotiva-tion 29: 327–355.
25. Snyder CR (2000) Handbook of hope: Theory, measures, and applications. San Diego, CA US: Aca-demic Press.
26. de Groot I, Reijman M, Terwee CB, Bierma-Zeinstra SM, Favejee M, Roos EM, et al. (2007) Validation of the Dutch version of the Hip disability and Osteoarthritis Outcome Score. Osteoarthritis Cartilage 15: 104–109. PMID:16890460
27. de Groot I, Favejee MM, Reijman M, Verhaar JA, Terwee CB (2008) The Dutch version of the Knee Injury and Osteoarthritis Outcome Score: a validation study. Health Qual Life Outcomes 6: 16. doi:10. 1186/1477-7525-6-16PMID:18302729
28. Ware JE Jr, Sherbourne CD (1992) The MOS 36-item short-form health survey (SF-36). I. Conceptual framework and item selection. Med Care 30: 473–483. PMID:1593914
29. Herzberg PY, Glaesmer H, Hoyer J (2006) Separating optimism and pessimism: a robust psychometric analysis of the revised Life Orientation Test (LOT-R). Psychol Assess 18: 433–438. PMID:17154764 30. Glaesmer H, Rief W, Martin A, Mewes R, Brahler E, Zenger M, et al.(2012) Psychometric properties
and population-based norms of the Life Orientation Test Revised (LOT-R). Br J Health Psychol 17: 432–445. doi:10.1111/j.2044-8287.2011.02046.xPMID:22106985
31. ten Klooster PM, Weekers AM, Eggelmeijer F, van Woerkom JM, Drossaert CHC, Taal E, et al. (2010) Optimisme en/of pessimisme: Factorstructuur van de Nederlandse Life Orientation Test-Revised. Psy-chologie & Gezondheid 38: 89–100.
32. Brouwer D, Meijer RR, Weekers AM, Baneke JJ (2008) On the dimensionality of the Dispositional Hope Scale. Psychol Assess 20: 310–315. doi:10.1037/1040-3590.20.3.310PMID:18778168
33. Muthén LK, Muthén BO (2010) Mplus User's Guide. Los Angeles, CA: Muthén&Muthén.
34. Hu LT, Bentler PM (1999) Cutoff criteria for fit indexes in covariance structure analysis: Conventional criteria versus new alternatives. Structural Equation Modeling 6: 1–55.
35. Sijtsma K (2009) On the Use, the Misuse, and the Very Limited Usefulness of Cronbach's Alpha. Psy-chometrika 74: 107–120. PMID:20037639
36. Guttmann L (1945) A basis for analyzing test-retest reliability. Psychometrika 10: 255–282. PMID:
21007983
37. Millsap RE, Yun-Tein J (2004) Assessing Factorial Invariance in Ordered-Categorical Measures. Multi-variate Behavioral Research 39: 479–515.
38. Cheung GW, Rensvold RB (2002) Evaluating goodness-of-fit indexes for testing measurement invari-ance. Structural Equation Modeling 9: 233–255.
39. Reise SP (2012) The rediscovery of bifactor measurement models. Multivariate Behavioral Research 47: 667–696. PMID:24049214
41. de Rooij A, Steultjens MP, Siemonsma PC, Vollebregt JA, Roorda LD, Beuving W, et al. (2011) Overlap of cognitive concepts in chronic widespread pain: an exploratory study. BMC Musculoskelet Disord 12: 218. doi:10.1186/1471-2474-12-218PMID:21974867
42. Campbell P, Bishop A, Dunn KM, Main CJ, Thomas E, Foster NE (2013) Conceptual overlap of psycho-logical constructs in low back pain. Pain 154: 1783–1791. doi:10.1016/j.pain.2013.05.035PMID:
23726935
43. Mancuso CA, Graziano S, Briskie LM, Peterson MGE, Pellicci PM, Salvati EA, et al. (2008) Random-ized trials to modify patients' preoperative expectations of hip and knee arthroplasties. Clin Orthop Relat Res 466: 424–431. doi:10.1007/s11999-007-0052-zPMID:18196427
44. Iles RA, Taylor NF, Davidson M, O'Halloran P (2013) An effective coaching intervention for people with low recovery expectations and low back pain: A content analysis. J Back Musculoskelet Rehabil.