ACPD
8, 10627–10664, 2008Mixing processes and exchanges in the
tropical and the subtropical UT/LS
R. James and B. Legras
Title Page
Abstract Introduction
Conclusions References
Tables Figures
◭ ◮
◭ ◮
Back Close
Full Screen / Esc
Printer-friendly Version
Interactive Discussion Atmos. Chem. Phys. Discuss., 8, 10627–10664, 2008
www.atmos-chem-phys-discuss.net/8/10627/2008/ © Author(s) 2008. This work is distributed under the Creative Commons Attribution 3.0 License.
Atmospheric Chemistry and Physics Discussions
Mixing processes and exchanges in the
tropical and the subtropical UT/LS
R. James and B. Legras
Laboratoire de M ´et ´eorologie Dynamique UMR 8539, Paris, France
Received: 10 April 2008 – Accepted: 18 April 2008 – Published: 4 June 2008 Correspondence to: R. James ([email protected])
ACPD
8, 10627–10664, 2008Mixing processes and exchanges in the
tropical and the subtropical UT/LS
R. James and B. Legras
Title Page
Abstract Introduction
Conclusions References
Tables Figures
◭ ◮
◭ ◮
Back Close
Full Screen / Esc
Printer-friendly Version
Interactive Discussion
Abstract
Both in situ measurements and satellite observations indicate evidence of mixing in the upper troposphere (UT) and the lower-stratosphere (LS). In this study, the measure-ments performed during the Pre-AVE and Costa-Rica AVE campaigns are analysed with diffusive back-trajectories to assess mixing properties in the tropical and the sub-5
tropical UT/LS. A description of cross-tropopause pathways and mixing time scales is provided.
In the subtropics, Troposphere-Stratosphere mixing processes are found to differ in the vicinity of the tropopause and at higher altitudes. Below 350 K, the mixing line observed during Pre-AVE is shown to result from fast and local cross-tropopause ir-10
reversible exchange, involving two initially distant air masses with distinct chemical compositions. For measurements located above 350 K, mixing of the tropospheric air in the subtropical stratosphere occurs over a period of a month, the origins of the tropospheric source being localised in the tropical UT and the tropical boundary layer.
In the tropics, quantitative reconstructions of CO and O3profiles above 360 K are ob-15
tained for one month back-trajectories calculations, pointing out that long term mixing is essential to determine the chemical composition in the tropical ascent. In particular, the existence of two-way meridional irreversible exchanges between 360 and 450 K is found to export tropical air in the subtropical stratosphere and to entrain old strato-spheric air in the tropical ascent. Calculations of the Lagrangian mean age of air is 20
shown to be in qualitative agreement with the CO2observations and diabatic calcula-tions.
1 Introduction
One of the most intriguing features of the atmospheric flow is the existence of the tropopause. As defined from WMO, the tropopause is often seen as a roof vertically 25
ACPD
8, 10627–10664, 2008Mixing processes and exchanges in the
tropical and the subtropical UT/LS
R. James and B. Legras
Title Page
Abstract Introduction
Conclusions References
Tables Figures
◭ ◮
◭ ◮
Back Close
Full Screen / Esc
Printer-friendly Version
Interactive Discussion is inhibited by the stratification. The tropopause is hence seen as a mixing barrier
across which tracer profiles are expected to exhibit a jump in the vertical gradient. This is indeed the case for ozone and carbon monoxide profiles, and has led Pan et al.
(2004) to the definition of a “chemopause”, generally found slightly below the thermal tropopause.
5
However, a complementary approach emphasizing the role of horizontal transport between the troposphere and the stratosphere can also be proposed. Most of the vertical motion in the extratropics, especially during winter, is along sloping isentropic surfaces that transport and stir air between the boundary layer and the upper tropo-sphere in a matter of a few days or less in case of intense frontogenesis. Dynamical 10
constrains imply that isentropic surfaces cross the tropopause especially in the vicinity of upper level jets, which aretransport barriers(Chen,1995;Haynes and Shuckburgh,
2000b; Haynes et al., 2001). The tropopause is hence seen here as a vertical wall damping horizontal exchanges through the barrier effect of the jets.
The two views concerning the tropopause reconcile by separating the stratosphere 15
as a reservoir of potential vorticity, mainly maintained as stratification by radiative pro-cesses, from the troposphere where stratification and PV are destroyed by boundary layer processes and slantwise convection.
It is now widely admitted, from tracer measurements collected during airborne cam-paigns (Hoor et al.,2002;Pan et al.,2004) that the transition between the troposphere 20
and the stratosphere in the extratropics is not brutal but occurs over a mixing layer of a couple of kilometers, or 25 K, above the tropopause. Numerous studies have docu-mented the exchanges between the lowermost extratropical stratosphere and the up-per troposphere. As a matter of fact, Lagrangian analyses based on back-trajectories with a uniform initial distribution have shown that transport over a few days success-25
fully retrieve the main geographical locations of the exchanges (Wernli and Bourqui,
ACPD
8, 10627–10664, 2008Mixing processes and exchanges in the
tropical and the subtropical UT/LS
R. James and B. Legras
Title Page
Abstract Introduction
Conclusions References
Tables Figures
◭ ◮
◭ ◮
Back Close
Full Screen / Esc
Printer-friendly Version
Interactive Discussion still a matter of discussion. Among other constrains, limited resolution makes difficult
to distinguish transient, reversible, exchanges from irreversible exchanges (Wernli and
Bourqui,2002). Irreversible exchanges are responsible of the mixing of tropospheric and stratospheric air at molecular scale.
In the tropics the average motion is upward at the lapse-rate tropopause, and in-5
mixing of tropospheric air within the stratosphere is not limited to a shallow layer but shows a trace in the tape recorder signal deep in the stratosphere (Mote et al.,1996;
Neu and Plumb,1999) for the annual cycle. However, small-scale and fast fluctuations exhibit less penetration than at the subtropical latitudes (Patmore and Toumi,2006).
As described by the leaky tropical pipe model in Neu and Plumb (1999), the dis-10
tribution of tracers in the tropical troposphere is usually considered to result from the combined effect of mean ascending motion, vertical diffusion and limited exchanges with the extratropics (Waugh et al.,1997). There is evidence of more intense merid-ional exchanges in the lower stratosphere below 450 K than above (Waugh, 1996;
Haynes and Shuckburgh,2000a) and that a strong seasonal modulation affects both 15
hemisphere. A part of the tropical air newly entered in the stratosphere eventually mixes within the extratropics over a period estimated from 1 to 4 month (Volk et al.,
1996;Appenzeller et al.,1996;Rosenlof and McCormick,1997;Andrews et al.,2001;
Grewe et al.,2002). However, the vertical extension of this meridional exchange, how far it penetrates above the subtropical jet barrier (Haynes and Shuckburgh,2000b) and 20
its seasonal variations are still poorly documented from observations and models. Tracer-tracer relations have often been used to assess mixing properties in the at-mosphere (Plumb,2007). The CO/O3relation is particularly useful at the tropopause because CO, which has sources at the surface, reaches mixing ratio of 100 ppmv or more in the troposphere and relaxes to about 12 ppbv within a couple of months in the 25
stratosphere while O3is mainly of stratospheric origin and is short lived (a few days) in the troposphere. Hence one expects (Fischer et al.,2000;Hoor et al.,2002;Pan et al.,
ACPD
8, 10627–10664, 2008Mixing processes and exchanges in the
tropical and the subtropical UT/LS
R. James and B. Legras
Title Page
Abstract Introduction
Conclusions References
Tables Figures
◭ ◮
◭ ◮
Back Close
Full Screen / Esc
Printer-friendly Version
Interactive Discussion due to injection of tropospheric air within the stratosphere.
Although this hypothesis is supported by a number of observations, it has been sel-dom checked to be consistent with atmospheric dynamics. As a quantitative assess-ment, the advection of passive tracer in the CLaMS model has pointed out that the CO/O3 relationships in the vicinity of the extratropical tropopause could effectively be 5
explained from TS mixing (Pan et al.,2006). However, previous studies have limited the integrations of trajectories to relatively short time-scale that did not allow to investigate TS transport and mixing processes in the tropics or above 360 K at higher latitudes.
This work investigates mixing properties across the tropopause using long La-grangian integration times up to 35 days and a representation of turbulent dispersion by 10
Feynman-Kac method. The model is applied to the analysis of in situ measurements in the tropical and subtropical UT/LS. Section 2 presents the Pre-AVE and CR-AVE dataset used in this work. Section3presents the numerical methods. Section4shows the results for the case of a mixing line in the subtropics. Section5discusses mixing processes above 350 K in the subtropics and Sect.6 discusses mixing time-scale in 15
the tropics. Section7offers further discussion and conclusions.
2 In-situ measurements
2.1 Campaigns and instruments
The Pre-AVE and the Costa-Rica AVE campaigns took place respectively in winter 2004 and winter 2006 over the Gulf of Mexico and Costa-Rica (Fig.1). They are part 20
of the six AURA Validation Experiments (AVE) planed by the NASA to validate the AURA satellite. With 12 tropical flights on board of the WB-57, the Pre-AVE and the Costa-Rica AVE campaigns provide the largest dataset collected by an instrumented stratospheric plane in the tropics providing an homogeneous dataset for CO and O3. Spanning the range of altitudes between 350 K and 450 K in potential temperature, the 25
ACPD
8, 10627–10664, 2008Mixing processes and exchanges in the
tropical and the subtropical UT/LS
R. James and B. Legras
Title Page
Abstract Introduction
Conclusions References
Tables Figures
◭ ◮
◭ ◮
Back Close
Full Screen / Esc
Printer-friendly Version
Interactive Discussion of the cross-tropopause processes in this region. A number of additional subtropical
flights during the same campaigns allow direct comparisons of mixing properties be-tween tropics and extratropics.
Ozone was measured at 1 Hz frequency by the NOAA Dual-Beam UV-absorption ozone photometer (Proffitt et al., 1989) with a relative precision of 5 ppbv (average 5
uncertainty 5%). The carbon monoxide has been measured at 0.5 Hz (with 8 s cal-ibration gaps 10 or 20 s) by the ARGUS DIAL instrument (Loewenstein et al.,2002;
Lopez et al.,2006), providing a precision of near 2 ppbv (3%). The carbon dioxide has been measured with the non dispersive absorption CO2 analyser, which is calibrated in flight, at 1 Hz with precision of 50 to 100 ppbv (Daube et al.,2002). Temperature, 10
pressure and position are recorded at 1 Hz, providing an horizontal resolution of near 250 m and a vertical resolution during ascent and descent of near 10 m.
In order to distinguish the tropical and the extratropical signatures, we have selected two well-separated subsets among the flights of the WB-57 (Table1). The tropical set contains twelve flights performed equatorward of 10◦N. The subtropical set contains 15
two flights performed poleward of 30◦N. Flights performed at intermediate latitudes have been discarded from our analysis. The two meteorological situations associated to the selected flights in the subtropical ensemble exhibit properties (tropopause alti-tude, tropopause folds, ...) which are characteristic of the extratropics. The presence of such dynamical features allow a direct comparison with the SPURT dataset in the 20
extratropics (Hoor et al.,2004).
2.2 Tracer-tracer relationship and mixing
Figure2shows the distributions of CO and O3as a function of altitude and the CO/O3 diagram for the two sets of tropical and subtropical flights which are superimposed for comparison.
ACPD
8, 10627–10664, 2008Mixing processes and exchanges in the
tropical and the subtropical UT/LS
R. James and B. Legras
Title Page
Abstract Introduction
Conclusions References
Tables Figures
◭ ◮
◭ ◮
Back Close
Full Screen / Esc
Printer-friendly Version
Interactive Discussion 2.2.1 Sub-tropics
In the subtropics, a CO/O3 relationship connecting pure tropospheric values of CO (>100 ppbv) to stratospheric values of ozone (>200 ppbv) is captured by one of the two subtropical flights. Observed betweenθ=320 and 350 K, the linearity of the dis-tribution is highly suggestive of a mixing line, and will be referred in the sequel as 5
the dynamical tropopause relationship. Such kind of CO/O3 relationships have been first identified in (Hoor et al.,2002), and then frequently observed in the extratropics. Idealised tracer experiment in CLaMS model have made clear that those particular distributions of tracer are determined by cross-tropopause mixing (Pan et al.,2006).
We would like here to emphasize that a true mixing line requires the mixing event to 10
occur between two air masses initially distant in chemical composition. This processes differs from the case where a column of air spanning the tropopause, and sampling both tropospheric and stratospheric branches of the CO/O3 diagram, is mixed. In the first case, the mixing result from the irreversible exchange between two identified sources, the chemical composition of each parcel being determined by the proportion of air 15
issued from one of the sources at the end of the mixing event. All the mixtures lie on the same mixing line, and an unique relationship can be retrieved along any transect across the mixed region. In the second case, mixing is allowed between air parcels with composition distributed in the CO-O3plane. Unless this initial distribution is a line, the mixing line is not unique and appears as an artifact of sampling along the flight 20
track.
In the subtropics and extratropics, two mechanisms can perform mixing between two air masses of distant initial composition: the ascent along the warm conveyor belt (Wernli and Bourqui,2002), and the detrainment of deep convective clouds above the tropopause (Mullendore et al.,2005). We show in Sect. 4that the first mechanism is 25
indeed responsible of the observed mixing line.
ACPD
8, 10627–10664, 2008Mixing processes and exchanges in the
tropical and the subtropical UT/LS
R. James and B. Legras
Title Page
Abstract Introduction
Conclusions References
Tables Figures
◭ ◮
◭ ◮
Back Close
Full Screen / Esc
Printer-friendly Version
Interactive Discussion split apparently in two subsets, the smaller one being superimposed onto the tropical
branch while most of them are distributed along an other branch with a steeper slope reaching higher O3values. The existence of a separate branch overlaying the tropical branch is an indication that some of the air in the subtropics has intruded recently from the tropics. This interpretation is supported byHoor et al.(2004,2005) who have 5
suggested that meridional mixing of upper tropospheric tropical air in the lowermost extratropical stratosphere could be responsible of the slope discontinuity in the CO/O3 relationship that they found at∆θ=25 K above the tropopause. Here we find also, that the junction between the dynamical tropopause relationship and the main branch of the subtropical stratospheric relationship is located at 350 K, around 25 K above the 10
tropopause. The fact that the subtropical stratospheric relationship extends below this meeting point at 350 K is an additional indication of in-mixing with tropospheric tropical air above the layer of the dynamical tropopause relationship.
In the stratosphere, mixing processes are produced by intermittent poaches of tur-bulence combined with horizontal stirring and fluctuations in the heating rate, inducing 15
fluctuations of cross-isentropic motion. Estimations of the large-scale vertical diff u-sions fall within a range of 0.1–0.5 m2s−1at mid-latitudes, which correspond to much slower mixing processes than in the vicinity of the tropopause. We will show in Sect.5
how the mixing properties of the subtropical stratosphere can be related to the tropical tropospheric impact in this region.
20
2.2.2 Tropics
In the tropics, it is easy to distinguish a tropospheric branch with low values of O3and CO ranging from 40 ppbv to 120 ppbv below 380 K and, a stratospheric branch with O3 above 100 ppbv and CO below 60 ppbv above. The absence of mixing lines in the 12 flights of the Pre-AVE and CR-AVE dataset and the striking compactness of 25
ACPD
8, 10627–10664, 2008Mixing processes and exchanges in the
tropical and the subtropical UT/LS
R. James and B. Legras
Title Page
Abstract Introduction
Conclusions References
Tables Figures
◭ ◮
◭ ◮
Back Close
Full Screen / Esc
Printer-friendly Version
Interactive Discussion
3 Methods
3.1 Reconstruction
As argued before, CO-O3 relationship suggests that the lower tropical and extratrop-ical stratosphere separates into several layers and mixing regimes according to the tropospheric influence.
5
In order to determine how tracer distribution is controlled by advection and turbu-lent diffusion in the vicinity of the tropopause, we investigate how Lagrangian diffusive reconstructions are able to explain the observed tracer relationship.
The deterministic part of the Lagrangian reconstruction method used in this study is based on the reverse integration of trajectories with TRACZILLA, a modified version of 10
FLEXPART (Stohl et al.,2005) which uses winds from the European Centre of Medium range Weather Forecast (ECMWF) projected on a latitude-longitude grid with 0.5◦ res-olution in the horizontal and on 60 hybrid levels in the vertical (91 in 2006 for CR-AVE), with 3-h temporal resolution obtained by combining analysis available every 6 h with short time forecasts at intermediate times. Trajectories are initialized along the flight 15
track at 1 Hz resolution and then integrated backwards over 40 days. We interpolate the ECMWF potential vorticity and potential temperature along the trajectory in order to localize our parcel with respect to the tropopause.
In order to take into account that each air parcel is actually a mixture of particles from various origin we split each parcel intoM particles released from the same point. 20
These particles are submitted to an additional random noise in the vertical that repre-sent the turbulent diffusionDdue to small-scale motion missing in the ECMWF winds (Legras et al.,2005). We choose this procedure instead of an arbitrary initial separa-tion because it is consistent with the underlying physics and also because the applied diffusion can be estimated from the comparison of small-scale observed tracer fluctu-25
ACPD
8, 10627–10664, 2008Mixing processes and exchanges in the
tropical and the subtropical UT/LS
R. James and B. Legras
Title Page
Abstract Introduction
Conclusions References
Tables Figures
◭ ◮
◭ ◮
Back Close
Full Screen / Esc
Printer-friendly Version
Interactive Discussion Notice that large-scale motion is here explicitly taken into account and that the added
diffusion is meant to represent the small-scale processes and differs from the large-scale diffusion mentioned in Sect. 2.2. Notice also that the added diffusion governs dispersion of the cloud of points associated with each parcel only during the first days of the integration, after which dispersion is mainly due to the wind strain.
5
The reconstructed value of the tracer is obtained by averaging the values of the tracer at the locations reached by the particles at the end of the reverse integration. Potential vorticity is provided by the ECMWF analysis while chemical tracers are provided by the three-dimensional chemistry-transport model REPROBUS (REactive Processes Rul-ing the Ozone BUdget in the Stratosphere) which uses a comprehensive treatment of 10
gas-phase and heterogeneous chemical processes in the stratosphere (Lef `evre et al.,
1994, 1998). Long lived species, including ozone, are transported by a semi- La-grangian scheme forced by the ECMWF wind analysis. The model is integrated on 42 hybrid pressure levels that extend from the ground up to 0.1 hPa.
When diffusionDis set to zero or is very small, the origin of each parcel is found to 15
be localized even after several weeks and is very sensitive to the initial location. As a result, the fluctuations of a reconstructed tracer grow indefinitely with time whenD=0 or saturate to very high values whenD is too small. In previous work (Legras et al.,
2005),D was adjusted in order to fit the observed fluctuations. Here we need also to take into account the errors of the analyzed wind field used in the reconstruction which 20
are usually larger in the tropics than at mid and high latitudes, in particular regarding the divergent circulation.
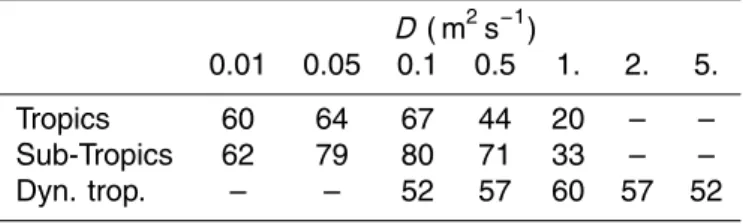
Consequently, we retain only the parcels for which the ozone reconstruction provides a value which deviates from the observed value by less than 30% and we adjustD in order to maximize the percentage of retained parcels. Table2shows that this minimum 25
ACPD
8, 10627–10664, 2008Mixing processes and exchanges in the
tropical and the subtropical UT/LS
R. James and B. Legras
Title Page
Abstract Introduction
Conclusions References
Tables Figures
◭ ◮
◭ ◮
Back Close
Full Screen / Esc
Printer-friendly Version
Interactive Discussion The dynamical tropopause value is consistent with the results of Pisso and Legras
(2008). The lower value in the upper subtropics and tropics is similar to that found in the extratropical stratosphere byLegras et al.(2005) and in agreement with the values estimated byMote et al.(1996) in the tropical ascent.
3.2 Stratospheric air proportion 5
As the cloud of particles merging into a given parcel evolves backward in time, its distribution among the stratosphere and the troposphere allows to determine in which proportion stratospheric and tropospheric air mix within the parcel.
Potential temperature and potential vorticity are interpolated along the backward tra-jectories in order to determine the location with respect to the tropopause. Particles 10
with a potential vorticity exceeding 4 10−6K kg−1m2s−1or with a potential tempera-ture above 380 K are labeled as stratospheric while the other ones are considered as tropospheric.
TheStratospheric Air Proportion(SAP) is then defined for each parcel and for a given reconstruction time as the proportion of backward trajectories among M which are 15
located in the stratosphere at that time.
3.3 Age of air
The mean age of air (Waugh and Hall, 2002) is defined as the mean duration since a parcel entered the stratosphere. This age can be estimated from our calculations by averaging this duration, for each parcel, over the particles which have crossed. A 20
generalized age is defined by choosing a reference surface which is not the tropopause, like an isentropic surface within the TTL.
The mean age of air can also be estimated, followingPark et al.(2007), using CO2as an age marker. During January-February, CO2 exhibits a global trend of 28–30 ppbv per day. Since the accuracy of the Harvard instrument on board the WB-57 is 50– 25
ACPD
8, 10627–10664, 2008Mixing processes and exchanges in the
tropical and the subtropical UT/LS
R. James and B. Legras
Title Page
Abstract Introduction
Conclusions References
Tables Figures
◭ ◮
◭ ◮
Back Close
Full Screen / Esc
Printer-friendly Version
Interactive Discussion 2–3 days. The calculation is as follows. First, we reduce all the CO2 profiles of the
CRAVE campaign to a single date chosen on 19 January 2006 by shifting all data by a flat 30 ppbv per day tendency. This generates thereducedCO2. Then we calculate the age at a given altitude from the difference between the measured CO2 and the average concentration at a reference level chosen as an isentropic surface (360, 370 5
or 380 K), converted into an age dividing by the same flat tendency as aforementioned. This procedure is essentially identical to that used inPark et al.(2007).
4 Mixing time-scale in the subtropical dynamical tropopause
In Fig.3, we compare observed CO and O3for the dynamical tropopause layer defined in Sect.2.2with the SAP calculated from backward trajectories and several definitions 10
of the tropopause. In the left two panels, where the SAP is calculated after an integra-tion of 2 days, there is no visible relaintegra-tion between tracer value and SAP. In the right two panels where back-trajectories are integrated over 9 days, a linear relation emerges for both CO and O3mixing ratios.
This result provides a stringent confirmation that the dynamical tropopause relation-15
ship is correctly interpreted as a mixing line between a tropospheric source and a stratospheric source. Indeed, if chemistry was driving CO and O3over the considered time-scale, there would be no reason to obtain a relation with a quantity that depends purely on transport and mixing. Note that, this result does not depend on the precise PV value chosen to define the tropopause, as shown by the different grey ensembles 20
in Fig.3.
However, the linear relation between SAP and the tracers is only obtained after a minimum integration time which is required for the cloud of particles merging into a single parcel to sample the stratospheric and tropospheric origins. This time can be seen as a mixing time required to mix stratospheric and tropospheric air into the parcel. 25
ACPD
8, 10627–10664, 2008Mixing processes and exchanges in the
tropical and the subtropical UT/LS
R. James and B. Legras
Title Page
Abstract Introduction
Conclusions References
Tables Figures
◭ ◮
◭ ◮
Back Close
Full Screen / Esc
Printer-friendly Version
Interactive Discussion to a fast meso-scale event.
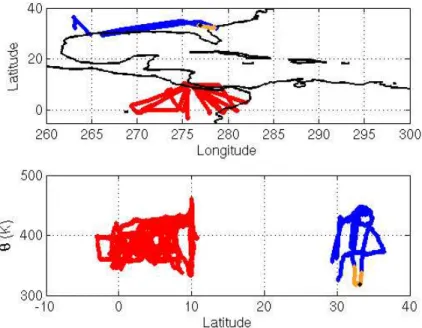
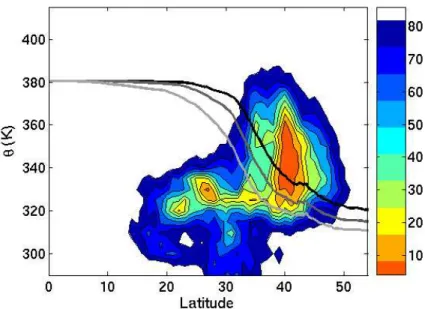
In order to investigate further the tropospheric and stratospheric sources, Fig. 4
shows the probability density function (pdf) of the reconstructed locations of particles that contribute to the dynamical tropopause relationship after 9 days of backward in-tegration. The distribution exhibits a striking bimodality with two clusters that separate 5
both in altitude and latitude, one being located within the troposphere, near 25◦N and 330 K, equatorward to the jet, and the other one in the extratropical stratosphere, near 40◦N with a distribution of potential temperature from 320 K to 360 K that matches that of the mixing line in Fig.2.
Interestingly, the sources are separated by a distance of 1500 km, which is on the 10
order of a Rossby radius at those latitudes. The existence of a link between the two clusters in Fig.4around the isentrop 325 K and the fairly small latitudinal extend of the origins of stratospheric parcel suggest that the transport that brought the tropospheric and stratospheric parcels together has been first accomplished by quasi-isentropic mo-tion followed by cross-isentropic mixing. As a matter of fact, the flight track crossed a 15
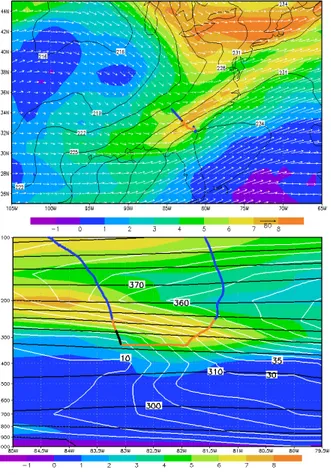
region of wind shear on the north side of a jet streak as shown in the upper panel of Fig.5. Such situations are often associated with upper level fronts. Indeed, the vertical cross-section along a direction approximating the flight track, shown in the lower panel of Fig.5, exhibits the typical pattern of a folded tropopause, embedding the portion of the flight track associated with the mixing line, within the layer 320–350 K. The rela-20
tively flat shape of the isentropic surfaces with respect to the slope of the PV distribution within the front (realized mostly as shear) is an indication that the flight occurred during the decay of the front, after flattening of the isentropic surfaces by the cross-frontal circulation and shear induced mixing beneath the jet. This scenario has been checked to be consistent with the upstream evolution of the front over the previous four days 25
ACPD
8, 10627–10664, 2008Mixing processes and exchanges in the
tropical and the subtropical UT/LS
R. James and B. Legras
Title Page
Abstract Introduction
Conclusions References
Tables Figures
◭ ◮
◭ ◮
Back Close
Full Screen / Esc
Printer-friendly Version
Interactive Discussion
5 TS mixing above the dynamical tropopause
In this section, we investigate the TS mixing above the dynamical tropopause in a range ofθvalues larger than 350 K. We expect mixing times larger than those associated with mid-latitude synoptic perturbation due to the limited impact of the tropospheric intru-sion at this altitude. Figure6 compares the mixing ratios of CO and O3 as a function 5
of the SAP after 9 and 35 days. After 9 days, both species exhibit almost constant compositions for SAP lower than 50% whereas, for large SAP, the mean mixing ratio is not an invertible function of SAP and the dispersion for a given SAP is large.
The non existence of a clear relation between SAP and tracer mixing ratios indicates that the particles have not yet been sorted into well defined tropospheric and strato-10
spheric ensembles over 9 days. We infer from this result that although some tropo-spheric air may have been stirred with stratotropo-spheric air over the range of one week by reversible exchanges, this duration is insufficient to perform mixing down to the molec-ular scale and impacts on the air composition. In contrast, for trajectories integrated over a period of one month, compact quasi-linear relations are retrieved between SAP 15
and tracers for the whole range of tracer values. This bijective relation allows a quanti-tative estimate of the mixing ratio of each measured species from the proportion of the air parcel which was in the troposphere one month before. In agreement with in situ measurements studies from the SPURT dataset (Hoor et al.,2004,2005), this result indicates that the chemical composition of the subtropical parcels above 350 K results 20
from long-term mixing processes across the tropopause. This cannot be confused with an effect of neglected chemistry since the same relationship is observed for CO and O3.
Figure 7 shows the distribution of the subtropical particles after an integration of 35 days. Here, it is clear that the main source is found in the TTL northward of 25
ACPD
8, 10627–10664, 2008Mixing processes and exchanges in the
tropical and the subtropical UT/LS
R. James and B. Legras
Title Page
Abstract Introduction
Conclusions References
Tables Figures
◭ ◮
◭ ◮
Back Close
Full Screen / Esc
Printer-friendly Version
Interactive Discussion Shuckburgh, 2000b). Closer to the equator, the distribution broadens in the
tropo-sphere and extends to the ground. This feature emphasizes the contribution of tropical convection to the chemical composition of the extratropical “overworld” suggested by
Desler and Scherwood(2004). It shows that, even in northern winter, a part of the sub-tropical parcels initialised above 360 K are found to originate from the sub-tropical boundary 5
layer after being lifted up to about 350 K by convective transport. Interestingly, no tropo-spheric sources are found at higher latitudes than 30◦N. This discards the hypothesis of a subtropical or extratropical tropospheric source to explain the trace gas composi-tion observed in this region above 350 K. Hence, the fast and local mixing events close to the tropopause appear as limited to a shallow layer, and are not able to significantly 10
impact the overlaying levels, even by the diffusive upward propagation over long time scale. This analysis confirms that above the tropopause layer the composition of the lower stratosphere is controlled by long term mixing between the tropical tropospheric air advected from the TTL with stratospheric air from the overworld. In the continu-ity of in situ observation ofHoor et al.(2004) in the extratropics, the TTL is shown to 15
act as a tropospheric reservoir for the lower stratosphere at higher latitude. The wide range of latitudes found for parcel origins within the TTL establishes the importance of the meridional exchanges for the subtropical lower stratosphere, a feature that sig-nificantly differs from the stronger role of atmospheric descent from the overworld at higher latitudes (Appenzeller et al.,1996).
20
6 Mixing time-scale at the tropical tropopause
6.1 Long term stratospheric mixing at the tropical tropopause
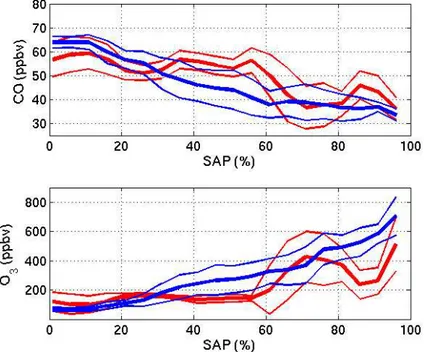
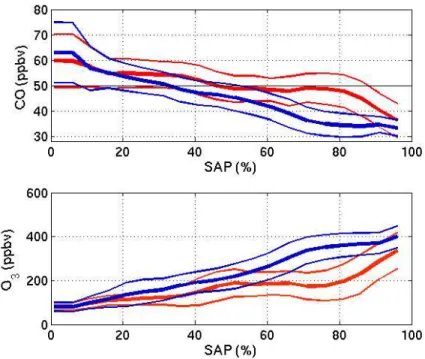
We now discuss the relation between SAP and tracers in the tropics in the layer be-tween 340 and 450 K. Following the same approach as in Sect. 5, CO and O3 are represented as a function of the SAP in Fig.8.
25
ACPD
8, 10627–10664, 2008Mixing processes and exchanges in the
tropical and the subtropical UT/LS
R. James and B. Legras
Title Page
Abstract Introduction
Conclusions References
Tables Figures
◭ ◮
◭ ◮
Back Close
Full Screen / Esc
Printer-friendly Version
Interactive Discussion not exhibit organised relations with the stratospheric air proportion issued from short
time calculations. Indeed, for most values, the SAP does not distinguish CO or O3 mixing ratios when an integration time of 9 days is used. For instance, a concentration of 50 ppbv in CO corresponds to SAP values ranging from a purely tropospheric to an almost purely stratospheric composition (90%), highlighting that the relation between 5
the tracers and the SAP values is very weak for this time.
In the opposite, the back-trajectories retrieve quasi-linear and bijective relations with in situ tracer measurements when the SAP is calculated over 35 days. Here, the large dispersion of the CO concentrations found for the parcels close to a pure tropospheric proportion is an effect of the heterogeneity of tropospheric sources for CO. Indeed, 10
a very weak dispersion is found in the identical range of SAP values when ozone measurements are considered.
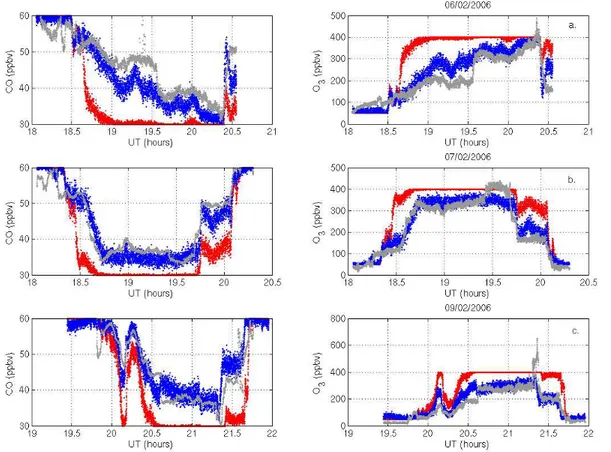
However, it is important to assess whether the dispersion of points within the lower panels of Fig.8is due to the variability among the 11 flights or whether the dispersion occurs within each flight. This is equivalent to test the ability of SAP to reconstruct 15
tracer transect during each flight. For each tracer χ, the SAP is used to predict the valueχ(t) along the flight track as
χ =(1−SAP)∗χT +SAP∗χS (1)
whereχT andχS are respectively pure tropospheric and pure stratospheric values of the tracer, chosen as COT=60 ppbv, COS=35 ppbv, O3
T
=50 ppbv and O3
S
=200 ppbv 20
corresponding to observed values at, respectively 360 K and 430 K. Figure9 shows three selected flights from CR-AVE, demonstrating that the reconstructions are able to reproduce most of the variations observed along the flight track after 35 days but fails dramatically after only 9 days. An average mean standard error of 7% is found for the reconstructed CO profiles and 15% for O3 profiles when 35-day back-trajectories 25
ACPD
8, 10627–10664, 2008Mixing processes and exchanges in the
tropical and the subtropical UT/LS
R. James and B. Legras
Title Page
Abstract Introduction
Conclusions References
Tables Figures
◭ ◮
◭ ◮
Back Close
Full Screen / Esc
Printer-friendly Version
Interactive Discussion 6.2 Slow ascent in the tropics
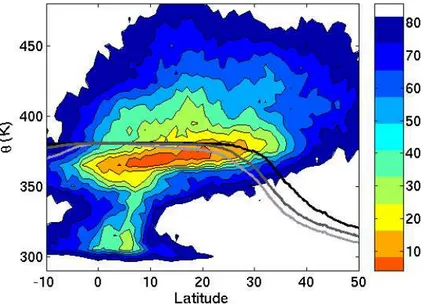
In order to investigate the pathways followed by the cross-tropopause transport in the tropics, Fig.10 shows the distribution of the tropical parcels after an integration of 35 days.
Interestingly, the observed pattern seems to indicate that both vertical and merid-5
ional mixing across the tropopause are efficients in the tropical UT/LS. The two cores of the distribution found around 360 K and 400 K, below and above the tropopause respectively, are associated with an initial bimodality in the flight levels. However, it is significant that this upper maximum does not expand in latitude over 35 days while the lower core extends to 20◦N. The third core of the distribution found near the ground 10
marks the role of convective transport from the boundary layer.
At extratropical latitudes, a large hemispheric asymmetry is found in the distribution of the particles. Poleward to 10◦N, an important contribution of the winter subtropics is found between 380 K and 430 K whereas a strong meridional gradient at 10◦S marks the isolation of the tropics from the Southern hemisphere above 380 K. In particular, 15
the upward slope on the northern flank of the distribution in the TTL suggests an in-fluence of the winter subtropical jet in the entrainment of subtropical air in tropics. In the northern hemisphere, isentropic exchanges poleward 30◦N are not allowed below 360 K, while above 380 K subtropical air is transported from the winter hemisphere as far as 40◦N into the tropics. This result is in agreement with the existence of a mix-20
ing layer above the subtropical jet that entrains subtropical air and dumps isentropic transport in the core of the jet (Konopka et al.,2007).
However, a much smaller proportion of particles originates from the subtropics at higher altitudes above 430 K. This inhibition of meridional exchanges in the tropical ascent is a clear signature of the tropical pipe. From Fig.10, the isolation of the tropics 25
ACPD
8, 10627–10664, 2008Mixing processes and exchanges in the
tropical and the subtropical UT/LS
R. James and B. Legras
Title Page
Abstract Introduction
Conclusions References
Tables Figures
◭ ◮
◭ ◮
Back Close
Full Screen / Esc
Printer-friendly Version
Interactive Discussion the region located between the entry in the TTL and the bottom of the tropical pipe is
seen as driven by mixing processes coupling the vertical ascent in the tropics to the entrainment of subtropical air by irreversible meridional exchanges between 380 K and 430 K. The air newly entered in the TTL is progressively mixed within the stratosphere, leading to the slow modification of the trace gas composition along the tropical ascent. 5
Hence, poleward transport of tropical air in the subtropical LS (Sect.5) and equator-ward transport of subtropical air in the tropical ascent are identified in the layer extend-ing from the top of the winter subtropical jet to the isentrope 430 K. The existence of this two-way exchange layer is in agreement with the general understanding of the merid-ional transport in the region and offers a clarification of the structure of the exchanges 10
between the the subtropical LS and the tropical UT/LS. Focusing on measurements performed during two boreal winters, the entrainment of stratospheric air in the tropi-cal band is shown to exhibit a strong seasonal pattern, suggesting the existence of an annual cycle of the hemisphere involved.
6.3 Age of air 15
Figure11a shows the mean vertical velocity of particles during their residence in the tropical band 10◦S–10◦N as a function of altitude. The value between 360 K and 370 K lay in the range 1 to 2.5 mm s−1 which is consistent with the estimate of Park
et al. (2007). However, above this level and up to 460 K, vertical velocities are smaller than 1 mm s−1. This result is also consistent with diabatic calculations ofRandel et al.
20
(2007) who have estimated velocity of 0.6 mm s−1at 17.5 km during winter, and shows that the vertical velocity is not homogeneous in the tropical band. Particularly, between 390 K and 400 K, a shallow layer exhibits negative velocities which might be due to the special sampling provided by the particles launched from Pre-AVE and CR-AVE flights but, nevertheless, shows that mean transport alone cannot carry tracer upward. The 25
ACPD
8, 10627–10664, 2008Mixing processes and exchanges in the
tropical and the subtropical UT/LS
R. James and B. Legras
Title Page
Abstract Introduction
Conclusions References
Tables Figures
◭ ◮
◭ ◮
Back Close
Full Screen / Esc
Printer-friendly Version
Interactive Discussion maximum in the amplitude of the annual cycle of CO and a very small residual vertical
velocity.
Figure 11b shows the CO2-age as a function of potential temperature. This figure mirrors the distribution of reduced CO2in the vertical and exhibits a quasi-linear profile above 360 K in agreement with Park et al. (2007). These authors found that recent 5
injections by convection explains the variability of CO2below 360 K while, above this level, mixing and slow ascent in the TTL generates a compact relation with the potential temperature. We found, however, that using 370 K instead of 360 K as a reference level provides a more compact relation, thus we use the isentrope 370 K in the following to determine the mean age of air. Note that horizontal segments that departs from the 10
main branch are due to contrail sampling.
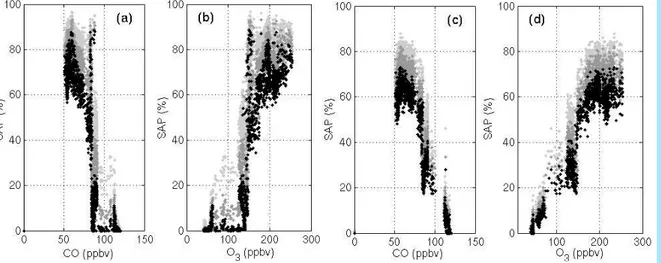
Figure 11c shows the distribution of the age of air from trajectory calculations as a function of reduced CO2. The age is truncated at 35 days by the length of the trajectories but nevertheless exhibits a linear relation over the range 5 to 30 days with a slope of 43 ppbv per day. This is slightly larger but consistent with the observed 15
tendency of CO2.
The last panel of Fig.11shows the age of air determined from the trajectories as a function of the CO2-age. Although there is a significant dispersion, the mean relation is close to the median up to 25 days indicating a good agreement between the two esti-mates of the age of air. This indicates that the distribution of vertical motion determined 20
from trajectory calculations is in agreement with CO2observations.
7 Conclusions
We have used a Lagrangian model of diffusive back-trajectories to quantify the impact of Troposphere-Sratosphere mixing in airborne tracer observations. This model has been applied to aircraft measurements in the tropics and the subtropics at different 25
ACPD
8, 10627–10664, 2008Mixing processes and exchanges in the
tropical and the subtropical UT/LS
R. James and B. Legras
Title Page
Abstract Introduction
Conclusions References
Tables Figures
◭ ◮
◭ ◮
Back Close
Full Screen / Esc
Printer-friendly Version
Interactive Discussion explained by the proportion of stratospheric and tropospheric air estimated from our
model with analysed winds.
In the subtropics, we have analysed a mixing line observed below 350 K and shown that it resulted from cross-tropopause mixing generated by an active frontogenesis event on the time scale of one week. The description of this cross-tropopause path-5
way is in agreement with previous results on the characterization of irreversible TS exchange close to the subtropical tropopause (Wernli and Bourqui,2002; Pan et al.,
2006). In particular, back-trajectories have retrieved the tropospheric and the strato-spheric sources involved in the mixing event, showing that the two initial air masses were meridionally separated by more than 1500 km and had two distinct chemical 10
compositions. Such exchange processes are favored near the jet stream where isen-tropic surfaces intersect the tropopause, but are most certainly active locally along jet streaks at higher latitude, where similar tracer-tracer relationships are observed (Hoor
et al.,2002;Pan et al.,2004).
Above 350 K, the localisation of the tropospheric source confirms that the transport 15
of tropical air across the tropopause is the main pathway involved in the TS irreversible exchanges in the subtropics at this altitude. From the analysis of the stratospheric air proportion, we have determined a time-scale of one month for such cross-tropopause mixing. This is relatively shorter but agrees with the current results issued from in situ (Rosenlof and McCormick,1997;Hoor et al.,2005) and model studies (Andrews et al., 20
2001). The overall description provided is consistent with the existence of a mixing layer above the subtropical jet as identified byKonopka et al.(2007).
In the tropics, below 360 K, the Lagrangian analysis retrieves a purely tropospheric origins of the measurements, which is consistent with the large CO observed variability and with the impact of the convection identified byPark et al.(2007). Above 360 K, the 25
ACPD
8, 10627–10664, 2008Mixing processes and exchanges in the
tropical and the subtropical UT/LS
R. James and B. Legras
Title Page
Abstract Introduction
Conclusions References
Tables Figures
◭ ◮
◭ ◮
Back Close
Full Screen / Esc
Printer-friendly Version
Interactive Discussion stratospheric composition above 450 K. In particular, the large asymmetry observed in
the distribution of the stratospheric parcels points to the role of the winter subtropical jet to generate a meridional exchange between 360 K and 450 K.
In their study,Park et al.(2007) conclude that the vertical profile of CO2is insensitive to diffusion. This conclusion is reached by fitting a purely advective law to a quasi-linear 5
profile, excluding de facto any influence of diffusion. If, however, the vertical velocity is not left as a free parameter but is made consistent with mass conservation and heating rates, then an equally good fit to the observations can be obtained with some finite diffusion. Hence, our study, where the diffusion induced by fluctuations is shown to be essential in determining the vertical profiles of tracers is not contradicted byPark
10
et al. (2007). There is, however, a source of uncertainty in using vertical velocities from operational analysis which are known to contain a significant amount of spurious noise (Legras et al.,2005). Further studies using recent reanalysis and heating rates instead of vertical velocities are required to clarify this issue.
References
15
Andrews, A. E., Boering, K. A., Wofsy, S. C., Daube, B. C., Jones, D. B., Alex, S., Loewenstein, M., Podolske, J. R., and Strahan, S. E.: Empirical age spectra for the lower tropical strato-sphere from in situ observations of CO2: Quantitative evidence for a sub-tropical barrier to horizontal transport, J. Geophys. Res., 106, 32 295–32 314, doi:10.1029/2001JD000465, 2001. 10630,10646
20
Appenzeller, C., Holton, J. R., and Rosenlof, K. H.: Seasonal variation of mass transport across the tropopause, J. Geophys. Res., 101, 15 071–15 078, doi:10.1029/96JD00821, 1996. 10630,10641
Chen, P.: Isentropic cross-tropopause mass exchange in the extratropics, J. Geophys. Res., 100, 16 661–16 674, doi:10.1029/95JD01264, 1995.10629,10639
25
ACPD
8, 10627–10664, 2008Mixing processes and exchanges in the
tropical and the subtropical UT/LS
R. James and B. Legras
Title Page
Abstract Introduction
Conclusions References
Tables Figures
◭ ◮
◭ ◮
Back Close
Full Screen / Esc
Printer-friendly Version
Interactive Discussion
Desler, A. E. and Scherwood, S. C.: Effect of convection on the summertime extratropical lower stratosphere, J. Geophys. Res., 109, D23301, doi:10.1029/2004JD005209, 2004. 10641
Fischer, H., Wienhold, F. G., Hoor, P., Bujok, O., Schiller, C., Siegmund, P., Ambaum, M., Scheeren, H. A., and Lelieveld, J.: Tracer correlations in the northern high latitude lowermost stratosphere: Influence of cross-tropopause mass exchange, Geophys. Res. Lett., 27, 97–
5
100, doi:10.1029/1999GL010879, 2000. 10630
Grewe, V., Reithmeier, C., and Shindell, D.: Dynamic-chemical coupling of the upper troposphere and lower stratosphere region, Chemosphere, 47, 851–861, doi:10.1016/ S0045-6535(02)00038-3, 2002. 10630
Haynes, P. H. and Shuckburgh, E.: Effective diffusivity as a diagnostic of atmospheric transport.
10
Part I: stratosphere, J. Geophys. Res., 105, 22 777–22 794, doi:10.1029/2000JD900093, 2000a.10630
Haynes, P. H. and Shuckburgh, E.: Effective diffusivity as a diagnostic of atmospheric transport. Part II: troposphere and lower stratosphere, J. Geophys. Res., 105, 22 795–22 810, doi: 10.1029/2000JD900092, 2000b.10629,10630,10640
15
Haynes, P. H., Scinocca, J. F., and Greenslade, M. D.: Formation and maintenance of the extratropical tropopause by baroclinic eddies, Geophys. Res. Lett., 28, 4179–4182, doi:10. 1029/2001GL013485, 2001. 10629
Hoor, P., Fischer, H., Lange, L., Lelieveld, J., and Brunner, D.: Seasonal variations of a mixing layer in the lowermost stratosphere as identified by the CO-O3 correlation from in situ
mea-20
surements, J. Geophys. Res., 107, 4044–4060, doi:10.1029/2000JD000289, 2002. 10629,
10630,10633,10646
Hoor, P., Gurk, C., Brunner, D., Hegglin, M. I., Wernli, H., and Fischer, H.: Seasonality and extent of extratropical TST derived from in-situ CO measurements during SPURT, Atmos. Chem. Phys., 4, 1427–1442, 2004,
25
http://www.atmos-chem-phys.net/4/1427/2004/. 10632,10634,10640,10641
Hoor, P., Fischer, H., and Lelieveld, J.: Tropical and extratropical tropospheric air in the low-ermost stratosphere over Europe: A CO-based budget, Geophys. Res. Lett., 32, L13812, doi:10.1029/2005GL022495, 2005. 10634,10640,10646
Konopka, P., G ¨unther, G., M ¨uller, R., dos Santos, F. H. S., Schiller, C., Ravegnani, F., Ulanovsky,
30
ACPD
8, 10627–10664, 2008Mixing processes and exchanges in the
tropical and the subtropical UT/LS
R. James and B. Legras
Title Page
Abstract Introduction
Conclusions References
Tables Figures
◭ ◮
◭ ◮
Back Close
Full Screen / Esc
Printer-friendly Version
Interactive Discussion
http://www.atmos-chem-phys.net/7/3285/2007/. 10643,10646
Lef `evre, F., Brasseur, G. P., Folkins, I., Smith, A. K., and Simon, P.: Chemistry of the 1991–1992 stratospheric winter: Three-dimensional model simulations, J. Geophys. Res., 99, 8183– 8195, doi:10.1029/93JD03476, 1994. 10636
Lef `evre, F., Figarol, F., Carslaw, K. S., and Peter, T.: The 1997 Arctic ozone depletion
quan-5
tified from three-dimensional model simulations, Geophys. Res. Lett., 25, 2425–2428, doi: 10.1029/98GL51812, 1998. 10636
Legras, B., Pisso, I., Berthet, G., and Lef `evre, F.: Variability of the Lagrangian turbulent diffusion in the lower stratosphere, Atmos. Chem. Phys., 5, 1605–1622, 2005,
http://www.atmos-chem-phys.net/5/1605/2005/. 10635,10636,10637,10638,10647
10
Loewenstein, M., Jost, H.-J., Grose, J., Eilers, J., Lynch, D., Jensen, S., and Marmie, J.: Argus: A new instrument for the measurement of the stratospheric dynamical tracers, N2O and CH4, Spectrochim. Acta A, 58, 2329–2345, 2002. 10632
Lopez, J. P., Fridlind, A. M., Jost, H.-J., Loewenstein, M., Ackerman, A. S., Campos, T. L., We-instock, E. M., Sayres, D. S., Smith, J. B., Pittman, J. V., Hallar, A. G., Avallone, L. M., Davis,
15
S. M., and Herman, R. L.: CO signatures in subtropical convective clouds and anvils during CRYSTAL-FACE: An analysis of convective transport and entrainment using observations and a cloud-resolving model, J. Geophys. Res., 111, D09305, doi:10.1029/2005JD006104, 2006. 10632
Mote, P. W., Rosenlof, K. H., M. Mclntyre, M. E., Carr, E. S., Gille, J. C., Holton, J. R., Kinnersley,
20
J. S., Pumphrey, H. C., Russell III, J. M., and Waters, J. W.: An atmospheric tape recorder: The imprint of tropical tropopause temperatures on stratospheric water vapor, J. Geophys. Res., 101, 3989–4006, 1996.10630,10637
Mullendore, G. L., Durran, D. R., and Holton, J. R.: Cross-tropopause tracer transport in mid-latitude convection, J. Geophys. Res., 110, D06113, doi:10.1029/2004JD0050590, 2005.
25
10633
Neu, J. L. and Plumb, R. A.: Age of air in a “leaky pipe” model of stratospheric transport, J. Geophys. Res., 104, 19 243–19 255, doi:10.1029/1999JD900251, 1999. 10630,10643
Pan, L. L., Randel, W. J., Gary, B. L., Mahoney, M. J., and Hintsa, E. J.: Definition and sharness of the extratropical tropopause: A trace gas perspective, J. Geophys. Res., 109, D23103,
30
doi:10.1029/2004JD004982, 2004.10629,10630,10646
ACPD
8, 10627–10664, 2008Mixing processes and exchanges in the
tropical and the subtropical UT/LS
R. James and B. Legras
Title Page
Abstract Introduction
Conclusions References
Tables Figures
◭ ◮
◭ ◮
Back Close
Full Screen / Esc
Printer-friendly Version
Interactive Discussion
2006. 10631,10633,10646
Park, S., Jimenez, R., Daube, B. C., Pfister, L. T., Conway, T. J., Gottlieb, E. W., Chow, V. Y., Curran, D. J., Matross, D. M., Bright, A., Atlas, E. L., Bui, T. P., Gao, R.-S., Twohy, C. H., and Wofsy, S. C.: The CO2 tracer clock for the Tropical Tropopause Layer, Atmos. Chem. Phys., 7, 3989–4000, 2007,
5
http://www.atmos-chem-phys.net/7/3989/2007/.10637,10638,10644,10645,10646,10647
Patmore, N. and Toumi, R.: An entropy-based measure of mixing at the tropopause, Q. J. R. Meteorol. Soc., 132, 1949–1960, 2006. 10630
Pisso, I. and Legras, B.: Turbulent vertical diffusivity in the sub-tropical stratosphere, Atmos. Chem. Phys., 8, 697–707, 2008,
10
http://www.atmos-chem-phys.net/8/697/2008/. 10635,10637
Plumb, R. A.: Tracer-tracer relationships in the stratosphere, Rev. Geophys., 45, RG4005, doi:10.1029/2005RG000179, 2007. 10630
Proffitt, M. H., Kelly, K. K., Powell, J. A., Gary, B. L., Loewenstein, M., Podolske, J. R., Strahan, S. E., and Chan, K. R.: Evidence for diabatic cooling and poleward transport within and
15
around the 1987 Antarctic ozone hole, J. Geophys. Res., 94, 16 797–16 813, doi:10.1029/ 89JD00905, 1989. 10632
Randel, W. J., Park, M., Wu, F., and Livesey, N.: A Large Annual Cycle in Ozone above the Tropical Tropopause Linked to the Brewer Dobson Circulation, J. Atmos. Sci., 64, 4479–4488, doi:10.1175/2007JAS2409.1, 2007. 10644
20
Rosenlof, K. H. and McCormick, M. P.: Hemispheric asymmetries in water vapor and inferences about transport in the lower stratosphere, J. Geophys. Res., 102, 13 213–13 234, doi:10. 1029/97JD00873, 1997.10630,10643,10646
Shapiro, M. A.: Turbulent mixing within tropopause folds as a mechanism for the exchange of chemical constituents between the troposphere and the stratosphere, J. Atmos. Sci., 37,
25
994–1004, doi:10.1175/1520-0469(1980)037h0994:TMWTFAi2.0.CO;2, 1980. 10639
Stohl, A., Forster, C., Frank, A., and Wotawa, G.: Technical note: The Lagrangian particle dispersion model FLEXPART version 6.2, Atmos. Chem. Phys., 6, 2461–2474, 2005,
http://www.atmos-chem-phys.net/6/2461/2005/. 10635
Volk, C. M., Elkins, J. W., Fahey, D. W., Salawitch, R. J. Dutton, G. S., Gilligan, J. M., Proffitt,
30
ACPD
8, 10627–10664, 2008Mixing processes and exchanges in the
tropical and the subtropical UT/LS
R. James and B. Legras
Title Page
Abstract Introduction
Conclusions References
Tables Figures
◭ ◮
◭ ◮
Back Close
Full Screen / Esc
Printer-friendly Version
Interactive Discussion
Waugh, D. W.: Seasonal variation of isentropic transport out of the tropical stratosphere, J. Geo-phys. Res., 101, 4007–4023, doi:10.1029/95JD03160, 1996. 10630
Waugh, D. W. and Hall, T. M.: Age of stratospheric air: theory, observations, and models, Rev. Geophys., 40, doi:10.1029/2000RG000101, 2002. 10637
Waugh, D. W., Plumb, R. A., Elkins, J. W., Fahey, D. W., Boering, K. A., Dutton, G. S., Volk,
5
C. M., Keim, E., Gao, R.-S., Daube, B. C., Wofsy, S. C., Lowenstein, M., Podolske, J. R., Chan, K. R., Proffitt, M. H., Kelly, K. K., Newman, P. A., and Lait, L. R.: Mixing of polar air into middle latitudes as revealed by tracer-tracer scatter plots, J. Geophys. Res., 102, 13 119–13 134, doi:10.1029/96JD03715, 1997. 10630
Wernli, H. and Bourqui, M.: A Lagrangian 1-year climatology of (deep) cross-tropopause
10
ACPD
8, 10627–10664, 2008Mixing processes and exchanges in the
tropical and the subtropical UT/LS
R. James and B. Legras
Title Page
Abstract Introduction
Conclusions References
Tables Figures
◭ ◮
◭ ◮
Back Close
Full Screen / Esc
Printer-friendly Version
Interactive Discussion
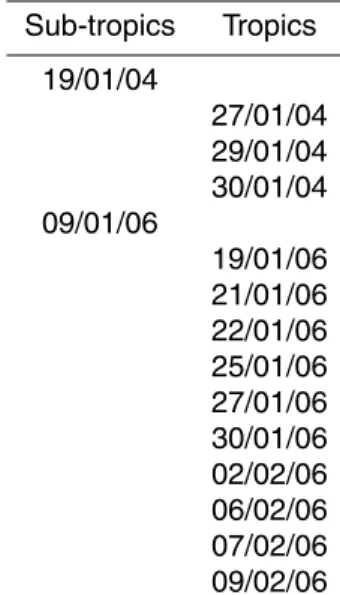
Table 1.Table of the Pre-AVE and CR-AVE flights used for subtropical and tropical regions.
Sub-tropics Tropics
19/01/04
27/01/04 29/01/04 30/01/04 09/01/06
ACPD
8, 10627–10664, 2008Mixing processes and exchanges in the
tropical and the subtropical UT/LS
R. James and B. Legras
Title Page
Abstract Introduction
Conclusions References
Tables Figures
◭ ◮
◭ ◮
Back Close
Full Screen / Esc
Printer-friendly Version
Interactive Discussion
Table 2. Percentage of retained parcels for different values of the diffusivity added to the advection scheme.
D( m2s−1)
0.01 0.05 0.1 0.5 1. 2. 5.
ACPD
8, 10627–10664, 2008Mixing processes and exchanges in the
tropical and the subtropical UT/LS
R. James and B. Legras
Title Page
Abstract Introduction
Conclusions References
Tables Figures
◭ ◮
◭ ◮
Back Close
Full Screen / Esc
Printer-friendly Version
Interactive Discussion
ACPD
8, 10627–10664, 2008Mixing processes and exchanges in the
tropical and the subtropical UT/LS
R. James and B. Legras
Title Page
Abstract Introduction
Conclusions References
Tables Figures
◭ ◮
◭ ◮
Back Close
Full Screen / Esc
Printer-friendly Version
Interactive Discussion
ACPD
8, 10627–10664, 2008Mixing processes and exchanges in the
tropical and the subtropical UT/LS
R. James and B. Legras
Title Page
Abstract Introduction
Conclusions References
Tables Figures
◭ ◮
◭ ◮
Back Close
Full Screen / Esc
Printer-friendly Version
Interactive Discussion
ACPD
8, 10627–10664, 2008Mixing processes and exchanges in the
tropical and the subtropical UT/LS
R. James and B. Legras
Title Page
Abstract Introduction
Conclusions References
Tables Figures
◭ ◮
◭ ◮
Back Close
Full Screen / Esc
Printer-friendly Version
Interactive Discussion
ACPD
8, 10627–10664, 2008Mixing processes and exchanges in the
tropical and the subtropical UT/LS
R. James and B. Legras
Title Page
Abstract Introduction
Conclusions References
Tables Figures
◭ ◮
◭ ◮
Back Close
Full Screen / Esc
Printer-friendly Version
Interactive Discussion
ACPD
8, 10627–10664, 2008Mixing processes and exchanges in the
tropical and the subtropical UT/LS
R. James and B. Legras
Title Page
Abstract Introduction
Conclusions References
Tables Figures
◭ ◮
◭ ◮
Back Close
Full Screen / Esc
Printer-friendly Version
Interactive Discussion
ACPD
8, 10627–10664, 2008Mixing processes and exchanges in the
tropical and the subtropical UT/LS
R. James and B. Legras
Title Page
Abstract Introduction
Conclusions References
Tables Figures
◭ ◮
◭ ◮
Back Close
Full Screen / Esc
Printer-friendly Version
Interactive Discussion
ACPD
8, 10627–10664, 2008Mixing processes and exchanges in the
tropical and the subtropical UT/LS
R. James and B. Legras
Title Page
Abstract Introduction
Conclusions References
Tables Figures
◭ ◮
◭ ◮
Back Close
Full Screen / Esc
Printer-friendly Version
Interactive Discussion
ACPD
8, 10627–10664, 2008Mixing processes and exchanges in the
tropical and the subtropical UT/LS
R. James and B. Legras
Title Page
Abstract Introduction
Conclusions References
Tables Figures
◭ ◮
◭ ◮
Back Close
Full Screen / Esc
Printer-friendly Version
Interactive Discussion
Fig. 9.Comparison between in situ measurements (grey) and reconstructed profiles from SAP calculated after 9 days (red) and 35 days (blue) for three tropical flights: (a) 06/02/06; (b)
ACPD
8, 10627–10664, 2008Mixing processes and exchanges in the
tropical and the subtropical UT/LS
R. James and B. Legras
Title Page
Abstract Introduction
Conclusions References
Tables Figures
◭ ◮
◭ ◮
Back Close
Full Screen / Esc
Printer-friendly Version
Interactive Discussion
ACPD
8, 10627–10664, 2008Mixing processes and exchanges in the
tropical and the subtropical UT/LS
R. James and B. Legras
Title Page
Abstract Introduction
Conclusions References
Tables Figures
◭ ◮
◭ ◮
Back Close
Full Screen / Esc
Printer-friendly Version
Interactive Discussion