www.ache.org.rs/CICEQ
Chemical Industry & Chemical Engineering Quarterly 16 (3) 259−268 (2010) CI&CEQ
ANKA CVETKOVIĆ1
MILENA
JOVAŠEVIĆ-STOJANOVIĆ2
LJILJANA ADJANSKI-SPASIĆ1
SNEŽANA MATIĆ-BESARABIĆ1
DRAGAN A. MARKOVIĆ3
1Public Health Institute of Belgra-de, Bul. Despota Stefana 54,
11000 Belgrade, Serbia 2University of Belgrade, Institute Vinča, P.O. Box 522, 11001 Belgrade, Serbia 3Faculty of Appled Ecology
“Fu-tura”, Bulevar Mihajla Pupina 12a, Belgrade, 11000 Serbia
SCINTIFIC PAPER
UDC 547.681:504.3.054(497.111) DOI 10.2298/CICEQ091225048C
SEASONAL TRENDS OF BENZO(a)PYRENE
IN SUSPENDED PARTICULATE MATTER IN
URBAN AREAS OF BELGRADE, SERBIA*
Polycyclic aromatic hydrocarbons (PAHs) were identified to be one of the ma-jor toxic air pollutants in urban environment. PAHs are mostly formed during incomplete combustion or pyrolysis of organic material. According to Serbian National Legislation, benzo(a)pyrene (BaP) concentration in total suspended particles (TSP) in ambient air in the Belgrade metropolitan area has been de-termined in the last ten years, as a part of a local air pollution monitoring pro-gram performed by the Public Health Institute of Belgrade and funded by Bel-grade’s Municipality. Air samples for analysis of BaP in suspended particles have been collected (as 24 h sample once per month) at selected monitoring sites within the municipal air quality monitoring network. At the beginning, according to National Regulation, all samples were taken as total suspended particles (TSP). Since mid-2008, the procedure of sampling methodology was harmonized with EU requirements and solid fraction PM10 has been collected and analyzed using GC/MS. In this study, we have analyzed results of TSP collected between 2005 and 2008. Looking through the results obtained during the period of a whole year, it can be noticed that concentrations of BaP were much higher during winter season at almost all measuring sites.
Key words: air pollution monitoring; particulate matter; benzo(a)pyrene (BaP).
Polycyclic aromatic hydrocarbons (PAHs) are products of incomplete combustion formed during burning or pyrolysis of organic matter such as coal, oil, biomass, gasoline [1] and diesel [2,3]. Also PAHs in ambient air can be emitted from industrial combus-tions [3,4], aluminum production, cement manufactu-re, production of coal tamanufactu-re, coke and asphalt, petro-leum catalytic cracking and restaurants [5].
Atmospheric PAHs can exist in both gaseous and particle phases, while a greater fraction of air-borne organic particulate matter is present in the res-pirable size range. Some studies found that PAHs with two or three benzene rings exist in the vapor phase, while PAHs with more than five rings were ob-served primarily in the particulate phase [6]. This sug-gests that particulate PAHs are regarded as
Correspondening author: A. Cvetković, Public Health Institute of Belgrade, Bul. Despota Stefana 54, 11000 Belgrade, Serbia. E-mail: anka.filipovic@gmail.com
*Part of this paper was presented at the Scientific Meeting Par-ticulate Matter: Research and Management, 2nd Webiopatr Work-shop, Mokra Gora, Serbia, 31 August-2 September, 2009. Paper received: 22 December, 2009
Paper revised: 15 August, 2010 Paper accepted: 23 August, 2010
concen-trated on the fine and ultrafine particles, and various PAH investigations can be performed equally well from both the PM2.5 and the PM10 samples [14]. Thus, inhalation of PAHs in particulate mixture is potentially a serious health risk [18,19].
Benzo(a)pyrene has been regarded as one of the markers of the total and carcinogenic PAHs [7,14]. The European Commission has set an annual target value of 1 ng/m3 for benzo(a)pyrene in ambient air from content in PM10 fraction, while current legislative in Serbia set an annual limit value of 1 ng/m3 for Ben-zo(a)pyrene in TSP [20–22]. On the other hand, the natural background level of BaP may be near zero; in rural areas its concentration ranges from 0.01–1 ng/m3, in urban areas from 1–10 ng/m3, and in the vicinity of industrial facilities it goes up to 40 ng/m3 [23].
In order to estimate the carcinogenic risks for humans, the benzo(a)pyrene-equivalent (BaPE) carci-nogenicity was evaluated by multiplying the concen-trations of each PAH with their toxic equivalent factors (TEF) [24] which can be used to calculate the relative carcinogenicity of ambient samples with a known dis-tribution of PAHs.
In the present study the concentration of BaP in ambient air of the Belgrade metropolitan area,
record-ed at selectrecord-ed number of different types of sampling sites in period 2005-2008 has been evaluated for the first time. TSP samples of ambient air were collected from January 1, 2005, to May 1, 2008, while PM10 samples were collected from May 1 to December, 2008. BaP concentrations were assessed during dif-ferent seasonal conditions. Annual and seasonal BaP levels in TSP samples in Belgrade were compared with BaP concentration in the cities of other European countries.
EXPERIMENTAL
Aerosol sampling
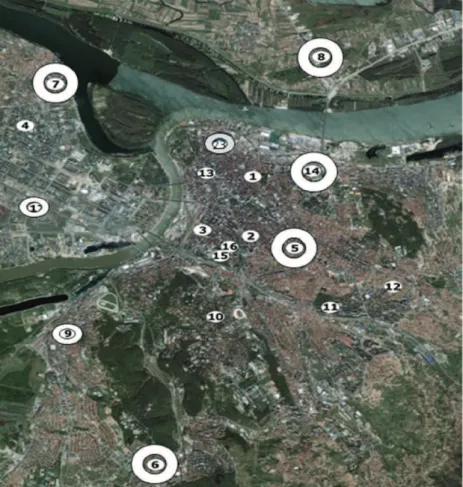
The sampling sites that belong to the municipal air quality monitoring network have been located in the city center as well as in the wider Belgrade met-ropolitan area. The total size of the Belgrade metro-politan area is about 360 km2 with 1,710.000 inha-bitants. The municipal monitoring network consists of 17 manual, 6 fixed automatic and 2 mobile automatic stations (Figure 1). PM monitoring within the muni-cipal monitoring network is currently performing at 6 urban traffic (UT), 1 urban basic (UB), 1 rural indus-trial (RI), 1 sub-rural indusindus-trial (SRI) and 2 urban
dustrial (UI). The monitoring sites in Belgrade are characterized by different traffic levels and housing density. Some of the sampling sites are located in an urban background, which means that the sites are not directly exposed to traffic or other sources of emis-sion, as it is noted in Table 1 and Figure 1. Sampling sites 18_SUI, 20_RI and 22_SRT that are not shown in Figure 1, are located in the wider Belgrade metro-politan area: 18_SUI is in vicinity of thermal power plant “Obrenovac”, 20_RI in vicinity of thermal power plant “Kolubara” and 22_SRT is located 30 km south in the city of Mladenovac which also belongs to the Belgrade metropolitan area.
TSP were collected between 2005 and 2008 for BaP analysis at 6 sampling sites. Since 2008 the mo-nitoring network for PAH was improved. Five samp-ling sites were added, which contributed to better spa-tial representativity. Instead of collecting TSP, PM10 has been sampled with the recommended reference sampler.
Air samples for analysis of BaP in TSP were collected within 24 h using a High Volume Sampler Proekos situated at a height of 1.5-2 m from the ground level. The pump was set at 17 m3 h-1. Air was passing through GF/A glass fibre filter Whatman 110 mm diameter. Before sampling, filters were heated in an oven on 105 °C for 1 h and then put in isothermal
box for cooling and weighing. A Precisa XR 125 SB microbalance with 0.01 mg sensitivity was used to measure weight.
Since 2008, the procedure of sampling metho-dology has been harmonized with EU requirements and solid fraction PM10 has been collected and ana-lyzed. Sampling of PM10 was done by a low volume sampler, Leckel model LV3 on to glass fiber filter Whatman 47 mm diameter according to standard EN 12341 [25]. The flow rate was set at 2.3 m3 h-1. Heights above ground level for all measurement sites were about 2.5 m.
Determination of BaP
TSP-BaP samples were prepared according to Compendium Method TO-13A [26]: determination of PAHs in ambient air using GC/MS. All samples were extracted using a Soxhlet extractor with a solvent so-lution of 250 ml (a mixture of 125 ml n-hexane and 125 ml acetone) for 18 h.The obtained extracts were then concentrated to 1 ml using a rotary evaporator and cleaned up on the column with 10 g activated silica gel and sodium sulfate on the top of the column. The column was rinsed with 60 ml dichloromethane and 40 ml pentane. The collected extract was reje-cted and, when the level of the pentane layer was above the sodium sulfate, 1 ml of sample extract was
Table 1. Selected sampling sites for BaP collecting within the local monitoring network
Number Name Type of site Abbreviation Co-ordinate 1 Despot Stefan Boulevard 54/ Urban traffic 1_UT 44°49´67.8´´ 20°47´03.6´´
2 M.Vidakovića Urban traffic 5_UT 44°47´41.0´´
20°28´59.4´´ 3 Queen Jelena Urban industrial 6_UI 44°44´41.3´´ 20°26´22.5´´
4 JNA Place Urban traffic 7_UT 44°51´04.8´´
20°23´25.1´´ 5 Mansion of Grga Andrijanović Urban industrial 8_UI 44°51´18.1´´ 20°28´54.0´´ 6 Čukarica, Prince Višeslav Urban basic 9_UB 44°44´49.3´´ 20°25´20.8´ 7 Institute of Biology Urban traffic 14_UT 44°49´02.7´´ 20°30´34.9´´ 8 New Belgrade, Parking service Urban traffic 17_UT 44°48´22.2´´ 20°23´50.8´´ 9 Obrenovac Suburban industrial 18_ SUI 44°36´15.2´´ 20°06´19.5´´ 10 Vreoci Rural industrial 20_ RI 44° 26′ 19"
20° 16′ 32" 11 Mladenovac Subrural traffic 22_SRT 44°26'11"
20°40'16" 12 Rail street, Karadjoredjeva Urban traffic 23_UT 44°48´34.3´´
applied to a column. The column was rinsed with 25 ml of pentane, fractioned with pentane containing ali-phatic hydrocarbons, and it was rejected. Column rin-sing was continued with 25 ml of methylene chloride: pentane (4:6) mixture. The extract was then concen-trated using a rotary evaporator with 100 µl toluene as keeper, solvent was exchanged to toluene until 0.5 ml and analyzed on GC/MS.
PM10-BaP samples were extracted with solvent solution of 50 ml (a mixture of 12.5 ml hexane and 12.5 ml acetone (1:1) in Multiwave 3000 with rotor 8SOLV and cleaned up the same way as PAH-TSP. The obtained extracts with 100 µl toluene as keeper were concentrated using the rotary evaporator to 0.5 ml and analyzed on GC/MS. Benzo(a)pirene was de-termined using an Agilent 6890N Gass chromato-graph with an Agilent 5973 Mass selective detector and capillary column DB-5 MS l, 30m 0.25 mm×25 µm. The oven temperature was programmed to be from 70 °C at a rate of 8 °C/min to 310 °C and held for 5 min with helium as the carrier gas. Semi-internal standard was used (deutered PAHs) for internal calib-ration. Prior to analysis, a calibration curve for the benzo(a)piren was obtained by spiking seven known quantities of substance with an R2
of the calibration curve above 0.95. With each set of samples, both field and laboratory blank samples were prepared and analyzed together with the samples. Benzo(a)piren concentrations were corrected with reference to a blank.
UltraScientific PAH Mixture PM-831 PAHs mix-ture with Benzo(a)pyrene concentration of 500.8±2.5 µg/ml was used as the external standard for the ca-libration curve. Ultra scientific semi-volatiles internal standard mixture ISM-560 with deuterated compounds: acenaphthene-d10; chrysene-d10;
1,4-dichlorobenze-ne; Naphthalene-d8; perylene-d12; penanthrene-d10 was used as the internal standard.
The detection limit (DL) for each species was determined according to US-EPA test methods SW- -846 (http://www.epa.gov/sw-846/pdfs/chap1.pdf). A known quantity of each standard substance was mea-sured seven times, and the DL for each species was three times the standard deviation from the seven tests. When converted to atmospheric concentration, the detection limit for each of PAH species, including BaP, was 0.02 ng/m3.
RESULTS AND DISCUSSION
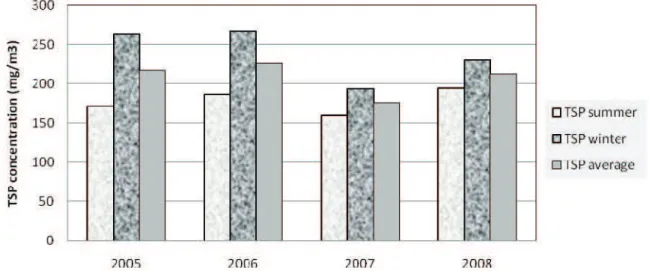
In this study, we evaluated results from the last four years between 2005 and 2008. Theannual ave-rage concentration of TSP in Belgrade urban area is shown in Figure 2. All values were above 70 µg/m3 which is the annual target value for TSP according to current Serbian legislation [21]. The maximum month-ly value was 729.7 µg/m3 in November 2005 at mea-surement site 5_UT urban traffic and the minimum monthly value was 135 µg/m3 in April 2006 at measu-rement site 1_UT urban traffic. All average annual va-lues of TSP were between 150-230 µg/m3.
The annual average BaP mass concentrations of TSP, samples collected between January 1st, 2005 and May 1st, 2008, are presented in Figure 3. Table 2 shows the average BaP mass concentration, median and percentile 0.75 measured at five sampling sites in the Belgrade urban area from January 1st, 2005, to May1st, 2008.
The main sources of BaP around the measuring sites were mostly influenced by emission from diffe-rent sources such as residential heating, industrial fa-cilities and traffic. Generally, BaP concentrations are higher during the winter (heating period, from October
to March) than during the summer (non-heating pe-riod, from April to September) period. Concentrations of BaP depend on sources strength and weather con-ditions. In Belgrade, coal and wood combustion for domestic heating were probably major contributors to the higher BaP loading in winter.The lower BaP con-centrations in the summer period in Belgrade were likely influenced by higher degrees of atmospheric photo degradation and evaporation. One of the rea-sons that PAHs are lower during the summer is be-cause semi-volatile PAHs are present in the gas pha-se in the summer due to higher temperature, while in the winter ambient temperatures are much lower. BaP was found to be a relatively unstable compound and it is questionable if it is a good indicator of total PAHs or carcinogenic PAHs [12].
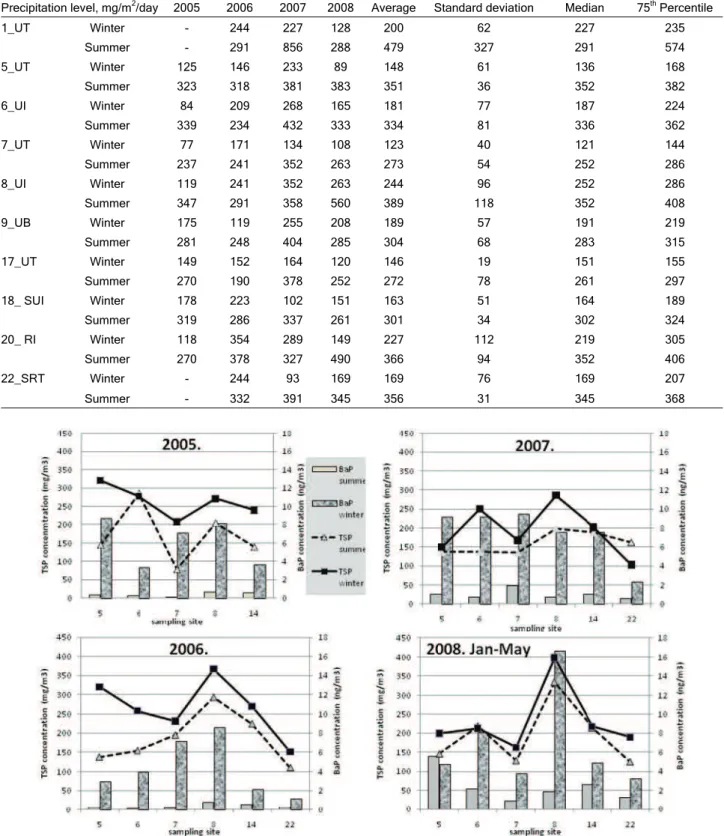
There is also a possibility that lower levels of BaP in summer are due to summer rainfall which may have rinsed PAHs including BaP from the ambient air [27]. The precipitation level in the summer is signifi-cantly higher than in winter season in Belgrade. Table 3 shows precipitation levels at selected sampling sites in Belgrade during summer and winter season.
The highest seasonal mean value of BaP in TSP (16.65 ng/m3) was detected in 2008. The highest monthly value was 35.7 ng/m3 in November 2005 on measurement site 5_UT and minimum monthly values were about DLV (0.02 ng/m3) on three measurement sites 5_UT, 6_UI and 8_UI during the summer months. Between 2005 and 2008 the annual mean concentra-tions were above target value. Figure 4 displays sea-sonal variations of BaP and TSP on measuring sites in Belgrade. Table 4 shows a number of measure-ments where BaP in TSP were higher than 1 ng/m3.
TSP were sampled until May 2008, while after that we continued with sampling of PM10 on the same and new sampling sites. BaP data obtained from fil-ters collected before and after May 2008 are shown in separate figures. Determination of BaP in PM10 col-lected since May, 2008, is shown in Figure 5.
It is underlined that generally between 80 and almost 100% of PAH including BaP can be asso-ciated with particles with an aerodynamic diameter of less than 2.5 μm, PM2.5 [7]. However, in some recently published papers there are data about concentrations of BaP in TSP two times higher than in PM10 at resi-dential sites, and in same towns the same level of Figure 3. Annual mean concentration of BaP in the Belgrade urban area.
Table 2. Average BaP mass concentration analyzed from TSP, median and 75 percentile at 5 sampling sites in the Belgrade urban area for period January 1st, 2005-June 1st, 2008
Season Staistical value 5_UT 6_UI 7_UT 8_UI 14_UT 22_SRT
Winter N 20 21 18 19 18 17
Average 6.53 5.06 8.87 8.62 2.73 4.09
Meadian 5.00 3.29 9.58 8.66 2.00 2.40
75th Percentile 7.30 7.06 14.31 12.59 3.88 3.92
Summer N 16 15 15 16 16 13
Average 1.18 0.41 0.97 0.90 0.78 0.73
Median 0.58 0.25 0.29 0.63 0.35 0.52
BaP in TSP and PM10 at industrial sites [28]. The me-teorological conditions in the Belgrade metropolitan area are characterized with stronger wind in the win-ter and higher level of precipitation in the summer. Stronger winds enable soil dust and road dust to re-
-suspend in the winter period and remain in the am-bient air contributing to higher level of BaP.
The obtained results for PM10 concentration were higher during the heating season than the non-heat-ing season, except at two urban traffic sites. At site Table 3. Annual precipitation level, standard deviation, median and 75 percentile at selected sampling sites in the Belgrade urban area
Precipitation level, mg/m2/day 2005 2006 2007 2008 Average Standard deviation Median 75th Percentile
1_UT Winter - 244 227 128 200 62 227 235
Summer - 291 856 288 479 327 291 574
5_UT Winter 125 146 233 89 148 61 136 168
Summer 323 318 381 383 351 36 352 382
6_UI Winter 84 209 268 165 181 77 187 224
Summer 339 234 432 333 334 81 336 362
7_UT Winter 77 171 134 108 123 40 121 144
Summer 237 241 352 263 273 54 252 286
8_UI Winter 119 241 352 263 244 96 252 286
Summer 347 291 358 560 389 118 352 408
9_UB Winter 175 119 255 208 189 57 191 219
Summer 281 248 404 285 304 68 283 315
17_UT Winter 149 152 164 120 146 19 151 155
Summer 270 190 378 252 272 78 261 297
18_ SUI Winter 178 223 102 151 163 51 164 189
Summer 319 286 337 261 301 34 302 324
20_ RI Winter 118 354 289 149 227 112 219 305
Summer 270 378 327 490 366 94 352 406
22_SRT Winter - 244 93 169 169 76 169 207
Summer - 332 391 345 356 31 345 368
7_UT concentrations were about the same level in both seasons and at site 17_UT concentrations were much higher during summer then during winter sea-son. At sites 5_UT, 8_UI, 6_UI, 18_SRI, 20_RI and 23_UT PM10 concentrations were above 50 µg/m3, meaning above target value according to current EU legislation. The maximum PM10 value was 150.2 µg/m3 in December at site 14_UT, and the minimum was 3.8 µg/m3 in September at site 5_UT. Also, the concen-tration of BaP in winter followed PM10 concentrations. All values were above target value for BaP. The ma-ximum value was 9.09 ng/m3 in December at an in-dustrial measurement site with rural surrounding (20_RI) in the vicinity of Thermal Power Plant Kolubara and the minimum value was 0.05 ng/m3 in August at site 22_SRT.
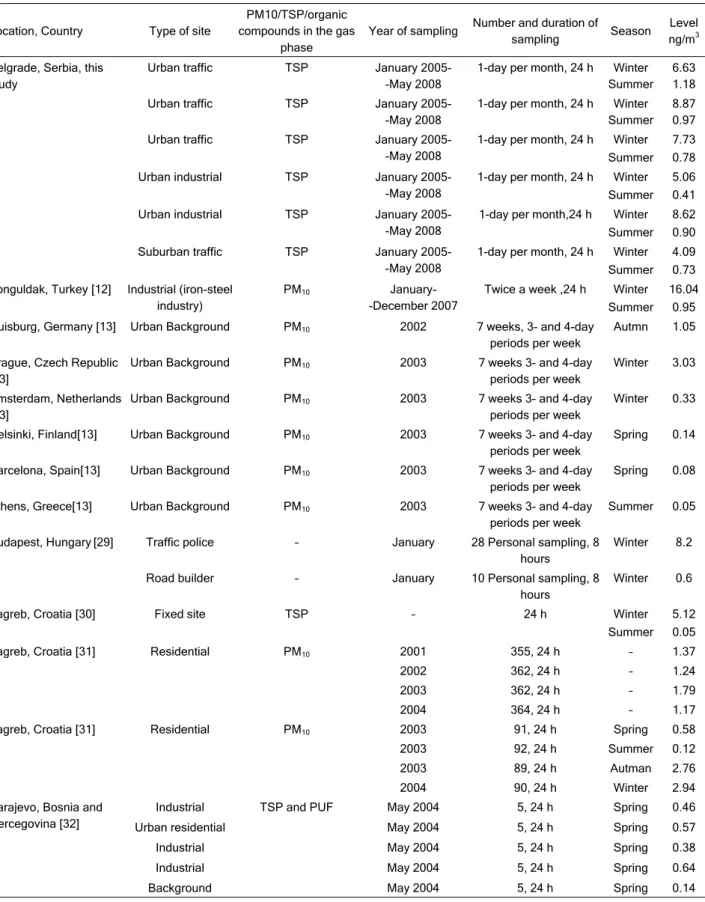
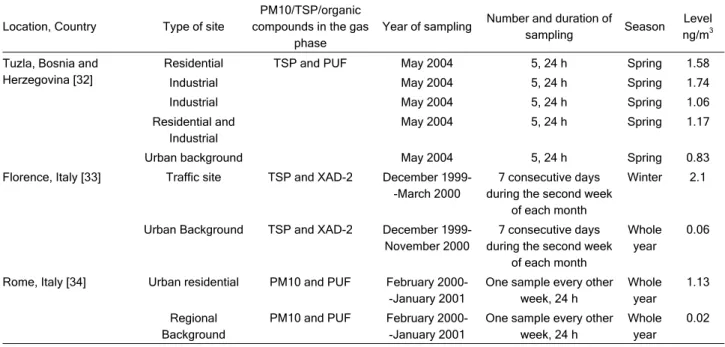
Table 5 shows information about BaP studies in European cities performed in the last 10 years. Pre-sented for each study are: the location and country where monitoring was performed; type of sampling si-te; characteristic of collected samples, TSP or PM10, case I only particulate fraction or both particulate and gas fractions were collected; number and duration of sampling; period of sampling; as well as the deter-mined concentration of BaP
in
ng/m3. At sampling sites in Belgrade only one sample was collected each month, which is too limited to obtain representative results according to the requirements for data capture and time coverage in EU legislation [20]. Neverthe-less, the results of BaP analysis for particular types of sampling sites, as well as the annual average con-centration in the Belgrade metropolitan area werecomparable with levels of BaP determined in the other European cities.
CONCLUSION
The mean annual TSP concentrations in the period January 2005-May 2008 were above 70 ng/m3 for each year in the Belgrade urban area. The results of this study show that BaP followed the pattern of seasonal variations of suspended particulate matter, being higer in the winter and lower in the summer. During winter season, which is in fact heating season, concentrations were higher at almost all measuring sites due to strong influence of local heating, in-fluence of higher degree of atmospheric photo degra-dation, evaporation processes, as well as other me-teorological conditions. There is a slight trend of rising levels of BaP from year to year in samples of TSP col-lected between Janaury, 2005, and May, 2008, that may be associated with the increasing frequency of traffic in the Belgrade metropolitan area.
Generally, this study confirms that the concen-tations of BaP in particulate matter were comparable with levels detected in other Europen cities. For deter-mination of the uncertainty of the time coverage of air quality measurements of BaP at the municipal moni-toring network according to requirements from 4th Daughter directive, it is important to improve time co-verage of data. That means that at least 4-5 measu-rements are necessary per month for fixed measure-ments and 2 per month for indicative measuremeasure-ments. Table 4. Concentrations of BaP in TSP above limit value according to Serbian legislative
Year Number of measurement Values above 1 ng/m3 Content, %
2005 42 21 50.0
2006 69 27 39.1
2007 67 41 61.2
2008 (January-May) 32 27 84.4
Table 5. BaP studies in European cities in the last 10 years
Location, Country Type of site
PM10/TSP/organic compounds in the gas
phase
Year of sampling Number and duration of sampling Season
Level ng/m3
Belgrade, Serbia, this study
Urban traffic TSP January 2005- -May 2008
1-day per month, 24 h Winter Summer
6.63 1.18 Urban traffic TSP January 2005-
-May 2008
1-day per month, 24 h Winter Summer
8.87 0.97 Urban traffic TSP January 2005-
-May 2008
1-day per month, 24 h Winter Summer
7.73 0.78 Urban industrial TSP January 2005-
-May 2008
1-day per month, 24 h Winter Summer
5.06 0.41 Urban industrial TSP January 2005-
-May 2008
1-day per month,24 h Winter Summer
8.62 0.90 Suburban traffic TSP January 2005-
-May 2008
1-day per month, 24 h Winter Summer
4.09 0.73 Zonguldak, Turkey [12] Industrial (iron-steel
industry)
PM10 January- -December 2007
Twice a week ,24 h Winter Summer
16.04 0.95 Duisburg, Germany [13] Urban Background PM10 2002 7 weeks, 3- and 4-day
periods per week
Autmn 1.05
Prague, Czech Republic [13]
Urban Background PM10 2003 7 weeks 3- and 4-day periods per week
Winter 3.03
Amsterdam, Netherlands [13]
Urban Background PM10 2003 7 weeks 3- and 4-day periods per week
Winter 0.33
Helsinki, Finland[13] Urban Background PM10 2003 7 weeks 3- and 4-day periods per week
Spring 0.14
Barcelona, Spain[13] Urban Background PM10 2003 7 weeks 3- and 4-day periods per week
Spring 0.08
Athens, Greece[13] Urban Background PM10 2003 7 weeks 3- and 4-day periods per week
Summer 0.05
Budapest, Hungary[29] Traffic police – January 28 Personal sampling, 8 hours
Winter 8.2
Road builder – January 10 Personal sampling, 8 hours
Winter 0.6
Zagreb, Croatia [30] Fixed site TSP – 24 h Winter Summer
5.12 0.05 Zagreb, Croatia [31] Residential PM10 2001 355, 24 h – 1.37 2002 362, 24 h – 1.24 2003 362, 24 h – 1.79 2004 364, 24 h – 1.17
Zagreb, Croatia [31] Residential PM10 2003 91, 24 h Spring 0.58 2003 92, 24 h Summer 0.12 2003 89, 24 h Autman 2.76 2004 90, 24 h Winter 2.94 Sarajevo, Bosnia and
Hercegovina [32]
Industrial TSP and PUF May 2004 5, 24 h Spring 0.46 Urban residential May 2004 5, 24 h Spring 0.57 Industrial May 2004 5, 24 h Spring 0.38
Table 5. Continued
Location, Country Type of site
PM10/TSP/organic compounds in the gas
phase
Year of sampling Number and duration of sampling Season
Level ng/m3
Tuzla, Bosnia and Herzegovina [32]
Residential TSP and PUF May 2004 5, 24 h Spring 1.58 Industrial May 2004 5, 24 h Spring 1.74 Industrial May 2004 5, 24 h Spring 1.06 Residential and
Industrial
May 2004 5, 24 h Spring 1.17
Urban background May 2004 5, 24 h Spring 0.83 Florence, Italy [33] Traffic site TSP and XAD-2 December
1999--March 2000
7 consecutive days during the second week
of each month
Winter 2.1
Urban Background TSP and XAD-2 December 1999- November 2000
7 consecutive days during the second week
of each month
Whole year
0.06
Rome, Italy [34] Urban residential PM10 and PUF February 2000--January 2001
One sample every other week, 24 h
Whole year
1.13
Regional Background
PM10 and PUF February 2000--January 2001
One sample every other week, 24 h
Whole year
0.02
Future work will be to determine the content of BaP and other PAHs in smaller solid fractions from ambient air such as PM10 and to confirm spatial and temporal reperesentativity of current sampling sites that were established within municipal monitoring net-work since 2008. It is also of great importance to in-vestigate levels and content of different PAHs in fine and ultrafine fractions, with particular attention to PAHs species that are more toxic and responsible for ad-verse health effects, to monitor PAHs species at background sites and, at last but not least, to perform source apportionment modeling.
Acknowledgement
The authors would like to thank the Ministry of Science and Technological Development of Serbia, project TR21009 and Research Council of Norway, WeBIOPATR project, for funding analysis and eva-luation of results as well as the Municipality of Bel-grade the for support program of PAH monitoring in the Belgrade metropolitan area.
REFERENCES
[1] H.H. Mi, W.J. Lee, T.L. Wu, T.C. Lin, L.C. Wang, H.R. Chao, J. Environ. Sci. Health A 31 (1996) 1981-2003 [2] H.H. Mi, W.J. Lee, C.B. Chen, H.H. Yang, S.J. Wu,
Chemosphere 41 (2000) 1783-1790
[3] H.H. Yang, W.J. Lee, S.J. Chen, S.O. Lai, J. Hazard. Mat. 60 (1998) 159-174
[4] S.O. Lai, Characteristics of PAHs and metal elements in the stack flue gas of the steel and iron industries, PhD
dissertation, Department of Environmental Engineering, National Cheng-Kung University, Tainan, Taiwan, 1998 [5] Y.C. Lin, Characteristics of PAHs emitted from the
restaurant kitchens and in the ambient air, PhD dissertation, Department of Environmental Engineering, National Cheng-Kung University, Tainan, Taiwan, 2000 [6] S.O. Baek, M.E. Goldstone P.W.W. Kirk, I.N. Lester R.
Perry, Sci. Tot. Environ. 11(1992) 169–199
[7] EC Working Group on Polycyclic Aromatic Hydrocarbons, Ambient air pollution by polycyclic aromatichydrocarbons (PAH). Position paper, EC/DG Environment, 2001 [8] WHO Regional Office for Europe, Air quality guidelines,
second edition, Copenhagen, Denmark, WHO, 2000 [9] IPCS, Environmental Health Criteria 202, WHO, Geneva,
2000
[10] R.J. Delfino, C. Sioutas, S. Malik, EHP 113 (2005) 934– -946
[11] R.M. Harrison, A.M. Jones, R.G. Lawrence. Atmos. En-viron. 38 (2004) 4531–4538
[12] B. Forsberg, C. Hansson, J Christer, A. Hans, P. Karin, J. Bengl, L. Wang, AMBIO 34 (2005) 11–19
[13] M. Akyüz., H. Çabuk, Sci. Tot. Environ. 405 (2008) 62-70 [14] K. Saarnio, M. Sillanpa, R. Hillamo, E. Sandell, A.
Pennanen, R. Salonen, Atmos. Environ. 42 (2008) 9087– -9097
[15] Z. Wu, M. Hu, P. Lin, S. Liu, B. Wehner, A. Weeden-sohler, Atmos. Environ. 42 (2008) 7967-7980
[16] P.J. Tsai, T.S. Shih, H.L. Chen, W.J. Lee, C.H. Lai, S.H. Liou, Atmos. Environ. 38 (2004) 333-343
[18] A.D. Maynard, E.D. Kuempel, J. Nanoparticle Res. 7 (2005) 587-614
[19] R. Sawyer, Understanding the Potential Ultrafine Particle Pollution Problem and its Impact on California’s Air Quality, Ultrafine Particle Conference, 2006, http:// //www.aqmd.gov/tao/Ultrafine_Presentations/
Keynote_BobSawyer.pdf, 2006
[20] Directive 2004 /107/EC of the European Parliament and the Council of 15 December 2004 relating to cadmium, mercury, nickel and polycyclic aromatic hydrocarbons in ambient air, OJEU (2005) L23/3, 2004
[21] Regulations on Imission Limit Values, Imission Measu-rements Methods, Criteria for Setting up Measurement Points Data, Official Journal of Republic of Serbia 54 (1992) 1896-1905
[22] Anex of the Regulations on Imission Limit Values, Imis-sion Measurements Methods, Criteria for Setting up Mea-surement Points Data, Official Journal of Republic of Ser-bia 19 (2006) 12
[23] P.J. Tsai, T.S. Shih, H.L. Chen , W.J. Lee , C.H. Lai, S.H. Liou, Atmos. Environ. 38 (2004) 333–343
[24] A. Papageorgopoulou, E. Manoli, E. Touloumi, C. Sa-mara, Chemosphere 39 (1999) 2183–2199
[25] EN 12341, CEN 1998, Air Quality Determination of PM10 Fraction of Suspended Particulate Matter, Reference Me-thod and Field Test Particulate to Demonstrate Reference Equivalence of Measurement Methods, Brussels, 1998 [26] EPA/625/R-96/010b, Compendium Method TO-13A,
Cen-ter for Environmental Research Information Office of Re-search and Development, U.S. EPA, Cincinnati, OH, 45268 (1999), http://www.epa.gov/ttnamti1/files/ambient/ /airtox/to-13arr.pdf
[27] X. Han, L.P. Naeher, Environ. Int. 32 (2006) 106–120 [28] A.K. Gupta, K. Karar, A. Srivastava, J. Hazard. Mat. 142
(2007) 279–287
[29] J. Szaniszlo, G.J. Ungvairy, Toxicol. Environ. Health 62 (2001) 297–306
[30] A. Šišović, S. Škrbec, V. Vadjić, N. Kalinić, J. Hršak, Environ. Monit. Assess. 74 (2002) 217–224
[31] A. Šišović, I. Bešlić, K. Šega, V. Vadjić, Environ. Int. 34 (2008) 580–584
[32] M. Škarek, P. Čupr. T. Bartoš, J. Kohoutek, J. Klánová, I. Holoubek, Sci. Tot. Environ. 384 (2007) 182–193
[33] E. Menichini, N. Iacovella, F. Monfredini, L. Turrio-Bal-dassarri, Chemosphere 69 (2007) 422–434
[34] M. Lodovici, M. Venturini,E. Marini, D. Grechi, P. Dolara, Chemosphere 50 (2003) 377–382.
ANKA CVETKOVIĆ1
MILENA
JOVAŠEVIĆ-STOJANOVIĆ2
LJILJANA ADJANSKI-SPASIĆ1
SNEŽANA MATIĆ-BESARABIĆ1
DRAGAN A. MARKOVIĆ3
1
Institut za javno zdravlje Beograd, Bulevar Despota Stefana 54a, Beograd, Srbija 2Univerzitet u Beogradu, Institut za nuklearne nauke Vinča, p. pr. 555, 11001, Beograd, Srbija 3
Fakultet primenjene ekologije “Futura”, Bulevar Mihajla Pupina 12a, Beograd, 11000 Srbija
NAUČNI RAD
SEZONSKI TRENDOVI BENZO(
a
)PIRENA U
SUSPEN-DOVANIM
Č
ESTICAMA U URBANIM PODRU
Č
JIMA
BEOGRADA (SRBIJA)
Poliaromatični ugljovodonici (PAH) su identifikovani kao jedni od najtoksičnijih zaga-djivača u urbanim sredinama. PAH-ovi se najvećim delom formiraju usled nepotpunog sagorevanja ili pirolzom organskih materija.U Srbiji u skladu sa nacionlnom legislativom, benzoapiren (BaP) u ukupnim suspendovanim česticama (TSP) u ambijentnom vazduhu Beograda se određuje u posledenjih deset godina u okviru lokalnog programa monito-ringa koji finansira Gradska skupština a realizuje Gradski zavod za javno zdrvalje Beo-grada. Uzorci vazuha za analizu BaP iz suspendovanih čestica se uzorkuju (jednom mesečno 24 h) na izabranim mestima u okviru gradske monitoring mreže za kontrolu ae-rozagađenja. Od početka merenja BaP-a u ambijentnom vazduhu u skladu sa nacio-nalnom legislativom, prikupljane su i analizirane ukupne suspendovane čestice (TSP). Od sredine 2008. procedura uzorkovanja je usaglašenja sa zahtevima EU, od kada se prikuplja i analizira čvsta frakcija PM10 koršćenjem GC/MS. U ovoj studiji smo analizirali rezultate TSP prikupljenih u periodu 2005 -2008. godine. Posmatrajući rezultate prikup-ljene tokom cele godine utvđeno je da je i u Beogradu na uglavnom svim mernim mes-tima koncentracija BaP daleko viša tokom zimske sezone.