BGD
4, 13–67, 2007Modelling carbon overconsumption and extracellular
POC formation
M. Schartau et al.
Title Page
Abstract Introduction
Conclusions References
Tables Figures
◭ ◮
◭ ◮
Back Close
Full Screen / Esc
Printer-friendly Version
Interactive Discussion Biogeosciences Discuss., 4, 13–67, 2007
www.biogeosciences-discuss.net/4/13/2007/ © Author(s) 2007. This work is licensed under a Creative Commons License.
Biogeosciences Discussions
Biogeosciences Discussionsis the access reviewed discussion forum ofBiogeosciences
Modelling carbon overconsumption and
the formation of extracellular particulate
organic carbon
M. Schartau1, A. Engel2, J. Schr ¨oter2, S. Thoms2, C. V ¨olker2, and D. Wolf-Gladrow2
1
GKSS-Research Centre, Institute for Coastal Research, Geesthacht, Germany 2
Alfred Wegener Institute for Polar and Marine Research, Bremerhaven, Germany
Received: 30 November 2006 – Accepted: 5 December 2006 – Published: 24 January 2007
Correspondence to: M. Schartau ([email protected])
BGD
4, 13–67, 2007Modelling carbon overconsumption and extracellular
POC formation
M. Schartau et al.
Title Page
Abstract Introduction
Conclusions References
Tables Figures
◭ ◮
◭ ◮
Back Close
Full Screen / Esc
Printer-friendly Version
Interactive Discussion Abstract
During phytoplankton growth a fraction of dissolved inorganic carbon (DIC) assimilated by phytoplankton is exuded in the form of dissolved organic carbon (DOC), which can be transformed into extracellular particulate organic carbon (POC). A major fraction of extracellular POC is associated with carbon of transparent exopolymer particles (TEP;
5
carbon content=TEPC) that form from dissolved polysaccharides (PCHO). The exu-dation of PCHO is linked to an excessive uptake of DIC that is not directly quantifiable from utilisation of dissolved inorganic nitrogen (DIN), called carbon overconsumption. Given these conditions, the concept of assuming a constant stoichiometric carbon-to-nitrogen (C:N) ratio for estimating new production of POC from DIN uptake becomes
10
inappropriate. Here, a model of carbon overconsumption is analysed, combining phyto-plankton growth with TEPC formation. The model describes two modes of carbon over-consumption. The first mode is associated with DOC exudation during phytoplankton biomass accumulation. The second mode is decoupled from algal growth, but leads to a continuous rise in POC while particulate organic nitrogen (PON) remains constant.
15
While including PCHO coagulation, the model goes beyond a purely physiological ex-planation of building up carbon rich particulate organic matter (POM). The model is validated against observations from a mesocosm study. Maximum likelihood estimates of model parameters, such as nitrogen- and carbon loss rates of phytoplankton, are determined. The optimisation yields results with higher rates for carbon exudation than
20
for the loss of organic nitrogen. It also suggests that the PCHO fraction of exuded DOC was 63±20% during the mesocosm experiment. Optimal estimates are obtained for coagulation kernels for PCHO transformation into TEPC. Model state estimates are consistent with observations, where 30% of the POC increase was attributed to TEPC formation. The proposed model is of low complexity and is applicable for large-scale
25
biogeochemical simulations.
BGD
4, 13–67, 2007Modelling carbon overconsumption and extracellular
POC formation
M. Schartau et al.
Title Page
Abstract Introduction
Conclusions References
Tables Figures
◭ ◮
◭ ◮
Back Close
Full Screen / Esc
Printer-friendly Version
Interactive Discussion 1 Introduction
Marine biogeochemical modelling predominantly aims at quantifying carbon, nitrogen and phosphorus fluxes within the ocean. For that, understanding the biological transfor-mation of dissolved nutrients into particulate organic matter (POM) is critical to devis-ing biogeochemical- or ecosystem models. Yet, typical nitrogen or phosphorus based
5
ecosystem models have difficulties in matching equally well in-situ primary production rates and standing stock observations, such as chlorophyll a (Chla) concentrations, (Fasham et al.,1993;Fasham and Evans,1995;Schartau and Oschlies,2003b). This becomes evident shortly after phytoplankton growth has run into nutrient depletion. To some extent these model deficiencies are seen when simulating the magnitude
10
and time-depth distribution of particulate organic carbon (POC) formation. The forma-tion of POC is often modelled proporforma-tional to the build-up of phytoplankton nitrogen or phosphorus biomass; fixed stoichiometric nitrogen (C:N) or carbon-to-phosphorus (C:P) ratios (Redfield et al.,1963;Takahashi et al.,1985) are prescribed as a proportionality factor. As a consequence, the modelled transformation of dissolved
15
inorganic carbon (DIC) into biomass remains highly correlated with the utilisation of dis-solved inorganic nitrogen (DIN) and phosphate by phytoplankton.
Today, marine biologists question a strict correlation between nitrogen utilisation and carbon uptake (e.g.Falkowski,2000;Sorensen and Siegel,2001;Geider and LaRoche, 2002), and biogeochemical models with constant C:N and C:P stoichiometric ratios are
20
therefore expected to have significant limitations. When a constant molar C:N ratio of 106:16 is applied to derive the uptake of DIC from the utilisation of DIN by phyto-plankton, differences between derived and observed uptake rates can be obtained that cannot be explained by physical or chemical dynamics alone (Sambrotto et al.,1993; Brostr ¨om,1998;K ¨ortzinger et al.,2001).
25
The uptake of more DIC than expected from nitrate or phosphate removal was termed carbon overconsumption by Toggweiler(1993). For example, when either ni-trate or phosphate becomes depleted, photosynthesis can still proceed and carbon
BGD
4, 13–67, 2007Modelling carbon overconsumption and extracellular
POC formation
M. Schartau et al.
Title Page
Abstract Introduction
Conclusions References
Tables Figures
◭ ◮
◭ ◮
Back Close
Full Screen / Esc
Printer-friendly Version
Interactive Discussion uptake need not automatically cease (e.g.Banse,1994). In general, an excess DIC
uptake by phytoplankton is assumed to be exclusively channelled through the pool of labile dissolved organic carbon (DOC) (e.g.Anderson and Williams,1999;Kaehler and Koeve,2001) that is eventually turned over by heterotrophic bacteria. Such a la-bile fraction of DOC is unlikely to be significant for long-term carbon removal from the
5
upper ocean (Carlson et al., 1998). This would entail a negligible impact of carbon overconsumption on the biological carbon pump. An alternative pathway is the release of dissolved organic matter (DOM) by phytoplankton followed by the formation of par-ticulate organic matter (POM) and, at best, the export of carbon to the deeper ocean. Such a linkage between DOM and POM (linking the release of polysaccharides to the
10
formation of larger colloidal particles, which are measured as transparent exopolymer particles, TEP) has been shown byMopper et al.(1995),Zhou et al.(1998) andEngel and Passow (2001). Since TEP is relevant for the dynamics of phytoplankton aggre-gation, it was presumed to be involved in the removal of DOM and the export of POM. In the studies ofMopper et al.(1995) andZhou et al.(1998) a transformation of DOM
15
precursors to TEP was investigated qualitatively. Hereupon, different underlying mech-anisms have been discussed for this transformation (Passow,2002).
Two mechanisms have been proposed for TEP formation, spontaneous assembly (Chin et al.,1998) and particle coagulation (e.g.Logan et al.,1995) respectively. A TEP size spectrum analysis eventually provided evidence that TEP formation from DOM can
20
be well described with coagulation dynamics (Mari and Burd,1998). Subsequent stud-ies have picked up these preceding ideas but focused on the actual carbon content of TEP (TEPC) and its biogeochemical conjunction with DIC uptake, gross primary pro-duction and DOC exudation (Mari et al.,2001; Engel et al.,2002). In a recent study, the cascade from the exudation of acidic polysaccharides (PCHO) to TEPC formation
25
has been quantitatively assessed and the TEPC increase was successfully described with a simple parameterisation of the PCHO-TEP dynamics (Engel et al.,2004). En-gel et al. (2004) parameterised the complex process of polysaccharide aggregation in terms of a two size-class model, which describes the interaction between PCHO
BGD
4, 13–67, 2007Modelling carbon overconsumption and extracellular
POC formation
M. Schartau et al.
Title Page
Abstract Introduction
Conclusions References
Tables Figures
◭ ◮
◭ ◮
Back Close
Full Screen / Esc
Printer-friendly Version
Interactive Discussion and TEPC. This simplified approach was derived from a full size-class resolved model
(Smoluchowski equations) by assuming that the coagulation dynamics, under typical PCHO background concentrations, is close to steady state. Our understanding of the non-linear decoupling between PON and POC formation has improved during the last decade: We learned that the decoupling does not solely result from stoichiometric
5
variations within phytoplankton cells or from differential remineralisation, but can also result from extracellular PCHO coagulation. We believe that it is deemed necessary to account for such a process in biogeochemical- and ecosystem models used for carbon flux studies, in particular since it indirectly affects the aggregation and sinking of phy-toplankton (Jackson,2001), and thus mediates organic carbon export in the oceans.
10
With this study we propose a model that resolves the cascade from decoupled car-bon and nitrogen assimilation by phytoplankton to the formation of extracellular POC. We provide maximum likelihood based estimates of uncertain and unknown model pa-rameter values. The overall model is kept simple enough to become potentially suited for large-scale biogeochemical simulations. Here, we validate the model’s ability to
15
combine processes that are often regarded separately: 1) phytoplankton acclimation to nitrogen stress, 2) carbon overconsumption, and 3) exudation and coagulation of DOC. The model is calibrated with data from a mesocosm experiment, as presented inEngel et al.(2002). A bootstrapping approach is applied for parameter optimisation, in order to approximate errors for optimal parameter estimates. Special focus of our
20
modelling approach is on simulating the increase of TEPC, and their formation from the precursors PCHO. With our analysis we approximate the PCHO fraction of total DOC exudates and obtain maximum likelihood estimates of carbon specific coagulation ker-nels relevant for TEPC formation.
BGD
4, 13–67, 2007Modelling carbon overconsumption and extracellular
POC formation
M. Schartau et al.
Title Page
Abstract Introduction
Conclusions References
Tables Figures
◭ ◮
◭ ◮
Back Close
Full Screen / Esc
Printer-friendly Version
Interactive Discussion 2 Method
2.1 Model description
The model setup was chosen to reproduce conditions of a mesocosm experiment, as described in Engel et al. (2002). The mesocosm experiment was performed in a tank of 0.9 m height that was continuously stirred over a period of 20 days. The
5
mean temperature was 12.5◦C. A halogen light source provided a surface irradiance of 26 W m−2 (approx. 115µmol photons m−2s−1) with a light:dark cycle of 14:10 hours. 1226 liters of water were collected in the Santa Barbara channel at 6 meters depth, and sand filtered before being filled into the tank. The initial concentration of DIN was 35.5 mmol N m−3. Observations are available at 17 sampling dates, covering a period
10
of 20 days.
Phytoplankton growth – For this study we chose to adopt the growth
parameteri-sations ofGeider et al. (1998), which is often used as a basis for marine ecosystem models (e.g.Moore et al., 2001;Lima and Doney,2004). We only changed the step function for the maximum nitrate uptake rate (Eq.B7 in the Appendix). The function
15
suggested by Geider et al. (1998) is non-mechanistic and was formulated solely to simulate a rapid decline in nitrate uptake when a maximum cellular nitrogen-to-carbon (qmax) ratio is reached. Our formulation is also non-mechanistic, but avoids the strongly
non-linear discontinuity in the vicinity ofqmax, yet showing the same step
characteris-tics. All other equations for phytoplankton growth remain identical to those proposed
20
inGeider et al.(1998). Primary production is regulated by light availability (I), temper-ature (T), dissolved nutrient concentrations, and a variable cellular nitrogen-to-carbon ratio (q). The exact initial phytoplankton biomass was unknown (below detection limit; <0.1 (mmol N) m−3) but variations of small initial phytoplankton concentrations may result in biased parameter estimates. Therefore, the initial nitrogen biomass of the
25
phytoplankton was optimised in conjunction with the other model parameters. The es-timated initial nitrogen biomass is converted to carbon units assuming a molar Redfield ratio of C:N=106:16. Accordingly, the chlorophyllaconcentration (Chla) is derived by
BGD
4, 13–67, 2007Modelling carbon overconsumption and extracellular
POC formation
M. Schartau et al.
Title Page
Abstract Introduction
Conclusions References
Tables Figures
◭ ◮
◭ ◮
Back Close
Full Screen / Esc
Printer-friendly Version
Interactive Discussion applying a factor of 1.56 mg Chla(mmol N)−1. We extended the phytoplankton growth
model to a small ecosystem model that resolves nutrients, heterotrophic activity, the formation of detritus, leakage and exudation of DOM.
DOM and TEPC –In this study we focus on DOM exudation and extracellular POC
formation. Apart from the variable C:N stoichiometry during phytoplankton growth,
5
we also account for carbon and nitrogen decoupling as a result of TEPC formation. To accomplish this, the DOM pool represented in the model only consists of freshly exuded, labile compounds. Refractory DOM remains unresolved. The labile DOM pool is split up into PCHO, residual dissolved carbon (resDOC), and organic nitrogen compounds (DON). TEPC is regarded as a separate state variable. Residual DOC and
10
DON are unspecified fractions of DOM. Carbon overconsumption by phytoplankton is not only expressed by changes in cell quota but also in the nitrogen-to-carbon (N:C) ratio of DOM. The complex process of polysaccharide aggregation is parameterised in terms of a two size-class model, which describes the interaction between PCHO and TEPC (Engel et al.,2004). This two-size class model relates the exudation of PCHO
15
to the formation of TEPC and hence provides the key to understanding the decoupling of PON and POC formation, in particular if it is assumed that TEPC becomes largely detected as POC (Engel et al.,2002). In practice, cell lysis, exudation, and leakage of organic matter cannot be constrained separately. For this reason we solely distinguish between a carbon and a nitrogen loss rate. This separation becomes relevant because
20
active exudation of cellular carbon happens at times when organic nitrogen is only passively lost by phytoplankton in smaller quantities.
Dissolved inorganic carbon (DIC), DIN, and total alkalinity (TA) –Assuming thermo-dynamical equilibrium, the carbonate chemistry is constrained by two state variables, namely TA and DIC. TA in the model varies with the DIN and phosphorus acquisition
25
by phytoplankton and with remineralisation. In the model the unresolved phosphorus contribution to TA is assumed to be linearly linked to the nitrogen fluxes through the application of a constant nitrogen-to-phosphorus (N:P) ratio of 16. The flux of carbon dioxide (CO2) between the mesocosm and the air is calculated from temperature, DIC,
BGD
4, 13–67, 2007Modelling carbon overconsumption and extracellular
POC formation
M. Schartau et al.
Title Page
Abstract Introduction
Conclusions References
Tables Figures
◭ ◮
◭ ◮
Back Close
Full Screen / Esc
Printer-friendly Version
Interactive Discussion and TA with a routine from the Ocean Carbon-Cycle Model Intercomparision Project
(OCMIP; Orr, 1999), using a parameterisation for gas transfer velocity (Wanninkhof and Knox,1996) that takes into account the enhancement of gas exchange by hydra-tion reachydra-tions of CO2under very low wind conditions. A constant atmospheric pCO2of 370µatm is prescribed for the entire period of model integration. Measured values of
5
DIN, TA, and DIC at the beginning of the experiment were taken as initial conditions.
Detritus –Apart from leakage and exudation, additional phytoplankton nitrogen and carbon losses are associated with cell lysis due to bacterial activity and grazing by zooplankton. Fragments of cellular material, as a result of cell death, are described as a detrital compartment in the model. Also, the biomass of phytoplankton aggregates
10
enters the detrital pool, assuming that no significant primary production occurs within particle aggregates. This assumption has limitations but a detailed description of active cells among dead cellular material in particle aggregates is beyond the scope of this study. Similar to the aggregation parameterisation of PCHO and TEPC, we used an ap-proach for phytoplankton aggregation that has been tested byRuiz et al.(2002) against
15
a multi-size-class model, which in turn was calibrated with coulter counter observa-tions. InRuiz et al.(2002) it was shown that a zero order model, with two size class formulation, already captures the predominant particle dynamics, when compared with observations. We will use their parameterisation together with their parameter values. In the model, particulate matter of detritus is linearly degraded until it becomes
dis-20
solved, turning into resDOC. The pools of resDOC and DON are mineralised to DIC and DIN respectively.
Heterotrophs – In the mesocosm experiment, the heterotrophic activity remained
small. This was inferred from oxygen measurements that were used to determine gross- and net community production. A heterotrophic compartment is included as
25
a closure for modelling the nitrogen and carbon fluxes of the mesocosm experiment. The degree of freedom that is added to the model, by implementing the heterotrophic compartment, is not critical since it can be constrained by the measured net- and gross community production rates. An explicit representation of bacteria, protists, and
BGD
4, 13–67, 2007Modelling carbon overconsumption and extracellular
POC formation
M. Schartau et al.
Title Page
Abstract Introduction
Conclusions References
Tables Figures
◭ ◮
◭ ◮
Back Close
Full Screen / Esc
Printer-friendly Version
Interactive Discussion zooplankton for this modelling study, however, is considered as redundant unless their
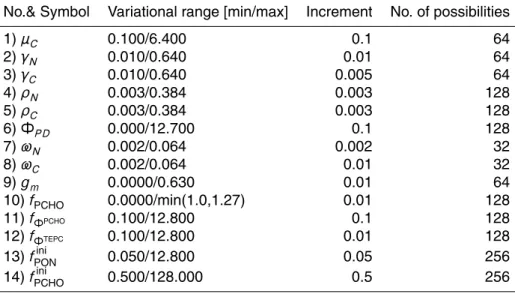
respective impact on PCHO exudation and TEPC formation can be well characterised. The model is run for 22 days. Overall, fourteen state variables simulate the dominant nitrogen and carbon fluxes within the mesocosm, Fig.1. An Euler forward scheme was chosen for numerical integration. A timestep of 5 min turned out to be appropriate.
5
Any further decrease in timestep did not yield different model results. A stochastic parameter optimisation then becomes applicable within reasonable computational time. The full model equations are listed in the Appendix.
2.2 Data assimilation and maximum likelihood estimation of parameter values
2.2.1 Definition of cost function
10
The form of our cost function used for optimisation can be derived from a Bayesian approach to data analysis. In the context of parameter estimation Bayes theorem reads
prob p|d,H, I=prob d|p,H, I· prob p|H, I
prob d|H, I
(1)
wherepis the array of unknown model parameters to be estimated from data,d, under
15
the hypothesisH(=model equations) and background informationI. We apply a flat prior, i.e. prob p|H, I is a constant over the allowed range of parameter values. In the context of parameter estimation the denominator prob d|H, Iis used as a normal-isation factor, i.e. it is a constant. Thus the probability distribution for the parameters, prob p|d,H, I, is proportional to the so-called likelihood
20
L(d|p,H, I)=prob d|p,H, I . (2)
Because of this proportionality, an increase of the probability prob(p|d,H, I) becomes tantamount to maximising the likelihoodL(d|p,H, I).
BGD
4, 13–67, 2007Modelling carbon overconsumption and extracellular
POC formation
M. Schartau et al.
Title Page Abstract Introduction Conclusions References Tables Figures ◭ ◮ ◭ ◮ Back Close
Full Screen / Esc
Printer-friendly Version
Interactive Discussion All data are assumed to be independent, therefore the likelihood function is given by
the product ofM·N (M types of observations,N sampling dates) probabilities:
L(d|p, H, I)= M
Y
i=1
N
Y
j=1
1 ǫi
√
2πexp
− mi j−di j 2
2ǫ2i
(3)
A Gaussian distribution is assumed for model variables (mi j) being able to match ob-servations (di j) with varianceǫ2i. Maximising the likelihood is equivalent to minimising
5
the negative logarithm of the likelihood
−ln(L)= M
X
i=1
−N·ln 1 ǫi √ 2π ! + N X
j=1
1
2ǫ2i mi j−di j
2
=constant+ M
X
i=1 N
X
j=1 1
2ǫ2i mi j−di j
2
| {z }
=J(cost function)
(4)
or minimising the cost functionJ which simply consists of the sum over the weighted least square data-model deviations.
10
There areM=8 different types of observations available: 1. dissolved inorganic nitro-gen (DIN), 2. dissolved inorganic carbon (DIC), 3. chlorophyll a (Chla ), 4. particu-late organic nitrogen (PON), 5. particuparticu-late organic carbon (POC), 6. carbon content of transparent exopolymer particles (TEPC), 7. gross primary production (GPP), 8. net community production (NCP). The duration of the experiment wasT=20 days and
sam-15
ples were taken on 17 days (N=17). Finally, we introduce information with respect to the accuracy of sampling times. The misfit between model results and data are usually calculated at discrete points in time. In cases where time lags are present in sampling, the parameter optimisation is then affected, and additional bias is introduced to the parameter estimates. In order to take into account uncertainties in sampling time, we
20
BGD
4, 13–67, 2007Modelling carbon overconsumption and extracellular
POC formation
M. Schartau et al.
Title Page
Abstract Introduction
Conclusions References
Tables Figures
◭ ◮
◭ ◮
Back Close
Full Screen / Esc
Printer-friendly Version
Interactive Discussion bring in time dependent variance information. The error variance is assumed to be
in-finite at times far away from sampling, which means that the data information remains infinitely small. But, as time approaches the specified moment of sampling, the data information of the measurement becomes significant. A Gaussian error distribution is assumed around the prescribed point in time of thej’th measurement on date (τj). A
5
sampling uncertainty of one hour is defined as variance (σt=1 h). The time dependency of the observational error can be described as:
ǫi j(t)2= σ
2
i E(t, τj)
(5)
with
E(t, τj)= 1
q
2πσ2
t exp
− t−τj
2
2σ2
t
(6)
10
The final cost function, which becomes subject to minimisation, is:
J= M
X
i=1
N
X
j=1
ZT
t=0
E(t, τj)
2σi2 mi(t)−oi j
2
d t (7)
In the limitσt →0 the Gaussian Eq. (6) becomes theδdistributionδj(t−τj). Inserting theδdistribution into Eq. (7) and integration overtleads us back to Eq. (4), withǫ2i=σ2
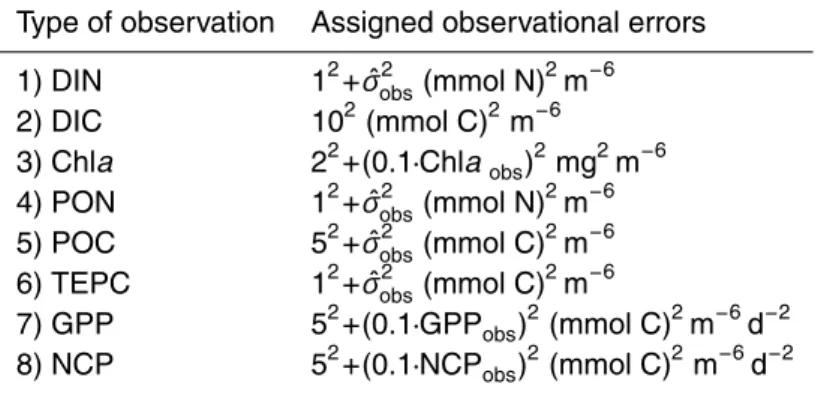
i . Table A1 summerizes the assumed error variances (σi2) that enter our calculations.
15
Under ideal conditions, a perfect model fit to observations would yield a minimum of the cost function close to the value of expectation ofN ·M – dim(p) =122 (number of independent measurements minus the number of adjustable model parameters). Nevertheless, this value can only be achieved, if the exact moment of sampling was known (σt=0), if observations were truly independent, if the assumed error variances
20
BGD
4, 13–67, 2007Modelling carbon overconsumption and extracellular
POC formation
M. Schartau et al.
Title Page
Abstract Introduction
Conclusions References
Tables Figures
◭ ◮
◭ ◮
Back Close
Full Screen / Esc
Printer-friendly Version
Interactive Discussion 2.2.2 Estimation of parameter values and errors
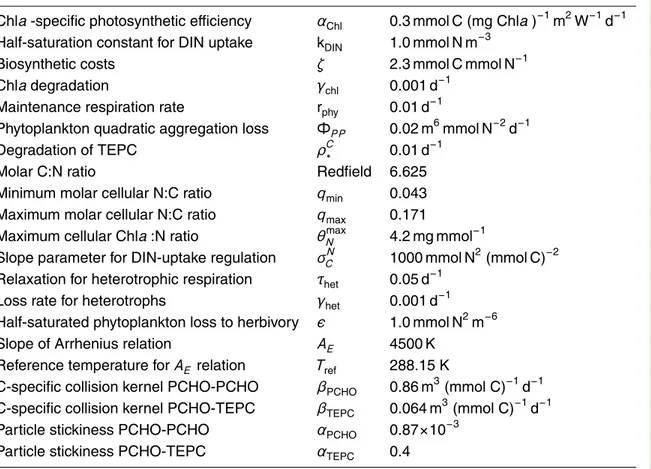
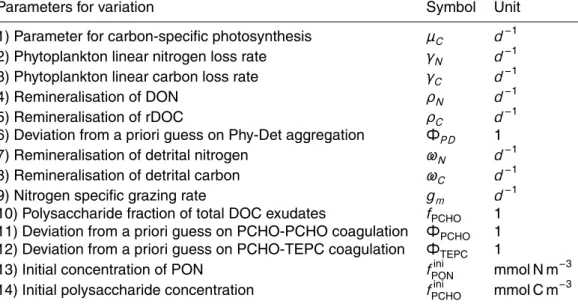
The model includes 31 parameters. We can assign fixed values to 17 parameters that are either well constrained or were approximated from other observational studies (e.g. parameters such as minimum and maximum cell quota), Table 1. Among the remaining 14 parameters are those that have not been measured directly, such as the
5
initial phytoplankton biomass concentration, Table 2. These initial concentrations are not a priori prescribed for phytoplankton and heterotrophs, in order to further reduce the bias in our parameter estimates.
Errors of the parameter estimates are determined from 9 additional optimisations with resampled data sets, which substitute the original observations. The measured
10
data are regarded as one realisation, which gives us a total of 10 realisations for the overall analysis. Thus, with this bootstrapping approach we artificially extend our data set to a greater number of realisations based on the presumed information about mea-surement errors. Gaussian noise was generated and added to the original observa-tional values. The Gaussian noise has a variance (σi2) identical to the one prescribed
15
for every observation in the cost function. Hence, resampled data remain fully con-sistent with original observations. For the calculation of parameter uncertainties the approach ofSchartau and Oschlies(2003a) is adopted. Here we will not only calculate error variances from all optimisation results ( ˆσSD), but also give explicit information on the bias. The bias ( ˆσB) is given by the deviation of the best parameter estimate ( ˆp0, 20
according to the lowest cost function of all realisations) from the mean value (p). Our error estimates include uncertainties of the optimisation algorithm, resulting from dif-ferences in convergence when approaching the minimum of the cost function. These uncertainties are inversely proportional to the cost function’s sensitivity to parameter variation. An explicit representation of the bias tells us whether our parameter
es-25
timates (mean values and standard deviations) conform to our prior assumptions of the data-model error distribution and prescribed observational variances. As a conse-quence, a poor parameter estimate can be identified when the bias is equal, or larger
BGD
4, 13–67, 2007Modelling carbon overconsumption and extracellular
POC formation
M. Schartau et al.
Title Page
Abstract Introduction
Conclusions References
Tables Figures
◭ ◮
◭ ◮
Back Close
Full Screen / Esc
Printer-friendly Version
Interactive Discussion than, the determined standard deviation.
2.2.3 Optimisation algorithm
A micro-genetic algorithm (µGA; Krishnakumar, 1989) is used for optimisation. The algorithm was originally programmed and applied byCarroll(1996). In data assimila-tion studies in the field of marine science this algorithm has been extensively tested
5
(Athias et al., 2000; Schartau, 2001). Stochastic or quasi-stochastic algorithms are recommended for cases where the cost function may contain a variety of local minima or has regions with plane-geometry with a very low sensitivity to parameter changes. Although highest accuracy can be achieved with gradient optimisation techniques (e.g. Vallino,2000), they may require a series of individual optimisations in order to find the
10
global minimum solution (Schartau et al., 2001). For this reason, a quasi-stochastic algorithm, such as theµGA, is better suited for our purpose despite the computational advantage of the gradient technique. TheµGA applied here assigns a single set of pa-rameters to an individual. This individual is coded as a binary string, similar to genes of a chromosome. A prescribed number of individuals is considered as one generation.
15
Within a generation, the algorithm selects individuals, which become eligible for recom-bination. Generally the best individuals (e.g. the parameter sets with the lowest cost function values) are selected. After selection, the recombination process (crossover of genes) generates a new generation of individuals (children) of which each one con-tains information of two selected individuals (parents). In addition, elitism principles are
20
expressed by retaining the best individual, passing him from one to the next offspring generation. This elitism operation ensures that the best parameter does not get lost after recombination. If one generation shows less than 5% difference among all indi-viduals, then a new random population is generated within the prescribed bounds of parameter values. The best individual is saved. This procedure guaranties a
conver-25
gence characteristic where the full parameter space is repeatedly explored while the algorithm converges towards the lowest point of the cost function. The configuration of theµGA is presented in TableA2in the Appendix.
BGD
4, 13–67, 2007Modelling carbon overconsumption and extracellular
POC formation
M. Schartau et al.
Title Page
Abstract Introduction
Conclusions References
Tables Figures
◭ ◮
◭ ◮
Back Close
Full Screen / Esc
Printer-friendly Version
Interactive Discussion 3 Results
3.1 Optimal parameter and state estimates
The proposed model is validated against observational data from a mesocosm exper-iment. For this reason, optimal model parameter values are determined, which min-imise the misfit between model result and data. The misfit is defined as a cost function,
5
Eq. (7). Together with resampled data, which are treated as additional realisations, we performed a total of 10 optimisations. All optimisations converge well to a destinct minimum of the cost function. In all cases, the minimum of the cost function is iden-tified after 35 000 iterations. No significant improvements are achieved up to 56 000 iterations (14 individuals x 4000 generations), which is the prescribed total number of
10
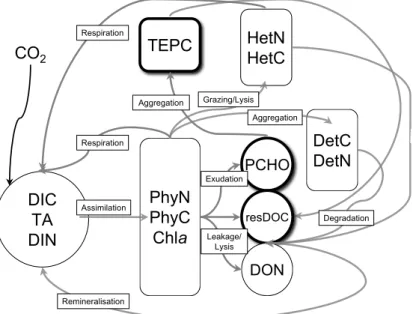
iterations. Initial cost function values range between 10 000<J<40 000, and the opti-misations reduce costs by two orders of magnitude, with solutions that range between J=257 andJ=468. Figure2shows the probability distribution (PD) of the outcome of all ten optimisations. According to the PD, the value of expectation for our optimisation problem is approximatelyJ≈280. This means that any repetition of the optimisation of
15
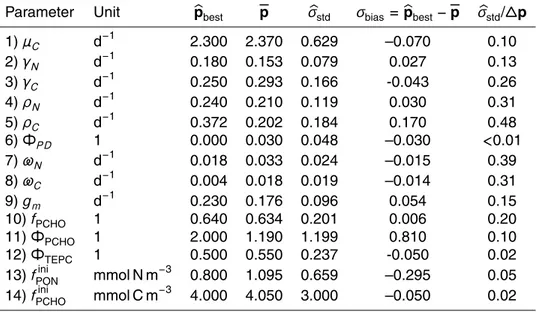
the same model, but with another resampled data set, must be expected to yield cost function optima close to this value. From the PD we learn that the optimisation prob-lem is well-posed; parameter values and their approximated errors are reproducible estimates. Table 3 shows all parameter estimates together with their errors, and the relative improvements with respect to their initial variational ranges.
20
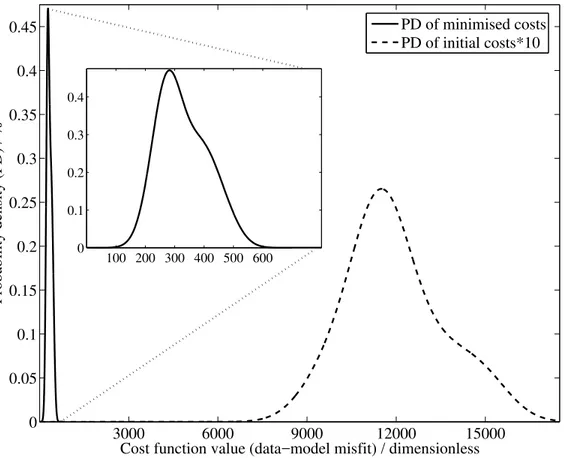
Model results exhibit significant variability on an hourly time scale. Such variability remains unresolved in data since all measurements were taken once a day, at times when phytoplankton was exposed to light, Fig.3. Differences between the ten optimal model state estimates are small, as indicated by the gray shaded envelope of all fitted solutions in Fig.3. Similar model trajectories (state estimates) are obtained, although
25
they represent fits to different resampled data. This indicates that the optimisation procedure is robust and that the model setup was chosen appropriately. The proposed parameterisations suffice to simulate the predominant dynamics involved in decoupling
BGD
4, 13–67, 2007Modelling carbon overconsumption and extracellular
POC formation
M. Schartau et al.
Title Page
Abstract Introduction
Conclusions References
Tables Figures
◭ ◮
◭ ◮
Back Close
Full Screen / Esc
Printer-friendly Version
Interactive Discussion the mesocosm’s carbon and nitrogen fluxes.
Figures 3a and 3b show the observed and modelled drawdown in DIN and DIC. The modelled uptake of DIC is sensitive to variations of the specific rate parameter for maximum photosynthesis (µC). Our estimate of µC=2.4±0.6 d−1 falls within the typical observational range and thereby hardly differs from those values that are
gen-5
erally observed under different laboratory- or mesocosm conditions (e.g.Geider et al., 1998). In contrast to purely nitrogen-based models, photosynthesis continues at times when phytoplankton growth is DIN limited. Thus, DIC concentrations further decrease although algal growth has ceased.
The modelled DIN uptake is somewhat slower than the increase in Chla
concentra-10
tion, when comparing Figs.3a and3c. Better model fits for the observed DIN drawdown cause a greater data-model mismatch in Chlaconcentration. This mismatch is asso-ciated with the purely nitrogen-based parameterisation of Chlasynthesis in the model, described in the discussion section. In spite of the systematic offset, the optimisation procedure finds a compromise solution between DIN uptake and Chlasynthesis. The
15
dates of DIN depletion and maximum Chlaconcentration between days 15 and 16 are resolved well by the model. The maximum Chlaconcentration is reached shortly after DIN becomes depleted, Fig.3c.
During the decrease in Chlaconcentration, the model maintains a constant concen-tration of PON, Fig.3d, which is primarily caused by the transformation of algal biomass
20
into detrital material and a simultaneous rapid degradation of Chla. In our model the aggregation of cells is regarded as a transformation of phytoplankton biomass into de-tritus. This transformation is adequately approximated by the quadratic term given in Eq. (B12). According to our optimisation, the more elaborate parameterisation ofRuiz et al. (2002) is found to be insignificant for explaining the data. This is stressed by
25
estimates of the dimensionless factor that is multiplied with the aggregation parame-terisation (ΦP D=0.03±0.05). The parameter ΦP D describes the deviation from our a priori assumption on aggregation. The equation ofRuiz et al. (2002), describing the coagulation of large detrital particles (marine snow) with phytoplankton cells, does not
BGD
4, 13–67, 2007Modelling carbon overconsumption and extracellular
POC formation
M. Schartau et al.
Title Page
Abstract Introduction
Conclusions References
Tables Figures
◭ ◮
◭ ◮
Back Close
Full Screen / Esc
Printer-friendly Version
Interactive Discussion support model solutions that are in agreement with our entire data set. Optimal model
solutions suggest that all detrital material during the experiment must have remained small in size. It can be explained by the gentle but constant stirring within the tank that seems to have significantly hindered the formation of larger marine snow despite the tremendous accumulation of biomass. We learned estimates for phytoplankton
ag-5
gregation strongly depend on the experimental setup of the mesocosm study. Indeed, measurements of size spectra are expected to provide the only reasonable constraint for validating parameterisations of phytoplankton aggregation.
Photo-autotrophic conditions prevail and heterotrophic activity in the optimised model solutions is small. In contrast to the transformation of algal biomass into detrital
mate-10
rial, the phytoplankton loss to herbivores, and thus to the heterotrophic pool, has only a minor impact on the Chla drawdown in the model. We obtain a small rate constant for the nitrogen specific loss rate, e.g. a maximum rate ofgm=0.18±0.1 d−1. From pre-liminary studies we found that a model closure, containing a separate compartment for heterotrophs, is needed to improve fits to gross primary production and net
com-15
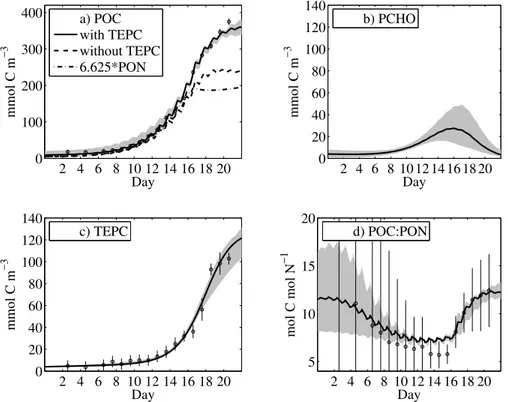
munity production. Both rate measurements are crucial constraints for determining the degree of heterotrophic activity during the mesocosm experiment. However, at the end of the simulation period (day 19 through 22), model results show the tendency to overestimate heterotrophic conditions, which cause elevated DIC and lowered POC concentrations, Figs. 3b and 4a. This tendency results from the respiration term of
20
the heterotrophic compartment in Eq. (B11). The relaxation towards a constant C:N ratio of 6.625 strongly enhances heterotrophic respiration at times when carbon-rich phytoplankton is consumed.
A key element of the model is the linkage between carbon assimilation by phytoplank-ton, loss of organic matter that replenishes the labile DOM pool, and the subsequent
25
formation of TEPC from DOC. Besides reasonable estimates for algal growth, we also find highly resolved rate constants for describing phytoplankton exudation of nitrogen and carbon (γN=0.15±0.08 d−1and γC=0.29±0.17 d−1). Standard deviation and bias remain small for both parameters. The carbon exudation rate is significantly larger than
BGD
4, 13–67, 2007Modelling carbon overconsumption and extracellular
POC formation
M. Schartau et al.
Title Page
Abstract Introduction
Conclusions References
Tables Figures
◭ ◮
◭ ◮
Back Close
Full Screen / Esc
Printer-friendly Version
Interactive Discussion nitrogen leakage. This stresses the importance of assigning distinct rates for nitrogen
and carbon losses by phytoplankton. The amount of organic carbon released by phy-toplankton largely depends on two factors: the photosynthetic rate and on the existing phytoplankton biomass respectively. In our study both factors are well constrained by DIC and Chladata, together with PON observations.
5
With our data-assimilative approach we are able to indirectly determine the amount of PCHO exudation as a fraction of the overall DOC loss by phytoplankton. The op-timisation yields results where the PCHO fraction of total exuded organic carbon is close to 63% (fP CHO=0.63±0.20). This is a substantial fraction, suggesting that the vast majority of exuded carbon can become subject to coagulation and can thus be
10
transformed into extracellular POC. Modelled POM concentrations reveal only small variations among the ten model runs, as indicated by the shaded area in Figs.3d and 4a. The decoupling between PON and POC formation becomes expressed during DIN depletion around day 16, coinciding with the initial decrease in Chla. Uncertainties in modelled PON and POC remain less than 10% during nitrogen-limited conditions.
15
Significantly lower POC concentrations are obtained if TEPC was omitted, and if a constant C:N conversion factor of 6.625 was multiplied with the modelled PON. As a consequence, the high POC concentration can only be explained by the carbon content of TEP, Fig.4b, in combination with detrital carbon and phytoplankton biomass.
InEngel et al.(2004) the parameters describing the interaction between PCHO and
20
TEP were determined on the basis of an individual data set obtained during a meso-cosm bloom experiment with the coccolithophore Emiliania huxleyi. In this study we adopt their a priori parameter estimates. However, in order to test the use of these parameter estimates for a more general situation, we define two dimensionless factors (ΦPCHO and ΦTEPC) that describe deviations of our parameter optimisation from the
25
prior assumption. In this way, we directly relate our new optimal guesses to the pa-rameter values determined inEngel et al.(2004). Because of the absence of explicit PCHO data for this mesocosm experiment, we find the a priori product of attachment probability and collision kernel for PCHO-TEPC coagulation better constrained than the
BGD
4, 13–67, 2007Modelling carbon overconsumption and extracellular
POC formation
M. Schartau et al.
Title Page
Abstract Introduction
Conclusions References
Tables Figures
◭ ◮
◭ ◮
Back Close
Full Screen / Esc
Printer-friendly Version
Interactive Discussion PCHO-PCHO interaction (σbΦPCHO>σbΦTEPC). The parameter uncertainty in PCHO-PCHO
coagulation thus directly translates into uncertainties in PCHO state estimates, Fig.4c. Despite of the described uncertainty, the mean value for PCHO-PCHO coagulation is in agreement with the values proposed inEngel et al.(2004).
A significant deviation from the a priori estimate is identified for TEPC-PCHO
coag-5
ulation. The model produces its best fit to the TEPC data when coagulation rates are half of those assumed a priori (ΦTEPC=0.55±0.24). Note that this estimate refers to a product of two parameters. We cannot specify how the 55% deviation is distributed between attachment probability and collision kernel. Although our optimal values for TEPC-PCHO coagulation are 55% smaller than presumed, the modelled transition of
10
PCHO to TEPC still depends primarily on the TEP concentration that has already been formed. This model result agrees with observations, showing no significant TEPC for-mation before day 10 of the experiment. Once a sufficient amount of TEP has formed, larger particles capture smaller particles more rapidly, which eventually initiates the distinct increase in TEPC concentration. It is at this transitional phase of accelerated
15
TEP formation where we also find the largest uncertainties in modelled PCHO concen-tration, Fig.4c.
The POC:PON ratio does not reveal any luxury consumption of nitrogen during the growth phase under DIN replete conditions, Fig.4d. Observational and model errors in POC:PON ratio at the beginning of the experiment follow from the division of small
20
biomass concentrations. We find diel variations in POC:PON ratio, as a consequence of variable light-dark conditions, because the C:N assimilation ratio increases while the phytoplankton is exposed to light. DIN is continuously taken up in the model, including the dark time periods. Around day 16, the POC:PON ratio rapidly increases from values around 7 to a maximum of 12 at day 22.
25
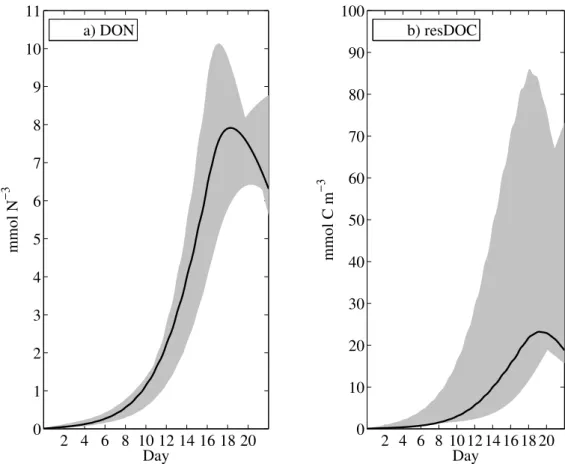
A fraction (37%) of the total DOC exudation replenishes the residual DOC pool (res-DOC) in the model. All dissolved organic carbon that is not specified as PCHO is as-signed to this compartment. Interestingly, our model results show how concentrations in resDOC can vary between 19 to 85 mmol C m−3 without altering TEPC
BGD
4, 13–67, 2007Modelling carbon overconsumption and extracellular
POC formation
M. Schartau et al.
Title Page
Abstract Introduction
Conclusions References
Tables Figures
◭ ◮
◭ ◮
Back Close
Full Screen / Esc
Printer-friendly Version
Interactive Discussion tion. It suggests that a portion of total DOC can, in principle, fuel microbial activity while
TEPC formation happens simultaneously. Two major sinks for DOC removal can exist in parallel. Variations in resDOC and DON in Fig.5 result from uncertainties in linear remineralisation rates (ρN=0.21±0.12 andρC=0.20±0.18). Moreover, our estimation of the carbon remineralisation rate for resDOC is hardly improved with our optimisation,
5
if compared with the initial range of variation, Table3. Similar to the remineralisation rates for DOM, the estimates for degradation and remineralisation of detritus remain uncertain (ωN=0.03±0.02 d−1andωC=0.02±0.02 d−1). However, our estimates show that the rate of detritus degradation must have been one order of magnitude smaller than the direct mineralisation of DOM. Thus, heterotrophic activity in the model is
sus-10
tained by DOM mineralisation. A sensitivity analysis (results not shown) reveals that the estimates of DOM mineralisation support phytoplankton growth during the nitrate-depleted phase and prevent a more drastic drawdown in phytoplankton biomass. Our optimal estimate of the DON turnover is largely constrained by the standing stock mea-surements of PON and Chladuring the post-bloom period (day 15 through 19).
15
Primary productivity in the mesocosm was determined from measured oxygen util-isation rates, which allows the distinction to be made between gross- and net com-munity production rates. In the model, total carbon assimilation by phytoplankton is the counterpart to observed gross primary production (GPP). Whereas modelled net community production (NCP) is set equal to the carbon assimilation minus
respira-20
tion of phytoplankton and heterotrophs, and minus remineralisation of resDOC, Fig.6. The consideration of NCP data for parameter optimisation turned out to be essential for constraining the dominant carbon and nitrogen closures in the model. Uncertain-ties in modelled productivity are comparable to observational errors. The best model trajectory of GPP matches measurements well. Observed NCP rates show large
fluc-25
tuations. Model results underestimate NCP at the beginning of the experiment, but eventually become consistent with maximum rates at days 15 and 16. In general, the data-model comparison of productivity indicates that net phytoplankton growth and respiration are well resolved, thereby supporting a reliable rate estimate of PCHO
BGD
4, 13–67, 2007Modelling carbon overconsumption and extracellular
POC formation
M. Schartau et al.
Title Page
Abstract Introduction
Conclusions References
Tables Figures
◭ ◮
◭ ◮
Back Close
Full Screen / Esc
Printer-friendly Version
Interactive Discussion dation.
According to our model results, carbon overconsumption can be split up into two dominant modes. In the absence of luxury nitrogen consumption, all carbon assimi-lated by phytoplankton leads to an accumulation of carbon in biomass and a concomi-tant increase in DOC. Biomass accumulation in phytoplankton continues as long as
5
growth exceeds all losses due to grazing by herbivores or particle aggregation. Dur-ing this phase of new production, the exuded organic carbon remains linearly linked to the nitrogen loss by phytoplankton, Fig. 7a. The linearity may already allow for a carbon exudation that exceeds the nitrogen loss multiplied by a carbon-to-nitrogen ratio of C:N = 6.625 (compare black with gray lines in Fig. 7a). Any excess in
or-10
ganic carbon exudation above Redfield during growth can be interpreted as the first mode of carbon overconsumption. The second mode is associated with an excessive carbon release by phytoplankton under nutrient limited conditions, at times when no biomass accumulates further. Figure (7b) shows organic carbon exudation relative to DIN assimilation by phytoplankton (DOC exudation normalized to DIN uptake). The
15
plot demonstrates how the increase in carbon loss during the first mode results from phytoplankton biomass accumulation, as indicated by a constant value of carbon loss per N-uptake. The correlation between N and C loss by phytoplankton lapses when new production has ceased. A decline in phytoplankton biomass initiated by nutrient limitation is associated with a maximum release of organic carbon (maximum carbon
20
overconsumption). If the proceeding growth phase allows a noticeable accumulation of PCHO (during mode one), then a significant portion of overconsumed carbon is likely to be rapidly transformed into POC (during mode two), which is eventually exported with fast sinking particle aggregates.
3.2 Sensitivity analysis
25
The model’s sensitivity to variations of parameter values can be directly deduced from Figs.3-6. In addition, we performed a sensitivity analysis, where the initial DIN con-centration has been varied between 5 and 50 mmol N m−3. Varying initial DIN
BGD
4, 13–67, 2007Modelling carbon overconsumption and extracellular
POC formation
M. Schartau et al.
Title Page
Abstract Introduction
Conclusions References
Tables Figures
◭ ◮
◭ ◮
Back Close
Full Screen / Esc
Printer-friendly Version
Interactive Discussion trations can be interpreted by analogy to winter DIN concentrations for different ocean
regions. DIN concentrations between 1 and 20 mmol N m−3simulate open ocean win-ter concentrations whereas higher values are more representative for coastal wawin-ters. In Fig.8 we find a persistent pattern of DOC exudation versus DON loss, where the two modes of DOM production described above are consistently well-defined. With
5
initial concentrations of DIN0=5 mmol m− 3
the modelled maximum exudation rate of DOC becomes approximately 6 mmol C m−3d−1 whereas a rate of 30 mmol C m−3d−1 is reached for DIN0=50 mmol m−
3
. Modelled DOC exudation normalised to DIN assimi-lation by phytoplankton exhibit a ratio around 2.3 mol C (mol N)−1under nutrient replete conditions that is invariant with changes in initial DIN concentration (as in Fig.7b).
10
As we consider two modes for carbon overconsumption we will also find two modes if we relate Chlato TEPC concentration. In Fig.9, a linear relationship exists between Chlaincrease and the build up of TEPC during the growth phase, at times when PCHO exudation is linearly linked with biomass accumulation. We find a nonlinear response in the TEPC:Chlaratio during the post-bloom period, which we could not specify. The
15
concurrence of the rapid increase in TEPC concentration during a phase of massive Chladegradation causes large uncertainties for deriving TEPC from Chla. Our sensi-tivity study indicates that a reasonable TEPC:Chlaratio for the post-bloom period can be derived if the amount of new production was known together with the maximum Chlaconcentration.
20
4 Discussion
A clear distinction must be made between primary produced biomass and POM that is formed from extracellular DOM. This differentiation becomes particularly relevant when biogenic changes in carbon budgets are investigated on the basis of nitrogen or phosphorus fluxes, because of differences in stoichiometry (C:N:P ratio). So far,
25
overconsumed carbon and an excessive DOC exudation was accounted for only in few modelling studies (e.g.Anderson and Williams,1998,1999), but TEP formation has
BGD
4, 13–67, 2007Modelling carbon overconsumption and extracellular
POC formation
M. Schartau et al.
Title Page
Abstract Introduction
Conclusions References
Tables Figures
◭ ◮
◭ ◮
Back Close
Full Screen / Esc
Printer-friendly Version
Interactive Discussion been largely neglected. Observational studies, however, clearly demonstrated the
rel-evance of TEPC production for correctly assessing organic carbon fluxes (e.g. Mari et al.,2001; Engel and Passow,2001). A basic modelling approach was presented byMari and Burd (1998). They applied a size-class model to explain observed TEP concentrations. Their model approach, focused on the coagulation process, with TEP
5
given in units of volume concentration. The rather descriptive character of TEP mea-surements made biogeochemical modellers disregard it. This arose out of the situation that TEP is generally measured either microscopically or colorimetrically as stained particles (Passow,2002), which does not provide a direct quantitative measure in car-bon or nitrogen units. Although the potential role of TEP for the biological pump has
10
been discussed before, many questions on how it can mediate oceanic carbon fluxes remain unanswered.
A qualitative connection between DOC exudation, TEPC formation and the export of marine snow (aggregates of POC) is now better understood (e.g.Jackson,1998; Engel et al.,2004). It is the connection between carbon overconsumption with TEPC
15
formation that attracts our attention. In a global, biogeochemical steady-state model, sensitivities in the biological pump are determined while varying POC:PON export ra-tios (Schneider et al.,2004). In their study, they assumed a CO2sensitive TEPC
forma-tion that instantly translates into an elevated POC:PON export ratio when atmospheric CO2 rise. They found a considerable increase in carbon export for small variations in
20
the C:N elemental ratio of POM. Their model is based on a steady-state assumption, which limits the applicability of their model. In reality the variability in TEPC concen-trations is high in space and time and largely depends on the seasonal dynamics of gross primary production and the actual accumulation of phytoplankton biomass. The model described here is capable of simulating a cascade from DIC uptake, through
25
DOC exudation to TEPC formation while resolving associated nitrogen fluxes. It has been shown that the formulated link between carbon overconsumption and extracellu-lar POC formation is reasonable and that the model provides a good starting point and tool for biogeochemical simulations.
BGD
4, 13–67, 2007Modelling carbon overconsumption and extracellular
POC formation
M. Schartau et al.
Title Page
Abstract Introduction
Conclusions References
Tables Figures
◭ ◮
◭ ◮
Back Close
Full Screen / Esc
Printer-friendly Version
Interactive Discussion 4.1 Modelling limitations
The model applied here includes simplified parameterisations of complex biological processes. From a biogeochemical point of view, any decision on whether an additional zooplankton or bacteria compartment is needed in order to better match observed POC and Chlaconcentrations, has to be well justified and must not distract from other
sub-5
stantial problems, such as modelling extracellular POC formation (a source for POC and a sink for DOC). If a single important process is neglected, the associated bias can mask benefits that are achieved elsewhere in the model, for example by having a mechanistic description of bacterial utilisation of DOM. Among marine biologists the decoupling of nitrogen from carbon utilisation by phytoplankton is already a well
es-10
tablished physiological attribute (e.g.Smetacek and Pollehne,1986). But only during the last decade, biogeochemical modellers started to appreciate biological models with variable carbon-to- nitrogen or carbon-to-phosphorus stoichiometry (e.g.Doney et al., 2002; Hood et al., 2006). Also, variable stoichiometric assimilation ratios should be coherent with the synthesis of Chla. We applied the parameterisation ofGeider et al.
15
(1998), where Chla synthesis is directly coupled to nitrogen utilisation of the phyto-plankton. By no means were we able to exactly simulate the observed DIN drawdown together with the rise in Chlaconcentration. In the model we find high nitrogen uptake rates during dark conditions of the light cycle, at times with a minimum in carbon as-similation and photosynthesis. The modelled Chlasynthesis clearly overestimates the
20
observed increase in concentration. This is a model deficiency, which leads to a sys-tematic error, although small. More elaborate descriptions for modelling Chlasynthesis account for an optimal allocation of carbon within the cell, in order to either further in-crease the cross-section for light absorption (high Chla:C and Chla:C ratio) or to invest more into cellular growth (Pahlow,2005, R. Armstrong, personal communication). It
25
is worthwhile modifying and testing our model version with the parameterisation sug-gested byPahlow(2005).
Our model includes a crude closure for grazing and remineralisation. For
BGD
4, 13–67, 2007Modelling carbon overconsumption and extracellular
POC formation
M. Schartau et al.
Title Page
Abstract Introduction
Conclusions References
Tables Figures
◭ ◮
◭ ◮
Back Close
Full Screen / Esc
Printer-friendly Version
Interactive Discussion tions of the mesocosm experiment, the simple closures suffice to account for the little
heterotrophic activity observed during the experiment. Under more realistic oceanic conditions, a separate model compartment for bacteria can be regarded. A potential difficulty in constraining a separate bacteria compartment must be expected, if TEPC formation is regarded as an additional sink for DOC, other than mineralisation.
Graz-5
ing by micro-zooplankton is oversimplified in the model and certainly needs refinement when attempting to simulate seasonal cycles in the ocean. The aggregation parame-terisation remains unconstrained and a true assessment of the equations proposed by Ruiz et al.(2002) is lacking for realistic oceanic conditions. A more detailed validation study is therefore desired, in particular since TEPC formation interacts with
phytoplank-10
ton aggregation. Alternative formulations for size- based marine snow formation were proposed (e.g.Kriest and Evans,1999). A model assessment of different approaches to simulate marine snow formation would be helpful. Overall, upgrading the mesocosm model setup to a more generic model version, which can be used for large-scale simu-lations, is feasible. For this, one can choose from the variety of proposed and published
15
biogeochemical closures.
4.2 Modelling primary production: What does it mean?
For prognostic studies in marine biogeochemistry, the assimilation of primary produc-tion data into ecosystem models is substantial since it often provides the only flux constraint besides much more uncertain sediment trap observations. A difficult task,
20
however, is to specify the correct model-counterpart to observed primary production rates, especially if data of14C-incubation measurements are used for data assimilation experiments (e.g.Evans,1999;Spitz et al.,2001;Schartau and Oschlies,2003b). Con-cerning14C-incubations measurements the answers remain controversial (e.g.Banse, 2002;Marra,2003). Whether measured rates are closer to gross- than to net
produc-25
tion is still unclear. For example, the possibility of TEP14C formation affecting measured PO14C production has not been discussed yet.
BGD
4, 13–67, 2007Modelling carbon overconsumption and extracellular
POC formation
M. Schartau et al.
Title Page
Abstract Introduction
Conclusions References
Tables Figures
◭ ◮
◭ ◮
Back Close
Full Screen / Esc
Printer-friendly Version
Interactive Discussion stresses how a major part of the freshly exuded DOC (which is a significant fraction
of the gross production) can form colloidal particles that become large enough to be retained on filters used for the quantification of POC. We find carbon exudation rates that are higher than the loss of DON, which suggests that from DON alone it is difficult to directly infer an accumulation of labile DOC. This clarification, allowing one to better
5
distinguish between net and gross primary production, will help modellers in assessing their simulation results. If net primary production is simply understood as the trans-formation of DIC to POC, and given that extracellular POC trans-formation happens, then all nitrogen- or phosphorus based ecosystem-models are biased. Such bias seems negligible in regions where little primary produced biomass accumulates (e.g. in
olig-10
otrophic provinces). In eutrophic regions, on the other hand, most carbon will be trans-ferred through higher trophic levels before being exported and phytoplankton biomass will be top-down controlled. A bias is likely to become significant in temperate waters, if ecological conditions allow a substantial phytoplankton biomass accumulation before either nitrogen or phosphorus becomes depleted. The post-bloom period would then
15
be the typical timeframe for systematic data- model misfits in primary production, if TEPC formation were disregarded. Regions with iron limitation are a possible excep-tion, because photosynthetic rates, DIC uptake and thus DOC exudation are limited there.
4.3 Linkage between carbon overconsumption, particle formation and export
20
Many biogeochemical modelling studies refer to the concept of new production, cal-culated from the phytoplankton’s uptake of freshly entrained nitrate within the upper ocean’s light-lit layers (Dugdale and Goering, 1967). If nitrogen fixation is negligible, this new production must equal the vertical export of organic matter because of mass conservation (Eppley and Peterson,1979). Whether this assumption is appropriate for
25
deriving marine carbon cycles solely from nitrogen or phosphorus fluxes is question-able. Our model approach provides a link from phytoplankton growth and its variable stoichiometry to TEPC formation. Modelling the source of TEP (preferentially given
BGD
4, 13–67, 2007Modelling carbon overconsumption and extracellular
POC formation
M. Schartau et al.
Title Page
Abstract Introduction
Conclusions References
Tables Figures
◭ ◮
◭ ◮
Back Close
Full Screen / Esc
Printer-friendly Version
Interactive Discussion in carbon units rather than xanthan gum equivalents) will subsequently improve the
modelling of marine snow formation (Passow et al., 1994; Logan et al., 1995; Pas-sow, 2002). For example, in the presence of TEP the overall coagulation rate is not only affected by increasing total effective particle concentration but also by enhancing the probability of two particles sticking together after collision (Jackson,1998;Engel,
5
2000). Resolving physiological acclimation of phytoplankton and accounting for the origin and fate of freshly exuded organic matter will likely alter simulations of biogenic carbon export.
Imbalances between nitrogen uptake and carbon based primary production are of-ten explained with local biological processes, such as DON utilisation by
phytoplank-10
ton or nitrogen fixation. Furthermore, excessive DIC uptake during apparent N or P depletion is believed to locally accumulate in DOC. But to identify conditions for carbon overconsumption is not straightforward and must not be confused with purely physical reasons that cause local excessive DIC drawdown. For example,Michaels et al.(1994) noted carbon imbalances near Bermuda at the site of the Bermuda Atlantic Time series
15
Study (BATS). At the BATS site the measured excess DIC drawdown can be explained largely by a southward advection of water masses from regions with higher biological productivity. But a local, non-advective biological effect appears to be important as well (Toggweiler,1994). The time derivative of DIC was analysed and Toggweiler (1994) found the fastest drawdown of DIC during May, at a time when oceanographic
condi-20
tions are identified to have a minimum effect on DIC changes. A biological contribution to the overall carbon imbalance must be expected and it becomes maximal at a time when nitrate concentrations have just run below the detection limit.
Our study supports the idea of Anderson and Pondaven (2003) that biology does provide a significant contribution to carbon overconsumption, with carbon being
chan-25
nelled through the DOC pool. However, we propose not to omit alternative sinks for DOC other than bacterial degradation. In our model solution a large fraction of phyto-plankton carbon overconsumption goes into TEPC and the smaller portion accumulate as residual, labile DOC. The model sensitivity study shows that several factors control
BGD
4, 13–67, 2007Modelling carbon overconsumption and extracellular
POC formation
M. Schartau et al.
Title Page
Abstract Introduction
Conclusions References
Tables Figures
◭ ◮
◭ ◮
Back Close
Full Screen / Esc
Printer-friendly Version
Interactive Discussion TEPC formation. At oligotrophic sites the accumulation of phytoplankton biomass
re-mains low while bacteria have relative high abundance (e.g. around 0.3 mmol N m−3at the BATS site). Therefore all fresh DOC is likely to be consumed. If we reduce the initial concentration of DIN in our model from 35 mmol N m−3 to 1 mmol N m−3 (comparable with maximum possible surface concentrations near Bermuda), the TEPC
concentra-5
tion reaches no more than 15 mmol C m−3 at day 22. To what extent such low TEPC concentration can contribute to POC export is unclear. A relationship between carbon overconsumption and POC export will depend on the amount of biomass accumulation that promotes the second mode of carbon overconsumption, as shown in our sensitivity study.
10
In the paper ofWells(1998) the importance of marine colloids and their aggregation to form larger particles was stressed. His discussion primarily referred to the findings of Chin et al. (1998), who investigated the transformation of dissolved organic sub-stances to form large, sinking conglomerates. They used ideas of polymer gel theory to interpret the colloidal formation dynamics in terms of a self-assembling process. The
15
term “self-assembly” is rather broad and applies to spontaneous aggregation and for-mation of ordered structures when pre-existing components (separate or distinct parts of a disordered structure) are mixed in correct proportions (Evans and Wennerstr ¨om, 1999). The process is reversible and involves systems that are at thermodynamic equi-librium. “Self-assembly” is thus not synonymous with formation of structures during an
20
irreversible growth process proceeding in a steady state away from the thermodynamic equilibrium. For a kinetic growth process, such as coagulation, the components must be able to move with respect to one another. If the components attach irreversible when they collide, they form fractal-like aggregates (Mari and Burd,1998) rather than reg-ular structures, which are formed by self-assembly. Nevertheless, coagulation of
pre-25
existing components can involve self-assembling processes. This can be the case if components are able to equilibrate between aggregated and non-aggregated states, or to adjust their positions relative to one another in the space of an aggregate. Both spon-taneous self-assembly (Chin et al.,1998) and particle coagulation (e.g.Mari and Burd,