nonprofit organizations in Brazil
Marcelo Marchesini da Costa
University at Albany (State University of New York) New York / USA
Insper
São Paulo / SP - Brazil
his research analyzes the efects of the density of nonproit organizations and government-nonproit collaboration on human development and income inequality in Brazil. Governance studies assume that government-nonproit collaboration leads to improved societal outcomes. his research tests this hypothesis in 5,562 Brazilian muni-cipalities using ordinary least squares regressions and spatial models. Spatial analysis enables the identiication of speciic efects occurring across diferent regions. he rate of contracts between the federal government and nonproits in each Brazilian municipality is associated with the decrease of income inequality, but it is also sig-niicantly associated with a lower level of human development. he density of nonproits from diferent ields of activity presents diverse relations with human development and inequality. hese results enable a more realistic analysis of governance arrangements, considering their impact over communities and the local realities.
Keywords: governance; collaboration; nonproits; impact; government.
Análise de colaborações entre governo e ONGs e da densidade de ONGs no Brasil
Esta pesquisa analisa os efeitos da densidade de organizações sem ins lucrativos (ONGs) e da colaboração entre governo e ONGs no desenvolvimento humano e na desigualdade de renda no Brasil. Estudos de governança air-mam que colaboração do governo com ONGs leva a melhores resultados sociais. Esta pesquisa testa essa hipótese em 5.562 municípios brasileiros usando modelos lineares e espaciais. Análises espaciais permitem a identiicação de efeitos especíicos ocorrendo em diferentes regiões. A taxa de convênios entre o governo federal e ONGs em cada município brasileiro está associada com uma diminuição da desigualdade de renda, porém está também associado com uma signiicativa queda do nível de desenvolvimento humano. A densidade de ONGs de diferen-tes áreas de atividade apresenta diversas relações com desenvolvimento humano e desigualdade. Esses resultados permitem uma análise mais realista de arranjos de governança, considerando seus impactos nas comunidades e as realidades locais.
Palavras-chave: governança; colaboração; ONGs; impactos; governo.
Análisis de colaboraciones entre gobierno y ONGs y de la densidad de ONGs en Brasil
Esta investigación analiza los efectos de la densidad de organizaciones sin ines de lucro (ONGs) y de la colabo-ración entre gobierno y ONGs en el desarrollo humano y desigualdad de renta en Brasil. Estudios de gobernanza airman que la colaboración del gobierno con ONGs resulta en mejores resultados sociales. La investigación prueba esa hipótesis en 5.562 municipios brasileños utilizando modelos de regresión lineales y espaciales. Los análisis espaciales permiten la identiicación de efectos especíicos en distintas regiones. La tasa de acuerdos entre el gobierno federal y las ONGs en cada ciudad brasileña se asocia con la disminución de la desigualdad de ingresos, pero también se asocia signiicativamente con un menor nivel de desarrollo humano. La densidad de ONG de diferentes campos de actividad tiene diferentes relaciones con el desarrollo humano y la desigualdad. Esos resultados permiten un análisis más realista de acuerdos de gobernanza, considerando sus impactos en las comunidades y las realidades locales.
Palabras clave: gobernanza; colaboración; ONG; impacto; gobierno.
DOI: http://dx.doi.org/10.1590/0034-7612155003
1. INTRODUCTION
his research analyzes the inluence of government-nonproit partnerships and the density of non-proit organizations (NPOs) on key social indicators in Brazil. Since the 1980s, collaborations between governments and private organizations increased and have been promoted around the world as a way to achieve improved results for the society (Milward and Provan, 2000; Salamon, 2002). he increase on collaborations is supported by the frustration with the government’s ineiciency in solving relevant social problems, along with the recognition of the potential of NPOs and companies in identifying societal demands (Saidel, 1991; Milward and Provan, 2000; Salamon, 2002; Rhodes, 2012).
here are concerns, however, about the impact of government-NPOs partnerships, since they can create problems in terms of accountability, as well as deviation of NPOs mission, taking them away from their original goals and from communities’ priorities (AbouAssi, 2013; Banks, Hulme and Edwards, 2015). In order to assess the potential beneits to society of diferent governance arrange-ments, this research investigates whether there is evidence that collaborations between governments and NPOs improve human development and reduce income inequality.
hus, this analysis evaluates the beneits for society in terms of human development and inequality variation. Human development is related to indicators of health, education, and income generation, while inequality reveals structural patterns in the society. hese measures capture both the efect of NPOs service provision, and the results regarding advocacy or actions toward structural changes.
he present study is focused on NPOs, but it brings arguments that may also support public ad-ministrators, researchers, and other private actors, given that cross-sectoral arrangements are oten suggested by and to these actors. While there are many analyses of governance in the United States and Europe (Börzel, 2012; Cornforth, Hayes and Vangen, 2015), there is less information about gov-ernance in the global South, and in countries with a reduced state capacity (Risse, 2013). hus, this study contributes to ill this gap by analyzing governance arrangements and their social impact in all
5,562 Brazilian municipalities.1
he methodology adopted here includes tests for spatial autocorrelation, OLS regressions and spatial models (Anselin and Rey, 2014). Results indicate that municipalities with higher rates of government-NPOs collaborations in Brazil are associated with a decrease in income inequality from the years 2000 to 2010, and are also associated with a decrease in human development in the same period. hat is, partnerships between the federal government and NPOs may contribute to a more equal society, but are detrimental to human development. It is not clear what causes this relationship, but it may indicate that social service provision through government-NPOs collaborations contrib-utes to income redistribution, but is less eicient than alternative forms of providing social services, such as direct provision from the government. Moreover, the results regarding density of NPOs vary according to the diferent ields of activity. NPOs from several ields of activity are associated to a decrease in the level of human development, but advocacy groups and professional associations have a positive relationship with such indicator. Professional associations are also the only ield associated
1 Brazil had 5,570 municipalities in 2015. his paper does not include six municipalities created since 2010, besides Fernando de
with a reduction in income inequality. Tests reveal spatial efects in human development and inequality. Spatial methods show that human development extends from one municipality to another, and that regional factors may be inluencing inequality in diferent parts of the country. hese indings should not be considered as conclusive causal relationships. here are many complex variables afecting human development and inequality. he signiicant statistical associations, however, challenge the argument that collaboration is always a desirable policy. Qualitative studies are needed to explain the relationships found.
his paper is structured in ive sections. First, there is a literature review on government-NPOs collaboration and governance, emphasizing research related to the expected outcomes of these ar-rangements. he second presents method and data used in the research. he third section describes the key elements of the third sector in Brazil, presenting the results from exploratory analysis. he fourth section presents the results from spatial models, associating indictors with diferent ields of nonproit activity and collaborative arrangements. he inal section presents the implications of this study, questions for further analysis, and highlights research limitations.
2. LITERATURE REVIEW AND HYPOTHESES
Since the 1980s, several areas adopted the term governance, not always with the same meaning (Levi-Faur, 2012). In general, the concept of governance is associated with changes in the processes and structures through which the society is managed, involving the re-deinition of boundaries between the government, for-proit, and nonproit organizations (Rhodes 2012). Governance connects “a network of actors who operate in various domains of public policy” (Milward and Provan, 2000:360). Among these actors, this paper is particularly interested in governance arrangements between governments and NPOs. he concept of NPO refers to organizations that are private, self-governing, voluntary, and not proit-distributing (Salamon and Anheier, 1999). In Brazil, these organizations are part of a
universe identiied by the government agency as Fundações Privadas e Associações Sem Fins
Lucrati-vos (Fasil) (IBGE, 2010). Despite a relevant debate on the proper nomenclature, here the concept of
NPO refers to all of these organizations, given the goal of highlighting the heterogeneity in this ield. he diversity of these organizations is observed, for example, in their multiple organizational forms and areas of activity (Boris, 2006; Anheier, 2014).
Salamon (2002) suggests that governance changes the focus of policy analysis of government agencies to programs or governance tools. Collaboration is oten a condition to governance tools, leading to an increasing literature that discusses collaborative governance. here are diferent deinitions of collaboration, and these arrangements may be more or less frequent and intense. Focused on the analysis of the general outcomes of these governance arrangements in Brazil, in this study the terms collaborations or partnerships appear interchangeably, and these relation-ships are understood as “formalized, joint-working arrangements between organizations that remain legally autonomous while engaging in ongoing, coordinated collective action to achieve outcomes that none of them could achieve on their own” (Cornforth, Hayes and Vangen, 2015:6).
he governance tool analyzed here are convênios, a contracting mechanism intensely adopted for
Generally, the governance literature assumes that collaboration between diferent sectors leads to improved outcomes for the society when compared to organizations working in isolation from one another (Milward and Provan, 2000; Salamon, 2002; Salamon and Toepler, 2015). he choice of collaborative arrangements, however, involves those who participate and how they inluence the policies that are carried out (Salamon, 2002). Each form of collaboration between the government and NPOs changes the system of accountability, afects the legitimacy, and creates new management challenges for the diferent actors involved (Salamon, 2002; Banks, Hulme and Edwards, 2015). hus, it is important to know whether or not a governance arrangement delivers the intended societal beneit, justifying eventual ineiciencies during the process.
Despite the argument that government-NPOs collaborations present better outcomes for the society (Milward and Provan, 2000), a great part of the literature emphasizes detrimental organi-zational consequences for NPOs working in these arrangements (Frumkin, 2002). Several authors discuss, for example, how collaboration with the government leads to bureaucratization (Frumkin, 2002) and restricts the political activity of NPOs (Nicholson-Crotty, 2007; Schmid, Bar and Nirel, 2008; Guo and Saxton, 2010; Verschuere and De Corte, 2015). It is less common to ind debates about the broader consequences of these arrangements for society. hat is, even if NPOs sufer detrimental organizational consequences when they collaborate with the government, how is the society afected by these collaborative arrangements?
he irst and main hypothesis in this research assesses societal outcomes of government-NPOs collaborations. he choice to discuss collaborations by focusing on contracting mechanisms with resource transfers tests the argument that NPOs receiving funding from the government change their priorities to continue receiving funding, instead of focusing on policy goals (Mosley, 2012). Human Development Index (HDI) is the irst societal outcomes analyzed here because it is a measure that captures beneits from service delivery in the ields of education, health, and income generation (Anand and Sen, 1994; UNDP, 2015). Atack (1999) argues that NPOs have unique characteristics, such as their access to the communities, which allow them to contribute to the improvement of development indicators. Ranis, Stewart, and Ramirez (2000) state that NPOs are typically oriented toward human development objectives. here are, however, criticisms to the HDI for not incor-porating distributional issues (Grimm et al., 2008; Permanyer, 2013). In order to complement the analysis of social impact, this research also analyzes efects on the Gini coeicient, which measures income inequality. Brazil is one of the most unequal countries in the world, despite the reduction of income inequality during the 2000s, which is attributed to government cash transfer programs that made unskilled labor relatively less abundant (Lustig, Lopez-Calva and Ortiz-Juarez, 2013). Previous studies also adopt Gini as a measure of the need for NPOs’ activity in communities (Koch et al., 2009; Sokolowski, 2013).
he arguments previously presented generate an expectation that government-NPOs collabora-tions funded by the government have beneits in terms of HDI through the expansion of social service provision, but remove NPOs from actions that promote rights for the citizens, limiting their impact on inequalities (Neal, 2008; Banks et al., 2015).
In addition to the main hypothesis, two additional analyses complement this study. First, it is important to understand the contribution from NPOs, independent of their collaboration with the government. Full collaboration with the government and NPOs’ full autonomy may be two ends of a continuum that includes diferent degrees of collaborations and autonomy. herefore, in addition to debating on whether collaboration is beneicial or not, it is also necessary to identify NPOs’ outcomes. Given the complexity and heterogeneity in the nonproit sector (Boris, 2006), diferent outcomes are expected from NPOs working in distinct ields of activities. Nonproit organizations may be from ields typically focused on service provision, such as housing, social services, health care and education, or from ields related to community building, identity, and structural causes, such as cultural organi-zations, advocacy groups, and professional associations (Salamon et al., 2013). Given the outcomes analyzed here — human development and inequality — service providers are expected to improve human development, while expressive NPOs may contribute to a more equal society.
H2: he density of NPOs from ields of activity closely related to service provision improve human development, while the density of NPOs from ields related to community building, identity and structural causes reduce income inequality in each municipality.
he inal hypothesis in this paper veriies if there is geographical variation in social impact of government-NPOs collaboration and NPOs’ density. he few studies analyzing social impact of NPOs and their collaboration with the government usually discuss a speciic ield of activity and a limited geographical area (Kearns, Park and Yankoski, 2005; Scott et al., 2006; Suda, 2006). What would the results be when considering a whole country at municipal level? Are there spatial efects inluencing the outcomes considered here? Given the nonproit sector’s diversity and the huge regional variation in the characteristics of Brazilian municipalities, it is expected that signiicant spatial efects will be found in how nonproits and government-NPOs collaborations afect human development and inequality.
H3: here are signiicant spatial efects of the density of NPOs and the collaborations govern-ment-NPOs that inluence the societal outcomes at municipal level.
Based on this theoretical framework, the next section presents the method adopted to test these hypotheses.
3. METHOD
his paper adopts quantitative methods including OLS regressions and spatial models. Spatial anal-ysis provides tools for testing if a phenomenon is randomly distributed in diferent units, and if this phenomenon is conditioned by what is happening in nearby units, or by features of distinct units (Dale and Fortin, 2014). Municipalities are the unit of analysis in this research.
The dependent variables2 are: a) Difference in the municipal HDI3 from 2010 to 2000
and b) Diference in municipal income inequality from 2010 to 2000, measured by the Gini
2 Diferent dependent variables were previously tested, such as the HDI and Gini in 2010. Results in this case were not positive for
col-laboration and diverse for density of NPOs. An anonymous reviewer highlighted the importance of using diference in these variables from 2000 to 2010, in order to properly capture the efect of independent variables.
Continue
coeicient.4 Data on HDI and Gini come from the Brazilian censuses of 2000 and 2010, compiled
by the United Nations Development Program.5 he independent variable that indicates
collabora-tion between NPOs and government is c) the rate of convênios between nonproits and the federal
government per 100,000 inhabitants in each municipality, from 2000 to 2009. he efect of the
total sum of resources from convênios per capita was also tested, but because of the high
correla-tion between this variable and the number of convênios, and because results were not signiicantly
diferent, the research focused on the efect of the rate of convênios per 100,000 inhabitants. his
data was obtained through an oicial request of information to the federal government6. Other
independent variables are: d) the rate of NPOs per 100,000 inhabitants created between 2000 and
20097, according to their ten oicial ields of activity, e) the local government´s investments per
capita made between 2000 and 2009,8 as a measure of state capacity, f) variation in total
popula-tion between 2000 and 2010, g) variapopula-tion in rural populapopula-tion between 2000 and 2010, and h) the omitted dependent variable — that is, HDI when the dependent variable is Gini, and Gini when the dependent variable is HDI. Other controls were not added, given that HDI is composed of several variables that would cause problems of multicollinearity. Data from NPOs’ areas of activity
in each municipality come from a second request for information to the federal government.9 Table
1 presents a summary of statistics for these variables.
TABLE 1 SUMMARY OF STATISTICS
Variable Description Min Mean Max
DifIDH Difference in HDI between 2010 and 2000 0.03 0.13 0.32
DifGINI Difference in Gini between 2010 and 2000 -0.38 0.05 0.24
ConvPC Rate of convênios between 2000 and 2009 per 100,000 inhabitant 0 16.54 548.08
VConvPC Rate of values from convênios between 2000 and 2009 per 100,000 inhabitant
0 199 27,308
Rhab00 Rate of housing NPOs per 100,000 inhabitant created between 2000 and 2009
0 0.09 47.10
4 he Gini coeicient varies from zero to one, with higher values indicating a higher level of inequality.
5 Atlas Brasil. Available at: <www.atlasbrasil.org.br/2013/>. Accessed on: 14 Feb. 2015.
6 Protocol number 16853.000393/2015-45.
7 here is also an expected efect of the NPOs existing before 2000. However, given that the 2000s witnessed a higher rate of nonproit
organizations’ creation, and that the rate of previous NPOs is a strong indicator of NPOs’ location (Marchesini da Costa 2016), the measure of nonproits created between 2000 and 2009 serves as a proxy for nonproit density.
8 Available at: <www.ipeadata.gov.br/>. Accessed on: 21 Sept. 2015.
9 Protocol number 03950.001988/2014-97. he Brazilian government provides aggregate data on the nonproit sector through the Fasil
Variable Description Min Mean Max
Rsau00 Rate of health NPOs per 100,000 inhabitant created between 2000 and 2009
0 0.76 62.55
Rcul00 Rate of cultural NPOs per 100,000 inhabitant created between 2000 and 2009
0 10.16 339.37
Redu00 Rate of education NPOs per 100,000 inhabitant created between 2000 and 2009
0 2.66 81.16
Rwel00 Rate of social assistance NPOs per 100,000 inhabitant created between 2000 and 2009
0 7.38 457.10
Rrel00 Rate of religious NPOs per 100,000 inhabitant created between 2000 and 2009
0 12.90 168.63
Rpro00 Rate of professional associations per 100,000 inhabitant created between 2000 and 2009
0 22.36 416.71
Renv00 Rate of environment NPOs per 100,000 inhabitant created between 2000 and 2009
0 0.84 136.18
Radv00 Rate of advocacy NPOs per 100,000 inhabitant created between 2000 and 2009
0 17.36 845.86
Roth00 Rate of NPOs from other fields of activity per 100,000 inhabitant created between 2000 and 2009
0 10.31 210.97
InvMunPC Local government investment per capita between 2000 and 2009 (R$) 0 1,089 25,045
DifPopT Difference of total population between 2010 and 2000 -35,360 3,766 816,300
DifPopR Difference of rural population between 2010 and 2000 -519,906 -362 46,353
Source: Created by the author using data described in this section.
Section 3 presents a summarized historical evolution of Brazilian nonproit organizations, in addition to ordinary least squares (OLS) regressions, and diagnostics of spatial autocorrelation.
Si-multaneously to the OLS regressions, these diagnostics10 indicate what kind of spatial process occurs
in each case. Moran’s I is the main diagnostic of spatial autocorrelation, and the conirmation of
spatial efects leads to Lagrange Multipliers tests,11 which indicate the most appropriate spatial model
for each case (Anselin and Rey, 2014). Ater the spatial models, it is possible to compare the Akaike Information Criterion (AIC) to determine if the spatial models provide a better explanation to the phenomenon than the OLS regressions (Anselin and Rey, 2014).
he spatial models tested here are spatial error and spatial lag (Anselin, 2005; Anselin and Rey, 2014). he spatial error model indicates if there are omitted variables afecting neighboring units
dis-10 All spatial analysis is sensitive to the manner in which spatial weights are speciied. his research uses a threshold distance contiguity
matrix to capture connectedness among units.
tinctively, which causes correlation among their error terms, while the spatial lag model investigates if events in one unit increase the likelihood of that same event in its neighboring unit (Baller et al., 2001). Formally, a spatial error term (Anselin and Rey, 2014) is given by:
yi = bXi + mi
mi = λWm + ∈
he dependent variable at unit i is given by the coeicient b for the independent variable X in that
same unit, plus an error term that is spatially dependent (Wm). In this case, λ is the autoregressive
spatial coeicient, and is the remaining – non-spatially dependent – error term. hat is, there are regional factors afecting neighboring units and making their error terms correlated.
A spatial lag model (Anselin and Rey, 2014), in matrix notation, is given by the equation:
yi = aWi,j yj + bXi+ mi
hat is, if is the dependent variable at unit i, a is the autoregressive spatial coeicient; Wi,j is the
spatial weight specifying the spatial relationship between units i and j; yjis the dependent variable at
unit j; b is the coeicient for the independent variable; Xi is the independent variable at unit i; and mi
is the error term at that same unit, this means that the value of a dependent variable at the unit i is
given by the value of that same variable in its neighbor units, plus the efect of independent variables and error terms at that unit.
he sotware R (R Core Team, 2015) and Geoda (Anselin, Syabri, and Kho, 2006) enabled all the models and tests. Ater explaining the methods adopted here, the next section presents descriptive data and preliminary analysis on the Brazilian nonproit sector.
3. PRELIMINARY DATA
here are more than 290,000 nonproit organizations in Brazil, employing 2.1 million people (IBGE, 2010). Despite the considerable aggregate numbers, and the history of nonproits in Brazil, which started with Catholic organizations more than a century ago (Landim et al., 1999), the Brazilian nonproit sector is still incipient if compared to countries such as the United States. here are 63 municipalities in Brazil with any registered NPO, and one quarter of all Brazilian municipalities have a maximum of seven NPOs (IBGE, 2010). Also, while areas such as education, health and human ser-vices concentrate the largest number of NPOs in the United States (Boris, 2006), in Brazil these areas are less dominant. Religious organizations, professional associations, advocacy groups and cultural organizations make up more than 70% of the Brazilian nonproits. here is, however, a signiicant regional variation in this proile.
Data on NPOs’ ields of activity12 and age, depicted by their establishment in each decade, add
information to their proile. Graph 1 shows the evolution in the number of NPOs according to dif-ferent regions and decade of foundation. Graph 2 presents the number of NPOs in didif-ferent ields of activity, according to the decade in which they were established.
12 he ields of activity considered here follow the oicial register of nonproits for iscal purposes in Brazil. Several authors have pointed
GRAPH 1 NUMBER OF NPOS ACCORDING TO THEIR REGIONS AND ORGANIZATIONAL AGE
140000
120000
100000
80000
60000
40000
20000
0
North Northeast Southeast South Center-West
Until 1970 1971-1980 1981-1990 1991-2000 2001-2010
Source: Created by the author based on data described in Section 2.
GRAPH 2 NPOS IN DIFFERENT FIELDS OF ACTIVITY, ACCORDING TO THE DECADE IN WHICH THEY WERE ESTABLISHED
35000
30000
25000
20000
15000
10000
5000
0
Environment
Before 1970s 1971-1980 1981-1990 1991-2000 2001-2010
Health
Education Social W
elfare Culture Others
Advocacy
Professional Assoc
Religious
hese graphs show a continuous growth in the nonproit sector in all regions, especially since the 1980s, when the military regime fell in Brazil (Landim et al., 1999). NPOs continued growing during the 1990s and 2000s, while the government updated regulations, promoting partnerships with nonproit organizations (Appe and Marchesini da Costa, 2016).
he Southeast — which is the most industrialized, wealthiest, and most populated region — also has the largest number of NPOs in Brazil. In this region, 37% of NPOs are faith-based, which is the highest percentage for this category in the country. Graph 2 shows that religious organizations are consistently the biggest group in Brazil. his group had a sharp growth in the 1970s, during the military regime. Several studies discuss the role of religious organizations in the struggle against the military regime in that moment of restricted political association (Krischke, 1991; Azevedo, 2004). he role of religious organizations in recent years, however, is more diverse, having contributed to the propagation of conservative agendas in Brazil (Coutinho and Golgher, 2014).
he Northeast is the second most populated region in Brazil, but it only surpassed the South region in number of NPOs in the 2000s. his partially happened due to a signiicant increase in the number of advocacy organizations and professional associations – the biggest areas of activity in this region – especially in the 1980s and 1990s. While the 1980s were characterized by the re-democratization and by an inlux of resources from international foundations supporting Brazilian nonproit organi-zations, the 1990s were a moment of expansion in contracting between the government and NPOs (Appe and Marchesini da Costa, 2016). Despite some industrial and developed areas, the Northeast has several of the poorest municipalities in Brazil.
Although having only 52% of the Northeast’s population, until the 1990s the South had the second largest nonproit sector in Brazil. Cultural and religious NPOs are the largest areas of activity in this region, which is one of the most prosperous regions in Brazil, and deeply characterized by European immigration. Social welfare organizations also appear in this region relatively more than in others.
he Central-West region, characterized by strong agricultural activity, and the North, which is the largest region — and where the Brazilian Amazon forest is located — are less populated and have a smaller number of NPOs. Religious NPOs are important in both regions, but in the North, professional associations appear as equally numerous.
In order to identify general results and to enable diagnostics for spatial autocorrelation, which suggests the need for spatial models, Table 2 presents the results of OLS regressions.
Interpreting the OLS results would only make sense if the diagnostics had presented no spatial
autocorrelation. Given that the Moran’s I and the Lagrange Multiplier tests had signiicant results for
to focus on the most relevant indings for the country overall. In the following section, the results from spatial models are presented.
TABLE 2 OLS MODELS
Dependent variable:
Difference in HDI (2010-2000)
Dependent variable:
Difference in Gini (2010-2000)
Constant 0.15283** (156.084) -0.10128** (-26.611)
Government-NPOs Collaboration Rate of convênios per 100,000 inhabitant
-0.00020** (-13.087) -0.00009**(-3.307)
Nonprofit fields of activity
Advocacy NPOs per 100,000 inhabitant
0.00005** (3.335) -0.00001 (-0.578)
Culture NPOs per 100,000 inhabitant -0.00025** (-9.837) 0.0005 (1.226)
Educational NPOs per 100,000 inhabitant -0.00020** (-2.405) 0.0005 (0.436)
Environmental NPOs per 100,000 inhabitant -0.00004 (-0.405) -0.00031 (-1.550)
Housing NPOs per 100,000 inhabitant -0.00123** (-3.512) -0.00047 (-0.770)
Professional associations per 100,000 inhabitant 0.00020** (13.521) -0.00005* (-1.901)
Religious NPOs per 100,000 inhabitant -0.00040** (-12.583) 0.00005 (1.001)
Social welfare NPOs per 100,000 inhabitant -0.00022** (-7.237) -0.0002 (-0.455)
Health NPOs per 100,000 inhabitant -0.00132** (-8.768) 0.00014 (0.542)
Other NPOs per 100,000 inhabitant 0.00006** (1.972) 0.00013** (2.260)
Difference in total population -0.00000** (-5.490) 0.00000** (5.436)
Difference in rural population -0.00000 (-1.378) 0.00000** (2.191)
Difference in HDI – 0.36490** (15.621)
Difference in Gini 0.11549** (15.621) –
State capacity -0.00000**(-4.113) -0.00000 (-1.488)
N 5,562 5,562
R-squared 0.20 0.05
Akaike Information Criterion (AIC) -21,060 -14,661
Moran’s I 54.95** 4.56**
Lagrange Multiplier (lag) 2,527.70** 15.89**
Robust LM (lag) 345.47** 0.59
Lagrande Multiplier (error) 2,651.03** 17.35**
Robust LM (error) 468.80 2.05
Lagrange Multiplier (Sarma) 2,996.51** 17.95**
4. SPATIAL MODELS
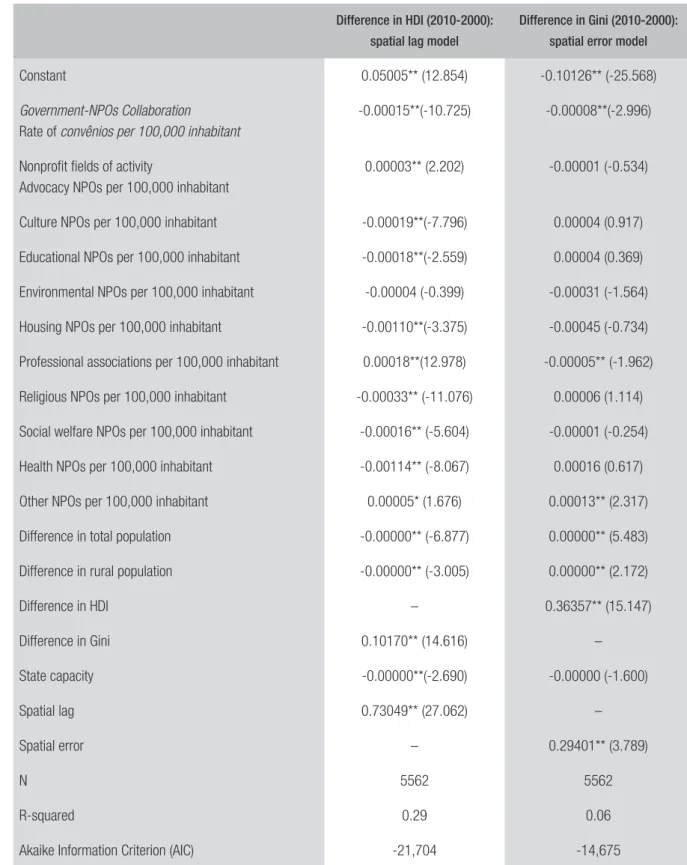
his section explores the geographical efects identiied above by explicitly modeling spatial rela-tionships. Table 3 presents the results from the spatial error and spatial lag models, following the Lagrange Multipliers obtained in the OLS (Anselin and Rey, 2014). All models show an increase in the R-squared and decrease in the AIC values in the spatial models when compared to the OLS models, indicating that, as expected, spatial models it the data better. Anselin and Rey (2014) indicate that a reduction of more than 10 in AICs already indicates a better model. A second general observation is that the Lagrange Multiplier tests are still signiicant, which shows the persistence of spatial efects not solved by these models. Despite this, the better itted models from the spatial regressions enable preliminary analyses of the results for the whole country. Finally, before presenting the results from each model, the r-squares suggest the model for human development explains more about this phe-nomenon than the model for inequality.
Municipalities with higher rates of government-NPOs collaborations are associated with a low-er inequality, but also with lowlow-er improvements in human development when compared to othlow-er municipalities. hat is, as the summary statistics show that the minimum variation of HDI is still positive, all the municipalities in Brazil improved in human development from 2000 to 2010, but the municipalities with higher government-NPOs collaboration improved less than the others. On the other hand, these municipalities with a higher rate of government-NPOs collaborations had a bigger improvement in terms of inequality — i.e., a larger decrease in this outcome.
Density of NPOs seems to have a bigger efect on human development than on inequality. How-ever, this efect is negative for most nonproit ields of activity. he only exceptions are advocacy groups, professional associations and, at 90% conidence level, NPOs classiied as “other” ields of activity. he last two kinds of NPOs also have a signiicant efect on inequality, but while the density of professional associations is associated to a lower inequality, the groups of “other” NPOs have a positive association with inequality.
he results also indicate that, for human development, spatial lag has a signiicant and positive efect, and for inequality the spatial error has a signiicant and positive efect. herefore, human development spreads from one municipality to the neighboring municipalities, and regional factors (not included in this model) explain the growth of inequality. In addition, variations in human development and in inequality afect each other and demographic characteristics are also important, but to a lesser degree. State capacity only presents a signiicant efect on human development.
TABLE 3 SPATIAL MODELS
Difference in HDI (2010-2000):
spatial lag model
Difference in Gini (2010-2000):
spatial error model
Constant 0.05005** (12.854) -0.10126** (-25.568)
Government-NPOs Collaboration
Rate of convênios per 100,000 inhabitant
-0.00015**(-10.725) -0.00008**(-2.996)
Nonprofit fields of activity
Advocacy NPOs per 100,000 inhabitant
0.00003** (2.202) -0.00001 (-0.534)
Culture NPOs per 100,000 inhabitant -0.00019**(-7.796) 0.00004 (0.917)
Educational NPOs per 100,000 inhabitant -0.00018**(-2.559) 0.00004 (0.369)
Environmental NPOs per 100,000 inhabitant -0.00004 (-0.399) -0.00031 (-1.564)
Housing NPOs per 100,000 inhabitant -0.00110**(-3.375) -0.00045 (-0.734)
Professional associations per 100,000 inhabitant 0.00018**(12.978) -0.00005** (-1.962)
Religious NPOs per 100,000 inhabitant -0.00033** (-11.076) 0.00006 (1.114)
Social welfare NPOs per 100,000 inhabitant -0.00016** (-5.604) -0.00001 (-0.254)
Health NPOs per 100,000 inhabitant -0.00114** (-8.067) 0.00016 (0.617)
Other NPOs per 100,000 inhabitant 0.00005* (1.676) 0.00013** (2.317)
Difference in total population -0.00000** (-6.877) 0.00000** (5.483)
Difference in rural population -0.00000** (-3.005) 0.00000** (2.172)
Difference in HDI – 0.36357** (15.147)
Difference in Gini 0.10170** (14.616) –
State capacity -0.00000**(-2.690) -0.00000 (-1.600)
Spatial lag 0.73049** (27.062) –
Spatial error – 0.29401** (3.789)
N 5562 5562
R-squared 0.29 0.06
Akaike Information Criterion (AIC) -21,704 -14,675
5. DISCUSSION AND CONCLUSION
Returning to the research question that guides this research — whether collaborations between governments and NPOs improve human development and reduce income inequality — the results from OLS and spatial models using data from Brazilian municipalities show evidence that govern-ment-nonproit collaborations may be helpful for improving distributive issues, but these arrangements may also be detrimental for human development indicators. he density of NPOs from diferent ields also afects human development and inequality diferently. However, most ields of nonproit activity have a negative association with the evolution of human development from 2000 to 2010, while their association with inequality is, in the majority of cases, non-signiicant. Despite the need for further analyses on the causal mechanisms of the results obtained here, these results show that core assumptions in academia (and for some practitioners) — that cross-sectoral collaborations and that the density of nonproit organizations improve societal outcomes — are not always true. his section explores the limitations, alternative explanations, and implications of these results.
A irst limitation of this research is that it considers collaboration only as formal agreements (convênios) that transferred resources from the federal government to NPOs between 2000 and 2009, and analyzes human development and inequality as relevant societal outcomes. NPOs’ leaders
perceive limitations in the mechanism of convênios and advocate for changes in this process,
allow-ing for additional and improved mechanisms of collaboration (Plataforma OSC 2010). Part of these improvements were already approved in the new regulatory framework for civil society organizations in Brazil in 2014, which is not covered in this research. A second limitation is that social outcomes cannot be exclusively attributed to a governance strategy (Fukuyama, 2013). hese indicators are used, however, as “proxy results” (Rotberg, 2014:512) which evaluate what really matters in terms of governance. he goal of this study, however, is not to claim causal relationships. he associations identiied in this research do not explain the causal mechanisms that relate NPOs to human develop-ment or inequality. Additional, qualitative, studies are needed to investigate how and what links NPOs to these social outcomes. Moreover, Brazilian NPOs from diferent areas of the country and ields of activity have managerial speciicities that were not considered in this research. his leads to the inal limitation: even with the data considered here, there are probably variations in how nonproits and
the government related to each other. Not all convênios between NPOs and the federal government
are the same, and what makes a convênio positive or negative is beyond the scope of this research.
Despite that, the results provide elements that contribute to the debate on governance.
here is a strong alternative explanation for the results obtained here, related to the endogeneity problem. hat is, the relationship explained here may be reversed: NPOs and their collaboration with the government may be occurring in municipalities with low human development and high inequality, in order to reverse these indicators and improve these communities. Previous studies, however, show that community needs and available resources exert less inluence in NPOs location than a high rate of NPOs previously working in a municipality (Marchesini da Costa, 2016). Despite this, in qualitative follow-ups to this research, the possibility of collaborations occurring in municipalities which are most in need, should be veriied.
in-equality at municipal level. he signiicant Moran’s I, Lagrange Multipliers and better AICs obtained in the spatial models for human development and inequality indicate spatial autocorrelation among them. hese indings suggest that NPOs interested in human development and the reduction of in-come inequality should develop activities with a more regional focus, given that human development spreads across diferent units and inequality is inluenced by regional factors. Partnerships between NPOs and the federal government should also explore this regional aspect. In addition, future re-search should analyze if these results are afected by other governance arrangements not included in this paper, such as contracts between NPOs and state governments, or inter-municipal consortiums.
he irst hypothesis stated that collaboration involving inancial transfers from the government to NPOs would lead to improved human development and would not be related to income inequality at municipal level. Models tested here indicate a very diferent result: government-NPOs collaborations are negatively associated both to human development and inequality. here is evidence, then, to reject this hypothesis. hese indings contradict the general argument that NPOs are potential service pro-viders that should be included in governance arrangements (Salamon and Toepler, 2015), but they also refute the claims that collaborations remove NPOs from having structural impact on society (Banks, Hulme, and Edwards, 2015). Future studies should explore the causal mechanisms that explain these results. he situation in the period analyzed, from 2000 to 2010, suggests that collaborations present worse results for human development than other governance arrangements, but government-NPO partnerships activate distributive channels for income in municipalities.
Finally, the hypothesis about the nonproit ields of activity stated that NPOs closely related to service provision improve human development, while NPOs from ields related to community building, identity and structural causes reduce inequality in each municipality. Most of the results contradict this hypothesis, as no typical service provider ield of activity is positively associated with the improvement of human development. his positive association only happens with two expres-sive ields of activity — advocacy groups and professional associations. Besides, the density of NPOs from most ields of activity is not related to inequality. he exception that seems to reduce inequality comes from expressive ields (professional associations), as expected. Additional studies could further analyze what diferentiates the action of professional associations, ensuring that the density of these organizations have a positive efect.
REFERENCES
ABOUASSI, Khaldoun. Hands in the pockets of mercurial donors NGO response to shiting funding priorities. Nonproit and Voluntary Sector Quarterly, v. 42, n. 3, p. 584-602, 2013.
ALMOG-BAR, Michal; SCHMID, Hillel. Advocacy activities of nonproit human service organizations: a critical review. Nonproit and Voluntary Sector Quarterly, v. 43, n. 1, p. 11-35, 2013.
ANAND, Sudhir; SEN, Amartya. Human develop-ment index: methodology and measurement. Hu-man Development Report Oice (HDRO), United Nations Development Programme (UNDP), 1994.
ANHEIER, Helmut K. Nonproit organizations: the-ory, management, policy. New York: Routledge, 2014.
ANSELIN, Luc. Spatial regression analysis in R–A workbook. Urbana. 2005. Available at: <www.csiss. org/gispopsci/workshops/2011/PSU/readings/ W15_Anselin2007.pdf>. Accessed on: 30 Jan. 2017.
ANSELIN, Luc; REY, Sergio J. Modern spatial econo-metrics in practice: a guide to GeoDa, GeoDaSpace and PySAL. Chicago: GeoDa Press LLC, 2014.
ANSELIN, Luc; SYABRI, Ibnu; KHO, Youngihn. GeoDa: an introduction to spatial data analysis. Geographical Analysis, v. 38, n. 1, p. 5-22, 2006.
APPE, Susan; COSTA, Marcelo Marchesini da. Waves of nonproit regulation and self-regulation in Latin America: evidence and trends from Brazil and Ecuador. In: BREEN, Oonagh; DUNN, Alison; SIDEL, Mark (Ed.). Regulatory waves comparative perspectives on state regulation and self-regulation policies in the nonprofit sector. Cambridge, UK: Cambridge University Press, 2016. p. 154-175.
ATACK, Iain. Four criteria of development NGO legitimacy. World Development, v. 27, n. 5, p. 855-864, 1999.
AZEVEDO, Dermi. A Igreja Católica e seu papel político no Brasil. Estudos Avançados, São Paulo, v. 18, n. 52, p. 109-120, 2004.
BALLER, Robert D. et al. Structural covariates of Us county homicide rates: incorporating spatial efects. Criminology, v. 39, n. 3, p. 561-588, 2001.
BANKS, Nicola; HULME, David; EDWARDS, Michael. NGOs, states, and donors revisited: still
too close for comfort? World Development, v. 66, p. 707-718, 2015.
BORIS, Elizabeth T. Nonproit organizations in a de-mocracy: varied roles and responsibilities. Nonproits & government: collaboration and conlict. 2. ed. Washington, DC: Urban Institute, 2006. p. 1-36.
BRUNSDON, Chris; FOTHERINGHAM, A. S.; CHARLTON, Martin E. Geographically weighted summary statistics — a framework for localised exploratory data analysis. Computers, Environment and Urban Systems, v. 26, n. 6, p. 501-524, 2002.
BRUNSDON, Chris; FOTHERINGHAM, A. S.; CHARLTON, Martin E. Geographically weighted regression: a method for exploring spatial nonsta-tionarity. Geographical Analysis, v. 28, n. 4, p. 281-298, 1996.
CHARLTON, Martin; FOTHERINGHAM, Stewart; BRUNSDON, Chris. Geographically weighted re-gression. White Paper. National Centre for Geocom-putation. National University of Ireland Maynooth, 2009.
CORNFORTH, Chris; HAYES, John Paul; VANGEN, Siv. Nonproit-public collaborations understanding governance dynamics. Nonproit and Voluntary Sec-tor Quarterly, v. 44, n. 4, p. 775-795, 2014.
COUTINHO, Raquel Z.; GOLGHER, André B. he changing landscape of religious ailiation in Brazil between 1980 and 2010: age, period, and cohort pers-pectives. Revista Brasileira de Estudos de População, v. 31, n. 1, p. 73-98, 2014.
DALE, Mark R. T.; FORTIN, Marie-Josée. Spatial analysis: a guide for ecologists. Cambridge, UK: Cambridge University Press, 2014.
FRUMKIN, Peter. On being nonproit: a conceptual and policy primer. Cambridge, MA: Harvard Uni-versity Press, 2002.
FUKUYAMA, Francis. What is governance? Gover-nance, v. 26, n. 3, p. 347-368, 2013.
GRIMM, Michael et al. A human development index by income groups. World Development, v. 36, n. 12, p. 2527-2546, 2008.
IBGE. As fundações privadas e associações sem ins lucrativos no Brasil — 2010. 2010. Available at: <tp://tp.ibge.gov.br/Fundacoes_Privadas_e_Asso-ciacoes/2010/fasil.pdf>. Accessed on: 11 Jan. 2017.
KEARNS, Kevin; PARK, Chisung; YANKOSKI, Lin-da. Comparing faith-based and secular community service corporations in Pittsburgh and Allegheny County, Pennsylvania. Nonprofit and Voluntary Sector Quarterly, v. 34, n. 2, p. 206-231, 2005.
KOCH, Dirk-Jan et al. Keeping a low proile: what determines the allocation of aid by non-governmen-tal organizations? World Development, v. 37, n. 5, p. 902-918, 2009.
KRISCHKE, Paulo J. Church base communities and democratic change in Brazilian society. Comparative Political Studies, v. 24, n. 2, p. 186-210, 1991.
LANDIM, Leilah et al. Brazil. In: SALAMON, Lester et al. Global civil society: dimensions of the nonproit sector. Baltimore: he Johns Hopkins Comparative Nonproit Sector Project, 1999.
LEVI-FAUR, David. From “big government” to “big governance”? In: LEVI-FAUR, David (Ed.). he Ox-ford handbook of governance. Oxford, UK: Oxford University Press, 2012. p. 3-18.
LUSTIG, Nora; LOPEZ-CALVA, Luis F.; ORTIZ-JU-AREZ, Eduardo. Declining inequality in Latin Ame-rica in the 2000s: the cases of Argentina, Brazil, and Mexico. World Development, v. 44, p. 129-141, 2013.
MARCHESINI DA COSTA, Marcelo. What inluen-ces the location of nonproit organizations? A spatial analysis in Brazil. Voluntas: International Journal of Voluntary and Nonproit Organizations, v. 27, n. 3, p. 1064-1090, 2016.
MILWARD, H. Brinton; PROVAN, Keith G. Gover-ning the hollow state. Journal of Public Administra-tion Research and heory, v. 10, n. 2, p. 359-380, 2000.
MOSLEY, Jennifer E. Keeping the lights on: how government funding concerns drive the advocacy agendas of nonproit homeless service providers. Journal of Public Administration Research and he-ory, v. 22, n. 4, p. 841-866, 2012.
NEAL, Rachael. he importance of the state: poli-tical dimensions of a nonproit network in Oaxaca, Mexico. Nonproit and Voluntary Sector Quarterly, v. 37, n. 3, p. 492-511, 2007.
NICHOLSON-CROTTY, Jill. Politics, policy, and the motivations for advocacy in nonproit reproductive health and family planning providers. Nonproit and Voluntary Sector Quarterly, v. 36, n. 1, p. 5-21, 2007.
PERMANYER, Iñaki. Using census data to explore the spatial distribution of human development. World Development, v. 46, p. 1-13, 2013.
PLATAFORMA OSC. Plataforma por um novo
marco regulatório para as organizações da sociedade civil. 2010. Available: <http://plataformaosc.org.br/ wp-content/uploads/2011/10/Plataforma-principal. pdf>. Accessed on: 11 Jan. 2017.
RANIS, Gustav; STEWART, Frances; RAMIREZ, Alejandro. Economic growth and human develo-pment. World Development, v. 28, n. 2, p. 197-219, 2000.
R CORE TEAM. R: a language and environment for statistical computing, issued 2015. 2015. Available at: <www.R-project.org/>. Accessed on: 11 Jan. 2017.
RHODES, Roderick Arthur. Waves of governance. In: LEVI-FAUR, David (Ed.). Oxford handbook of governance. Oxford, UK: Oxford University Press, 2012.
RISSE, homas. Governance without a state?: policies and politics in areas of limited statehood. New York, NY: Columbia University Press, 2013.
ROTBERG, Robert I. Good governance means performance and results. Governance, v. 27, n. 3, p. 511-518, 2014.
SAIDEL, Judith R. Resource interdependence: the relationship between state agencies and nonproit organizations. Public Administration Review, v. 51, n. 6, p. 543-553, 1991.
SALAMON, Lester M. he new governance and the tools of public action: an introduction. In: SA-LAMON, Lester M. (Ed.). he tools of government: a guide to the new governance. Oxford, UK: Oxford University Press, 2002.
SALAMON, Lester M.; ANHEIER, Helmut K. Civil society in comparative perspective. In: SALAMON, Lester M. et al. Global civil society: dimensions of the nonproit sector. Baltimore: Johns Hopkins Center for Civil Society Studies, 1999. p. 3-39.
im-plementation of the UN nonproit handbook. Center for Civil Society Studies Working Paper, n. 49, 2013.
SALAMON, Lester M.; TOEPLER, Stefan. Govern-ment-nonproit cooperation: anomaly or necessity? Voluntas: International Journal of Voluntary and Nonproit Organizations, v. 26, n. 6, p. 2155-2177, 2015.
SCHMID, Hillel; BAR, Michal; NIREL, Ronit. Advocacy activities in nonprofit human service organizations implications for policy. Nonproit and Voluntary Sector Quarterly, v. 37, n. 4, p. 581-602, 2008.
SCOTT, W. Richard et al. Advocacy organizations and the ield of youth services: ongoing eforts to restructure a ield. Nonproit and Voluntary Sector Quarterly, v. 35, n. 4, p. 691-714, 2006.
SOKOLOWSKI, S. Wojciech. Efects of government support of nonproit institutions on aggregate private
philanthropy: evidence from 40 countries. Voluntas: International Journal of Voluntary and Nonproit Organizations, v. 24, n. 2, p. 359-381, 2013.
SUDA, Yuko. Devolution and privatization proceed and centralized system maintained: a twisted reality faced by Japanese nonproit organizations. Nonproit and Voluntary Sector Quarterly, v. 35, n. 3, p. 430-452, 2006.
UNDP. Human Development Index (HDI). 2015. Available at: <http://hdr.undp.org/en/content/ human-development-index-hdi>. Acessed on: 11 Jan. 2017.
VERSCHUERE, Bram; DE CORTE, Joris. Nonproit advocacy under a third-party government regime: cooperation or conflict? Voluntas: International Journal of Voluntary and Nonproit Organizations, v. 26, n. 1, p. 222-241, 2012.
Marcelo Marchesini da Costa