ISSN Online: 2156-8278 ISSN Print: 2156-8251
High Resolution Mass Spectrometry Elucidation
of Captopril’s Ozonation and Chlorination
By-Products
Frederico Jehár Oliveira Quintão
1, Geraldo Célio Brandão
2, Silvana de Queiroz Silva
1,
Sérgio Francisco Aquino
1, Robson José de Cássia Franco Afonso
1*1Programa de Pós-Graduação em Engenharia Ambiental (ProAmb), Universidade Federal de Ouro Preto, Ouro Preto, Brazil
2Programa de Pós-Graduação em Ciências Farmacêuticas (CiPharma), Universidade Federal de Ouro Preto, Ouro Preto, Brazil
Abstract
The article evaluated the degradation of the captopril in aqueous solution after ozonation and chlorination. The process was continuously monitored focus-ing on the identification, mass spectrometry and elucidation of its by-pro- ducts by applying direct infusion and high performance liquid chromatogra-phy, electrospray ionization high resolution mass spectrometry, in the nega-tive ion mode. The cytotoxicity of its by-products solutions were evaluated with 3-(4, 5-dimethylthiazol-2-yl)-2, 5-diphenyltetrazolium bromide (MTT) assay. It was observed through that after 30 min of ozonation and chlorina-tion, there was complete oxidation of captopril, i.e., 100% removal efficiency. At these conditions, the rate of mineralization, by total organic carbon, was only 7.63% for ozonation and 6.40% for chlorination, evidencing the forma-tion of degradaforma-tion by-products. Ten captopril by-products were identified and their respective chemical structures elucidations are proposed. The treated samples and their by-products were nontoxic to HepG2 cells by MTT assay.
Keywords
Chlorination, Ozonation, Captopril, High-Resolution Mass Spectrometry, Liquid Chromatography, Characterization of By-Products, MTT Assay
1. Introduction
The pharmaceutically active compounds are an essential part of modern human and veterinary medicine. The uncontrolled use of these compounds through anthropogenic sources causes their accelerated introduction into the
environ-How to cite this paper: Quintão, F.J.O., Brandão, G.C., de Queiroz Silva, S., Aqui-no, S.F. and de Cássia Franco Afonso, R.J. (2017) High Resolution Mass Spectrometry Elucidation of Captopril’s Ozonation and Chlorination By-Products. American Jour-nal of AJour-nalytical Chemistry, 8, 264-279. https://doi.org/10.4236/ajac.2017.84020
Received: February 22, 2017 Accepted: April 27, 2017 Published: April 30, 2017
Copyright © 2017 by authors and Scientific Research Publishing Inc. This work is licensed under the Creative Commons Attribution International License (CC BY 4.0).
ment and can be a potential risk for aquatic and terrestrial organisms [1]. The molecules are absorbed, distributed, metabolized, and excreted at their un-changed form and as metabolites [2]. Often they are excreted slightly trans-formed only or even unchanged, mostly conjugated to polar molecules [3] [4]. However, several studies have revealed that they are not quantitatively removed in conventional wastewater treatment processes. Due to their persistence in these secondary effluents, as well as in surface waters, and since these aquatic streams could be latter used as drinking water sources, they constitute a poten-tial risk to human health [5].
Chlorine is the most commonly used oxidizer in water treatment plants around the world. Its wide use is justified by its disinfectant action besides being a strong oxidant. In addition to these factors, the chlorination process has low cost and frees residual chlorine in distribution networks, ensuring water quality until its consumption [6]. Chlorination can occur at one or two points in the water treatment plant, early in the process, conducting a pre-oxidation of or-ganic matter and/or in the end as a disinfectant [7]. Chlorine is able to react quickly with pharmaceutically active compounds, which are toxic compounds and exhibit carcinogenic activity on animals and humans [6].
Ozone (O3) is a very powerful oxidizing agent which is commonly used in
water treatment, particularly in continental Europe. Due to its high oxidation potential, ozone is widely used in drinking water treatment for disinfection, col-or removal, taste and odcol-or control, decrease of disinfection by-products fcol-orma- forma-tion, biodegradability increase, and also for effective degradation of many or-ganic contaminants [8] [9] [10]. The oxidation of organic compounds during ozonation can occur via ozone or hydroxyl radicals or a combination of both. Ozone is an electrophile with high selectivity to oxidize organic micropollutants. Ozone reacts mainly with double bonds, activated aromatic systems, and non- protonated amines [11]. Product formation from the ozonation of organic mi-cropollutants has only been established for a few compounds [12].
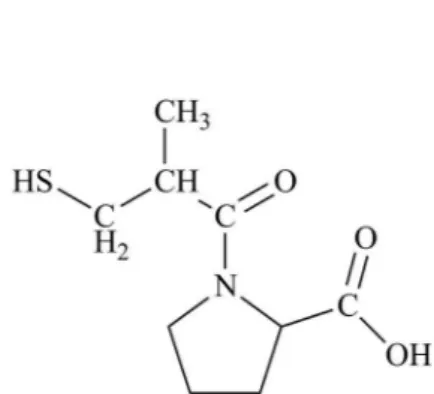
Captopril (CP; 1-[(2S)-3-Mercapto-2-methylpropionyl]-l-proline), as shown in Figure 1, is an angiotensin converting enzyme inhibitor (iACE). It is used in the management of hypertension, in heart failure, after myocardial infarction, and in diabetic nephropathy [13]. It is largely excreted in the urine, 40% - 50% as unchanged drug, the rest as disulfide and other metabolites [14] [15].
Pharmaceuticals have been developed to produce a biological effect, so their residues, metabolites, and degradation products released in the environment can cause different ecotoxicological effects that are difficult to predict, especially in complex matrices [16]. The MTT assay is a sensitive, quantitative, and reliable colorimetric assay that measures viability of cells. Here the MTT assay was used, with HepG2 cells, to determine the cytotoxicity of the chlorination and ozona-tion by-products soluozona-tions.
and ozonation process and evaluate their toxicity against HepG2 cells. In this experiments, the structure elucidation of the transformation products was per-formed using High Performance Liquid Chromatography coupled to High Res-olution Mass Spectrometry (HPLC/HRMS) system via an electrospray ionization interface (ESI). The by-products solutions were submitted to MTT assay, with HepG2 cells, to determine their cytotoxicity.
2. Experiments
2.1. Chemicals
Captopril (C9H15NO3S, nominal mass 217.2867), chemical structure of which is
shown in Figure 1, was purchased from Sigma-Aldrich (St. Louis, MO, USA). Solvents for analytical determinations were acetonitrile (HPLC grade, JT Baker) and ultrapure water. Ultrapure water, from a Millipore Milli-Q system (Milford, MA, USA), was employed to prepare all the solutions.
Standard solution of sodium hypochlorite at 10% w/v was provided by SEM- AE (Municipal Water and Sewage Service) in Ouro Preto, Minas Gerais, Brazil. Ozone gas was generated using an ozone generator of electrical discharge with production capacity of 3 g O3/h (Ozone Generator, model O & L3.0RM, Ozone
& Life Industry, São José dos Campos-SP, Brazil) from oxygen feed gas (oxygen purity 99.99%).
2.2. Ozonation Experiments
Aqueous solutions of ozone were prepared by continuously bubbling ozone gas into Milli-Q ultrapure water through bottled gas scrubber for no less than 10 minutes at room temperature (20˚C - 23˚C). The quantification of ozone oc-curred by direct spectrophotometric measurement at 260 nm (CO3 (mg·L−1) =
14.59 × Absorbance [17]. The ozonation experiments were performed in bench scale with amber bottles of 20 mL capacity. Initially a volume of the CP solutions were added into the flask to a final concentration of 10 mg·L−1 [18]. After
prepa-ration of the ozone solution, it was added to the bottles a volume of solution which contained the final concentration of ozone (8 mg·L−1). Each bottle used
had a contact time of 0, 5, 10, 15 and 30 minutes.
2.3. Chlorination Experiments
The chlorination experiments were performed in bench scale with amber bottles of 20 mL capacity. The stock CP solution (100 mg·L−1) was prepared separately
using ultrapure water (Milli-Q) and 2 mL of this solution were added into the amber bottles (final concentrations of 10 mg·L−1 of CP). The solutions were
stirred for 10 minutes before the degradation tests. All tests were performed at room temperature, which varied between 22˚C and 23˚C. In the chemical oxida-tion reacoxida-tion system it was collected the first sample (time 0) and subsequently an amount of sodium hypochlorite was added to achieve a final concentration of 10 mg·L−1. After specific contact time, sodium thiosulfate (Na
2S2O3) 10 mg·L−1
were added to quench the residual hypochlorite and stop the reactions. The chlorination was accomplished over a period of 30 minutes. Samples were col-lected in amber glass bottles at the times of 0, 5, 10, 15 and 30 minutes.
The aliquots collected from the chlorination and ozonation tests were also maintained under identical conditions until the Total Organic Carbon (TOC) and mass spectrometry analyses. Although the CP concentration of 10 mg·L−1
used in this study was much higher than those typically found in the environ-ment, it was chosen to facilitate the subsequent mass spectrometry analysis, eli-minating the steps of extraction and pre-concentration of the samples, thereby minimizing errors related to sample preparation.
2.4. TOC Analyses
The analysis of total organic carbon (TOC) was based on the determination of CO2 produced through the oxidation of organic matter in the samples, and was
carried out on a TOC analyzer (Shimadzu, model TOC-L, Kyoto, Japan). The TOC content of each collected aliquot was obtained by the indirect method which corresponds to the difference between the total carbon and inorganic carbon values. The TOC-L equipment employs a combustion (680˚C) catalytic oxidation method with Non Dispersive Infra Red (NDIR) detection which allows the TOC analysis in a wide range (4 µg/L to 30,000 µg/L) with a low limit of de-tection (4 µg/L) [19].
2.5. Direct Infusion High Resolution Mass Spectrometry
The direct infusion analyses were carried out in a high resolution mass spectro-meter (IT-TOF; Shimadzu Corporation, Kyoto, Japan), a hybrid ion trap and time of flight, equipped with an electrospray (ESI) ionization source operating in negative mode (−3.5 kV). The samples were directly introduced into the ESI source via the HPLC autosampler (SIL 30AC; Shimadzu Corporation, Kyoto, Japan). The mass spectrometer parameters are presented in Table 1 [19] [20].
2.6. Liquid Chromatography Coupled to Mass Spectrometry
liquid phase chromatograph was equipped with a binary pump (Nexera LC-30AD; Shimadzu Corporation, Kyoto, Japan) and an autosampler (SIL 30AC; Shimadzu Corporation, Kyoto, Japan). The mass spectrometer parameters were the same as described above. The samples were introduced into the ESI source by injecting 8 µL of sample via the HPLC autosampler. For separation, it used a Nucleosil® 100-5 CN column (250 mm × 4.6 mm × 5 µm particle diameter); and as mobile phases, it used water (A) and acetonitrile (B), both contained 0.1% formic acid, at a flow rate of 1 mL·min−1. The mobile phase was split so that the
flow became 0.2 mL·min−1 prior entering the electrospray capillary at the mass
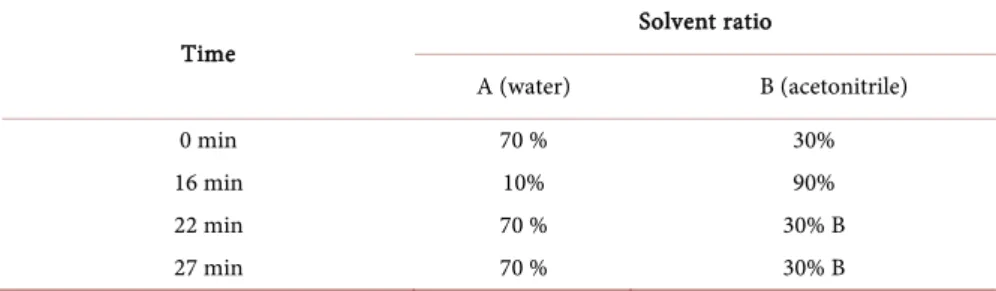
spectrometer. The gradient elution program used in separation of CP by-prod- ucts are presented in Table 2 [20] [21] [22].
2.7. Cytotoxicity Assay (MTT)
The assay is based on the capacity of mitochondrial dehydrogenase enzymes in living cells to convert the yellow water-soluble substrate 3-(4, 5-dimethylthiazol- 2-y1)-2, 5-diphenyl tetrazolium bromide (MTT) into a dark blue formazan product that is insoluble in water [23] [24]. Viable cells are able to reduce the yellow MTT under tetrazolium ring cleavage to a water-insoluble purple-blue formation which precipitates in the cellular cytosol and can be dissolved after cell lysis, whereas cells being dead following a toxic damage, cannot transform MTT. The amount of these crystals can be determined spectrophotometrically and hence the number of living cells in the sample. These features can be taken as advantage of cytotoxicity or cell proliferation assays, which are widely used in toxicology [23] [25] [26].
Table 1. Mass spectrometer parameters.
Parameters Conditions
Temperature of interface 200˚C
Temperature of curved dessolvation line (CDL) 200˚C
Nebulizer gas (N2) flow rate 1.5 L·min−1
Drying gas pressure 100 kPa
mass-to-charge (m/z) range 100 - 600
Sample volume injecting 15 µL
Flow rate 0.2 mL·min−1
Mobile phase acetonitrile with 0.1 % of formic acid
Table 2. Gradient elution program used in separation of CP by-products.
Time
Solvent ratio
A (water) B (acetonitrile)
0 min 70 % 30%
16 min 10% 90%
22 min 70 % 30% B
The cytotoxicity of CP and its transformation products were determined with 3-(4,5-dimethylthiazol-2-yl)-2, 5-diphenyltetrazolium bromide (MTT) assay ac-cording to Mosmann (1983) and Zegura et al. (2009) [23] [25]. HepG2 cell mo-nolayers were trypsinized, washed with culture medium, plated in 96-well flat-bottomed plates (4 × 10⁴ cells per well) and incubated in a humidified
atmos-phere with 5% CO2 at 37˚C. After a 24h incubation, serial dilutions of the CP
samples (0.01, 0.25, 0.50, 0.75 and 1.00 mg·L−1) made in phosphate buffered
sa-line (PBS) were added to appropriate wells, and the plates were incubated for an additional 20 h. After this time, the supernatants were removed from the wells, and MTT (28 μl of a 5 mg/mL solution in PBS) was added to each well; the plates were incubated for 90 min at 37˚C; then, DMSO (130 μL) was added to each well to dissolve the formazan crystals. After shaking the plates to ensure complete dissolution of formazan, the optical density was determined at 490 nm in a mul-tiwell spectrophotometer (Spectra max340PC-Molecular Devices) [21] [22]. The cell survival (viability) was determined by comparing the absorbance of the wells containing the cells treated with MTF solutions (treated and untreated) to the cells exposed to a negative control (culture media with cells). Positive control was done by pure DMSO. An initial solution of sodium hypochlorite 1 mg L-1
was neutralized by sodium thiosulfate and used as blank. A 30% reduction in the viability of a given sample was considered as a positive cytotoxic response. These experiments were also performed in triplicate.
3. Results and Discussion
3.1. CP Degradation and Mineralization
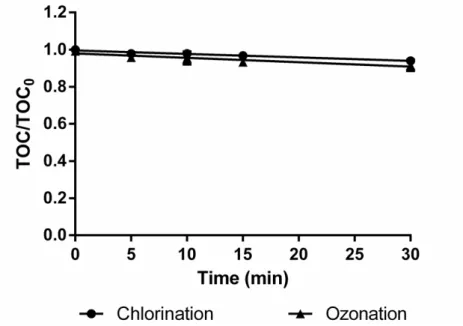
Changes in CP (negative ion m/z 216.0700) areas during ozonation and chlori-nation were monitored by high performance liquid chromatography coupled to the hybrid mass spectrometry system. The ozonation and chlorination promoted high degree of CP degradation, with 100% removal efficiencies after 5 min of exposure. Total organic carbon content (TOC/TOC0) as a function of their
reac-tion time are presented in Figure 2.
Ozone is unstable in water, however, the unique feature of ozone is its
de-composition into hydroxyl radicals (•OH), which are the strongest oxidants in
water. In water, •OH reacts fast with CP and the by-products formed from the
reaction of •OH also reacts fast with CP. Ozonation may lead to a complete
re-moval of organic compounds, but it does not lead to the complete mineraliza-tion of organics, which results in the formamineraliza-tion of carboxylic acids, carbonyl compounds, and many others by-products [8] [10] [12].
One hypothesis for CP removal by chlorination can also be attributed to the fact that reduced sulfur moieties can easily be oxidized in presence of chlorine. In the case of thiol-containing compounds, as captopril, thiols oxidation leads, mainly, to disulfide and sulfonic acid [6] [27].
mineralization rate was only 7.63% and it was achieved upon the application of the ozonation. Moreover, the mineralization rates achieved through chlorination were lower (6.4%). These findings indicate that whereas most of the original CP was not mineralized, recalcitrant by-products were generated under these oxida-tive conditions.
3.2. Identification of CP By-Products: Proposal of a Degradation
Route
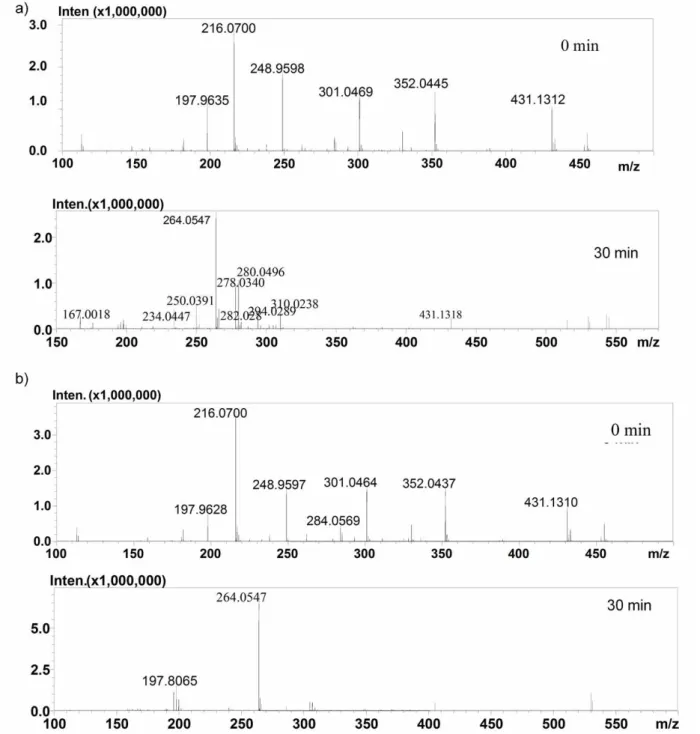
The aliquots collected during the ozonation and chlorination experiments were analyzed by [ESI(-)-HRMS] and HPLC/HRMS. Examples of the mass spectra and extracted-ion chromatogram (EIC) containing peaks from the CP and its by-products are shown on Figure 3 and Figure 4, respectively. The mass spectra recorder in times of 0 and 30 min are depicted in Figure 3.
Figure 3 clearly shows that whereas the CP (m/z 216.0700) is fully consumed after 30 min of ozonation and chlorination experiments, the total carbon content in solution remained practically unchanged (Figure 2). The identification of the main by-products was carried out using the software formula predictor from Shimadzu, in order to propose a plausible degradation route. These ESI(-)- HRMS and HPLC/HRMS results allowed the detection of thirteen by-products, which elemental compositions were assigned based on the accurate mass mea-surements (<5 ppm) provided by the TOF analyzer, Figure 3(a) and Figure 3(b) [28].
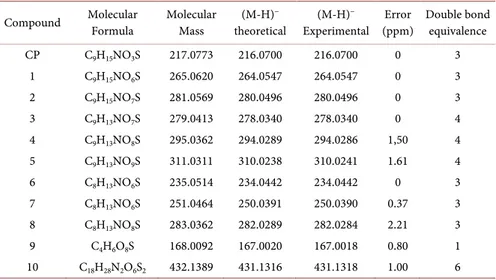
After a meticulous analysis of these data, it was possible to propose the mole-cular formula for the thirteen degradation by-products of CP detected in their deprotonated form, as shown in Table 3. A maximum error of 3.00 ppm be-tween the experimental and theoretical accurate masses of CP and its proposed by-products was observed.
Figure 2. Total organic carbon content (TOC/TOC0) as a function of ozonation time.
Figure 3. High resolution mass spectra (HRMS) recorded for aliquots (0 and 30 min) of the (a) ozonation and (b) chlorination.
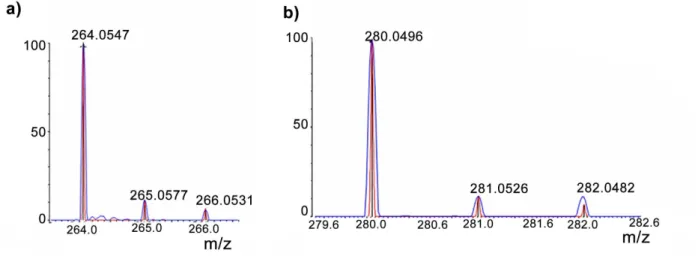
Based on these results as well as on the well-known reactivity of hydroxyl rad-ical towards organic molecules in aqueous medium and isotopic ratio (Figure 5), a route for CP ozonation (Figure 6) and CP chlorination (Figure 7) could be proposed.
The by-product 1 (C9H15NO6S, m/z 264.0547) can be formed from the
oxida-tion of CP thiol group, and such oxidaoxida-tion probably happened because of sul-fur’s ability of expanding its octet. The degradation progress follows different routes. The by-product 2 (C9H15NO7S, m/z 280.0496) was probably formed after
Figure 4. Extracted-ion chromatogram (EIC) using a mass window of ± 3.00 mDa from the CP (0 min) and by-products (30 min). To facilitate visualization, only 3 of the 10 intermediates are plotted. (a) Captopril; (b) ozonation by-products ; (c) c hlorination by-products.
Table 3. Molecular formulae (calculated from HRMS data) of CP and its main by-pro-
ducts
Compound Molecular Formula
Molecular Mass
(M-H)− theoretical
(M-H)− Experimental
Error (ppm)
Double bond equivalence
CP C9H15NO3S 217.0773 216.0700 216.0700 0 3
1 C9H15NO6S 265.0620 264.0547 264.0547 0 3
2 C9H15NO7S 281.0569 280.0496 280.0496 0 3
3 C9H13NO7S 279.0413 278.0340 278.0340 0 4
4 C9H13NO8S 295.0362 294.0289 294.0286 1,50 4
5 C9H13NO9S 311.0311 310.0238 310.0241 1.61 4
6 C8H13NO6S 235.0514 234.0442 234.0442 0 3
7 C8H13NO6S 251.0464 250.0391 250.0390 0.37 3
8 C8H13NO8S 283.0362 282.0289 282.0284 2.21 3
9 C4H6O8S 168.0092 167.0020 167.0018 0.80 1
Figure 5. Theoretical (red) and experimental (blue) isotope ratio for the by-product 1 and 2.
Figure 6. Possible transformation pathways followed by captopril after ozonation.
forming a ketone group in by-product 3 (C9H13NO7S, m/z 278.0340) [19]. The
by-products 4 (C9H13NO8S, m/z 294.0289) and 5 (C9H13NO9S, m/z 310.0238),
Figure 7. Possible transformation pathways followed by captopril after chlorination.
of by-products 3 and 4, respectively. In sequence, the by-product 6 (C8H13NO5S,
m/z 234.0442) was probably formed after a decarboxylation of the intermediate 1 followed by its successive oxidation (forming a hydroxyl and then a ketone group) given that the medium is very oxidative. The by-product 7 (C8H13NO6S,
m/z 250.0391) has another hydroxyl group in the ring when compared to by- product 6. The by-product 8 (C8H13NO8S, m/z 282.0289), and it has two
hydrox-yl groups in the ring when compared to by-product 7. The acyclic intermediate 9 (C4H8O5S, m/z 167.0020) could be generated from intermediates (1-8). The
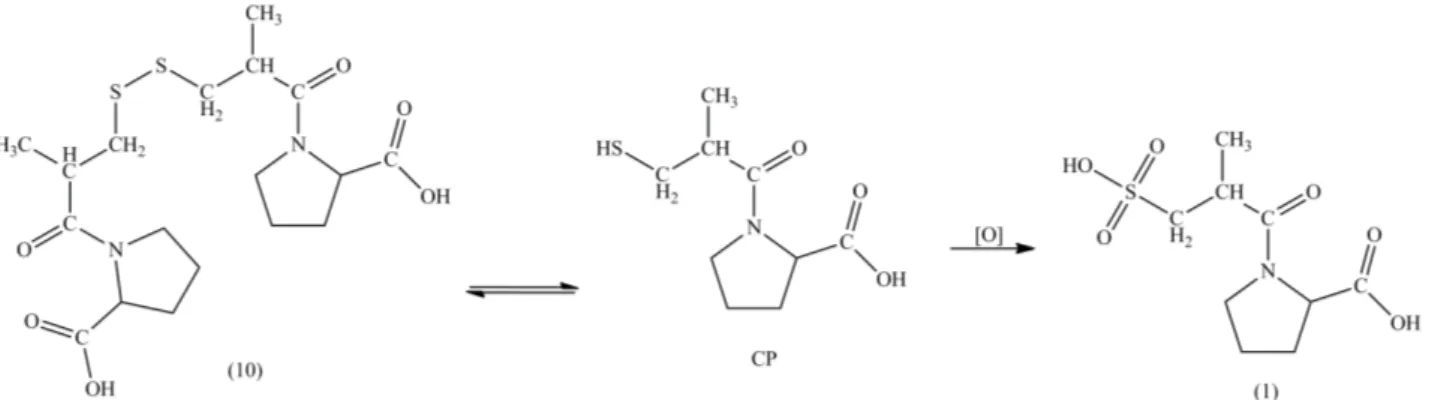
by-product 10 (C18H28N2O6S2,m/z 431.1316) can also be oxidized to form the CP
(C9H15NO3S, m/z 216.0700).
In the case of captopril thiol group, the oxidation mainly leads to sulfonic acid (by-product 1) and disulfide (by-product 10; detection was not possible) [6] [27]. It is noteworthy that the intermediate 1 has been previously reported by Mahmoud and Kummerer (2012), who studied the photodegradation and the aerobic biodegradation of CP and its dimer (captopril disulfide) in aqueous so-lution. The intermediate 1, 3, 6 and 7 has been previously reported by Freitas and co-authors (2017) who studied the photodegradation of CP in aqueous solu-tion after oxidasolu-tion induced by photolysis and photocatalysis [21].
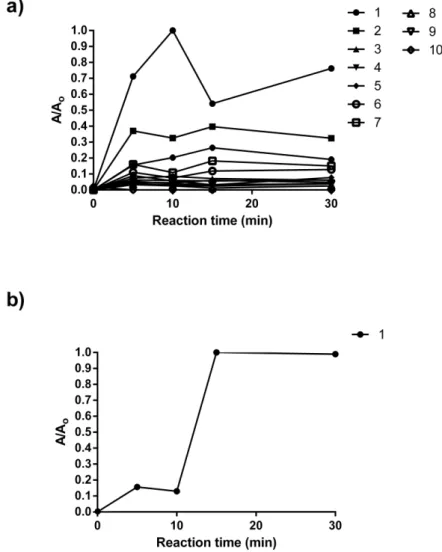
The evolution, formation, and degradation of each intermediate (1 - 10) dur-ing the ozonation and chlorination processes, were monitored by HPLC/HRMS. The results from EIC were analyzed to build plots of the temporal accumulation of intermediates for all processes evaluated (Figure 8). Hence, for the ozonation system practically all intermediates remained in solution after 30 min of expo-sure (Figure 8(a)). For the chlorination system (Figure 8(b)) only the interme-diates 1 remained in solution after 30 min of reaction. In both systems it was observed an increase in the relative concentrations of by-products. Therefore the data presented in Figure 8 corroborates the results of TOC analysis and are in agreement with the proposed degradation route.
3.3. Cytotoxicity Assay (MTT)
the cells exposed to a negative control (culture media with cells). The results were expressed in percentage of cell viability. It has to be noted that in order to avoid overestimation or underestimation of the toxicity of a substance, incuba-tions with various concentraincuba-tions were required to be able to accurately deter-mine the cytotoxicity. Since none of the diluted samples tested decreased cell viability, Figure 9 shows cell viability data for undiluted (at the highest tested concentration, i.e., 1 mg·L−1) CP samples before and after degradation
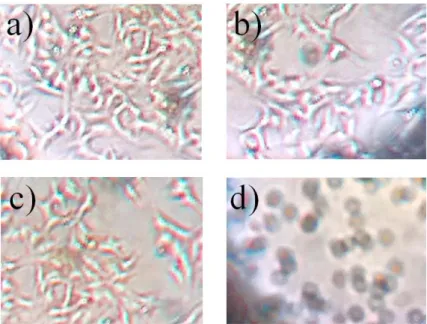
experi-ments. In addition, the cells were exposed to DMSO, considered as positive con-trols. Figure 10 shows cell morphologies before and after the treatment of by-products. It can be seen that the morphology of the cells treated with the by-products solutions were not different when compared to the cells treated with CP. Cells treated with the positive control showed the spherical morphology thus showing that they are dead.
Figure 8. Plots of the relative areas of the degradation products of CP (1 - 10) versus
Figure 9. Graph of MTT assay of CP untreated and after 30 min of degrada-tion tests showing the % cell viability HepG2 cells after exposure to concentra-tions [1.0 mg·L−1] of the samples. Values are expressed as mean and SD.
Figure 10. Cell morphologies before and after the treatment: (a) before trea-
tment; (b) after exposure ozonation by-products; (c) after exposure chlorina-tion by-products and (d) after exposure positive control.
Un-fortunately no reference on toxicity effects of CP or its by-products were found in the literature for comparison.
4. Conclusion
The chlorination and ozonation were efficient in promoting the degradation of captopril in an aqueous solution, but not in causing its mineralization. The per-sistent by-products formed under these conditions were correctly assigned by the application of HPLC/HRMS. Results from HPLC/HRMS analyses allowed the detection and characterization of the 10 by-products, all of them persistent even after an exposure time as long as 30 min. These by-products were proposed to be formed via a prompt reaction with hypoclorous acid or attack of hydroxyl radicals on the original substrate as well as on the subsequent intermediate compounds. Based on these results a route for the ozonation and chlorination of CP, which includes its successive oxidation in the aqueous medium, could be proposed. One can also conclude that the samples after the degradations expe-riments were not cytotoxic to HepG2 cells at MTT assay. Thus, these findings underline the fact that toxicity analyses of treated samples and identification of possible by-products are essential in any research that deals with water treat-ment. Future works need to be done to optimize the oxidative conditions in an attempt to enhance high mineralization degree and avoid the accumulation of by-products in the treated water.
Acknowledgements
The authors wish to thank the Minas Gerais State Science Foundation (FAP- EMIG)-process APQ-00918-13 and the Brazilian National Research Council (CNPq)-process 473893-2013-1 for their financial support and the granting of research fellowships.
References
[1] Serra-Roig, M.P., Jurado, A., Diaz-Cruz, M.S., Vazquez-Sune, E., Pujades, E. and Barcelo, D. (2016) Occurrence, Fate and Risk Assessment of Personal Care Products in River-Groundwater Interface. Science of the Total Environment.
[2] Stumpf, M., Ternes, T.A., Wilken, R.-D., Silvana Vianna, R. and Baumann, W. (1999) Polar Drug Residues in Sewage and Natural Waters in the State of Rio de Ja-neiro, Brazil. Science of the Total Environment, 225, 135-141.
https://doi.org/10.1016/S0048-9697(98)00339-8
[3] Andreozzi, R., Raffaele, M. and Nicklas, P. (2003) Pharmaceuticals in STP Effluents and Their Solar Photodegradation in Aquatic Environment. Chemosphere, 50, 1319-1330. https://doi.org/10.1016/S0045-6535(02)00769-5
[4] Heberer, T. (2002) Occurrence, Fate, and Removal of Pharmaceutical Residues in the Aquatic Environment: A Review of Recent Research Data. Toxicology Letters, 131, 5-17. https://doi.org/10.1016/S0378-4274(02)00041-3
https://doi.org/10.1016/j.apcatb.2012.09.023
[6] Bedner, M. and MacCrehan, W.A. (2005) Transformation of Acetaminophen by Chlorination Produces the Toxicants 1,4-Benzoquinone and N-Acetyl-p-benzo- quinone Imine. Environmental Science & Technology, 40, 516-522.
https://doi.org/10.1021/es0509073
[7] Acero, J.L., Benitez, F.J., Real, F.J. and Roldan, G. (2010) Kinetics of Aqueous Chlo-rination of Some Pharmaceuticals and Their Elimination from Water Matrices.
Water Research, 44, 4158-4170. https://doi.org/10.1016/j.watres.2010.05.012
[8] von Gunten, U. (2003) Ozonation of Drinking Water: Part I. Oxidation Kinetics and Product Formation. Water Research, 37, 1443-1467.
https://doi.org/10.1016/S0043-1354(02)00457-8
[9] von Gunten, U. (2003) Ozonation of Drinking Water: Part II. Disinfection and By-Product Formation in Presence of Bromide, Iodide or Chlorine. Water Research, 37, 1469-1487. https://doi.org/10.1016/S0043-1354(02)00458-X
[10] Broseus, R., Vincent, S., Aboulfadl, K., Daneshvar, A., Sauve, S., Barbeau, B. and Prevost, M. (2009) Ozone Oxidation of Pharmaceuticals, Endocrine Disruptors and Pesticides during Drinking Water Treatment. Water Research, 43, 4707-4717.
https://doi.org/10.1016/j.watres.2009.07.031
[11] Lee, Y. and von Gunten, U. (2010) Oxidative Transformation of Micropollutants during Municipal Wastewater Treatment: Comparison of Kinetic Aspects of Selec-tive (Chlorine, Chlorine Dioxide, Ferrate VI, and Ozone) and Non-SelecSelec-tive Oxi-dants (Hydroxyl Radical). Water Research, 44, 555-566.
https://doi.org/10.1016/j.watres.2009.11.045
[12] von Gunten, U. (2007) The Basics of Oxidants in Water Treatment. Part B: Ozone reactions. Water Science & Technology, 55, 25-29.
https://doi.org/10.2166/wst.2007.382
[13] Hillaert, S. and Van den Bossche, W. (1999) Determination of Captopril and Its Degradation Products by Capillary Electrophoresis. Journal of Pharmaceutical and Biomedical Analysis, 21, 65-73. https://doi.org/10.1016/S0731-7085(99)00092-8
[14] Mahmoud, W.M. and Kummerer, K. (2012) Captopril and Its Dimer Captopril Dis-ulfide: Photodegradation, Aerobic Biodegradation and Identification of Transfor-mation Products by HPLC-UV and LC-Ion Trap-MS(n). Chemosphere, 88, 1170- 1177. https://doi.org/10.1016/j.chemosphere.2012.03.064
[15] Small, Jr., W., Molteni, A., Kim, Y.T., Taylor, J.M., Ts'ao, C.H. and Ward, W.F. (1999) Mechanism of Captopril Toxicity to a Human Mammary Ductal Carcinoma Cell Line in the Presence of Copper. Breast Cancer Research and Treatment, 55, 223-229. https://doi.org/10.1023/A:1006233521325
[16] Mascolo, G., Lopez, A., Detomaso, A. and Lovecchio, G. (2005) Ion Chromatogra-phy-Electrospray Mass Spectrometry for the Identification of Low-Molecular-Weight Organic Acids during the 2,4-Dichlorophenol Degradation. Journal of Chromato-graphy A, 1067, 191-196. https://doi.org/10.1016/j.chroma.2004.12.058
[17] Hart, E.J., Sehested, K. and Holoman, J. (1983) Molar Absorptivities of Ultraviolet and Visible Bands of Ozone in Aqueous Solutions. Analytical Chemistry, 55, 46-49.
https://doi.org/10.1021/ac00252a015
[18] Trovó, A.G., Pupo Nogueira, R.F., Agüera, A., Fernandez-Alba, A.R. and Malato, S. (2011) Degradation of the Antibiotic Amoxicillin by Photo-Fenton Process—Che- mical and Toxicological Assessment. Water Research,45, 1394-1402.
https://doi.org/10.1016/j.watres.2010.10.029
By-Products via Liquid Chromatography Coupled to High-Resolution Mass Spec-trometry and Assessment of Their Toxicities against Artemia salina. Journal of Mass Spectrometry, 49, 145-153. https://doi.org/10.1002/jms.3320
[20] da Silva, J.C., Reis Teodoro, J.A., Afonso, R.J., Aquino, S.F. and Augusti. R. (2014) Photodegradation of Bisphenol A in Aqueous Medium: Monitoring and Identifica-tion of By-Products by Liquid Chromatography Coupled to High-ResoluIdentifica-tion Mass Spectrometry. Rapid Communications in Mass Spectrometry, 28, 987-994.
https://doi.org/10.1002/rcm.6863
[21] e Freitas, J.R.L., Quintão, F.J.O., Silva, J.C.C.D., Silva, S.D.Q., Aquino, S.F. and Afonso, R.J.D.C.F. (2017) Characterisation of Captopril Photolysis and Photocata-lysis By-Products in Water by Direct Infusion, Electrospray Ionisation, High-Res- olution Mass Spectrometry and the Assessment of Their Toxicities. International Journal of Environmental Analytical Chemistry, 96, 1074-1090.
[22] Quintão, F.J., Freitas, J.R., de Fatima Machado, C., Aquino, S.F., de Queiroz Silva, S. and de Cassia Franco Afonso, R.J. (2016) Characterization of Metformin By-Prod- ucts under Photolysis, Photocatalysis, Ozonation and Chlorination by High Per-formance Liquid Chromatography Coupled to High-Resolution Mass Spectrometry (HPLC/HRMS). Rapid Communications in Mass Spectrometry.
https://doi.org/10.1002/rcm.7724
[23] Mosmann, T. (1983) Rapid Colorimetric Assay for Cellular Growth and Survival: Application to Proliferation and Cytotoxicity Assays. Journal of Immunological Methods, 65, 55-63. https://doi.org/10.1016/0022-1759(83)90303-4
[24] Freimoser, F.M., Jakob, C.A., Aebi, M. and Tuor, U. (1999) The MTT [3-(4,5-Di- methylthiazol-2-yl)-2,5-Diphenyltetrazolium Bromide] Assay Is a Fast and Reliable Method for Colorimetric Determination of Fungal Cell Densities. Applied and En-vironmental Microbiology, 65, 3727-3729.
[25] Žegura, B., Heath, E., Černoša, A. and Filipič, M. (2009) Combination of In Vitro
Bioassays for the Determination of Cytotoxic and Genotoxic Potential of Wastewa-ter, Surface Water and Drinking Water Samples. Chemosphere, 75, 1453-1460.
https://doi.org/10.1016/j.chemosphere.2009.02.041
[26] Gerlier, D. and Thomasset, N. (1986) Use of MTT Colorimetric Assay to Measure Cell Activation. Journal of Immunological Methods, 94, 57-63.
https://doi.org/10.1016/0022-1759(86)90215-2
[27] Deborde, M. and von Gunten, U. (2008) Reactions of Chlorine with Inorganic and Organic Compounds during Water Treatment—Kinetics and Mechanisms: A criti-cal Review. Water Research, 42, 13-51. https://doi.org/10.1016/j.watres.2007.07.025
Submit or recommend next manuscript to SCIRP and we will provide best service for you:
Accepting pre-submission inquiries through Email, Facebook, LinkedIn, Twitter, etc. A wide selection of journals (inclusive of 9 subjects, more than 200 journals)
Providing 24-hour high-quality service User-friendly online submission system Fair and swift peer-review system
Efficient typesetting and proofreading procedure
Display of the result of downloads and visits, as well as the number of cited articles Maximum dissemination of your research work
Submit your manuscript at: http://papersubmission.scirp.org/