EUROPEAN ORGANISATION FOR NUCLEAR RESEARCH (CERN)
Submitted to: PRD CERN-PH-EP-2015-212
15th September 2015
Search for pair production of a new heavy quark that decays into a
W boson and a light quark in pp collisions at
√
s
= 8 TeV with the
ATLAS detector
The ATLAS Collaboration
Abstract
A search is presented for pair production of a new heavy quark (Q) that decays into a W boson and a light quark (q) in the final state where one W boson decays leptonically (to an electron or muon plus a neutrino) and the other W boson decays hadronically. The analysis is performed using an integrated luminosity of 20.3 fb−1of pp collisions at √s= 8 TeV col-lected by the ATLAS detector at the LHC. No evidence of Q ¯Qproduction is observed. New chiral quarks with masses below 690 GeV are excluded at 95% confidence level, assuming BR(Q → Wq) = 1. Results are also interpreted in the context of vectorlike quark models, resulting in the limits on the mass of a vectorlike quark in the two-dimensional plane of BR(Q → Wq) versus BR(Q → Hq).
c
2015 CERN for the benefit of the ATLAS Collaboration.
Reproduction of this article or parts of it is allowed as specified in the CC-BY-3.0 license.
1 Introduction
The recent observation of the long-predicted Higgs boson by the ATLAS [1] and CMS [2] collaborations now completes the Standard Model (SM). In spite of its success, the SM cannot account for dark matter and the matter/antimatter asymmetry in the Universe and also fails to provide insight into the fermion mass spectrum, nonzero neutrino masses, why there are three generations of fermions, or why parity is not violated in the strong interaction. Furthermore, the observed Higgs boson is unnaturally light, requiring fine tuning to cancel radiative corrections that would naturally result in a mass many orders of magnitude larger, a discrepancy known as the hierarchy problem [3].
A variety of models have been proposed to address the various shortcomings of the SM. For example, a primary motivation for supersymmetry (SUSY) is to solve the hierarchy problem [4]. In SUSY mod-els, the quadratically divergent radiative corrections to the Higgs-boson mass due to SM particles are automatically canceled by the corrections from the supersymmetric partners. Models such as Little Higgs, Composite Higgs, and Topcolor take a different approach, proposing that electroweak symmetry breaking happens dynamically as the result of a new strong interaction [5–9]. Grand unified theories (GUTs) go further, unifying the electroweak and strong forces by proposing that the SM gauge symmetry SU(3)C× SU(2)L× U(1)Yis the low-energy limit of a single fundamental symmetry group such as SO(10)
or E6[10,11], which could potentially explain the observed spectrum of fermions and even provide
in-sight into the unification of the electroweak and strong forces with gravity. A feature in many of these, and other models [12–14], is the prediction of vectorlike quarks (VLQs), hypothetical spin-12 particles that are triplets under the color gauge group and have identical transformation properties for both chiralit-ies under the electroweak symmetry group. Furthermore, massive VLQs would respect gauge invariance without coupling to the Higgs field. This allows VLQs to avoid constraints from Higgs-boson produc-tion [15]; if the Higgs sector is minimal, these constraints rule out addiproduc-tional chiral quarks. However, some two-Higgs-doublet models are able to avoid those constraints and accommodate a fourth generation of quarks [16].
In the models of interest, the VLQs have some mixing with the SM quarks, allowing them to decay to SM quarks and either a W, Z, or Higgs boson; however, the exact nature of the coupling depends on the model. For example, in composite Higgs models, the VLQs are involved in a seesaw mechanism with the SM quarks, so the lightest VLQ couples almost exclusively to the heaviest SM quarks (t- and b-quarks) [6]. However, there are also models that predict TeV-scale VLQs that could preferentially decay to light SM quarks (q = u, d, s, or c) [10, 11, 17]. For example, the left-right mirror model (LRMM) [17] predicts three generations of heavy “mirror” quarks, with the lightest mirror generation coupling to the lightest SM generation. The two lightest mirror quarks could be pair-produced at the LHC via the strong interaction and would then decay to Wq, Zq, or Hq (q = u or d). The LRMM would provide an explanation for tiny neutrino masses, parity violation in weak interactions, parity conservation in strong interactions, and could be the first step toward uncovering the symmetry structure of a GUT. Another model predicting VLQs that decay to light quarks is the E6 GUT with isosinglet quarks [10,11]. In this model, after the
E6 symmetry is broken down to the SM group structure, VLQ partners to the d-, s-, and b-quarks are
predicted. If the VLQs have the same mass ordering as their SM partners, the lightest VLQ would couple predominately to first-generation SM quarks (q= u or d). The values for the branching ratios to the three decay modes (Wq, Zq, Hq) depend on parameters in the model. The values in the E6 isosinglet model
range from approximately (0.6, 0.3, 0.1) to (0.5, 0.25, 0.25), while the LRMM allows branching ratios from approximately (0.6, 0.4, 0) to (0, 0, 1), depending on the VLQ mass and mixing angles.
If such new quarks exist, they are expected to be produced predominantly in pairs via the strong in-teraction for masses up to O(1 TeV) in LHC collisions with a center-of-mass energy of 8 TeV. Single production of a new heavy quark, Q, would be dominant for very high quark masses, but the production rate is model-dependent and could be suppressed if the coupling to SM quarks is small. To date, there have been two analyses of LHC data sensitive to VLQs that decay to light quarks, both using 1.04 fb−1of ATLAS data at √s= 7 TeV: one search for pair-production [18] and one for single production [19]. The pair-production search set a lower limit on the Q mass of 350 GeV at 95% confidence level, assuming BR(Q → Wq)= 1. Such a signal was also ruled out by the Tevatron for masses up to 340 GeV [20].
q Q ¯ Q ¯ q g g W W g q Q W g Q¯ q¯ W g q Q W g Q¯ ¯ q W q Q ¯ Q ¯ q q ¯ q W W
Figure 1: Leading-order Feynman diagrams for Q ¯Q → WqW¯q production at the LHC.
This paper presents a search for new heavy quarks that couple to light SM quarks using data collected by the ATLAS detector. The analysis focuses on model-independent pair production of a new heavy quark and its antiparticle, which then decay through a charged-current interaction to a final state with a single electron or muon, missing transverse momentum and light SM quarks, making it complementary to searches for VLQs that decay to third-generation quarks [21–28]. The dominant Feynman diagrams for the signal process are shown in Fig. 1. Background rejection is achieved through event topology and kinematic requirements. In particular, a kinematic variable motivated by the splitting scale of a heavy object into daughter particles [29,30] is used to reduce the background when selecting the pair of jets consistent with a hadronically decaying W boson. The statistical interpretation of the data uses the invariant mass distribution of the Q candidate formed from the hadronically decaying W boson and a light quark. The results are interpreted both in the context of VLQs and a chiral fourth-generation quark.
2 The ATLAS detector
The ATLAS detector [31] at the LHC covers nearly the entire solid angle around the interaction point (IP).1 It consists of an inner tracking detector surrounded by a thin superconducting solenoid, electro-magnetic and hadronic calorimeters, and a muon spectrometer incorporating three large superconducting toroid magnets.
The inner tracking detector system is immersed in a 2 T axial magnetic field and provides charged-particle tracking in the range |η| < 2.5. A high-granularity silicon pixel detector covers the interaction region and typically provides three measurements per track. It is followed by a silicon microstrip tracker, which usually provides four two-dimensional measurement points per track. These silicon detectors are com-plemented by a transition radiation tracker, which enables radially extended track reconstruction up to |η| = 2.0. The transition radiation tracker also provides electron identification information based on
1ATLAS uses a right-handed coordinate system with its origin at the nominal IP in the center of the detector and the z-axis
along the beam pipe. The x-axis points from the IP to the center of the LHC ring, and the y-axis points upwards. Cylindrical coordinates (r, φ) are used in the transverse plane, φ being the azimuthal angle around the z-axis. The pseudorapidity is defined
the fraction of hits (typically 30 in total) above a higher threshold for energy deposits corresponding to transition radiation.
The calorimeter system covers the pseudorapidity range |η| < 4.9. Within the region |η| < 3.2, electromag-netic calorimetry is provided by barrel and endcap high-granularity lead/liquid-argon (LAr) calorimeters, with an additional thin LAr presampler covering |η| < 1.8, to correct for energy loss in material upstream of the calorimeters. Hadronic calorimetry is provided by the steel/scintillator-tile calorimeter, segmen-ted into three barrel structures within |η| < 1.7, and two copper/LAr hadronic endcap calorimeters with |η| < 3.2. The solid angle coverage is completed with forward copper/LAr and tungsten/LAr calorimeter modules optimized for electromagnetic and hadronic measurements respectively.
The muon spectrometer comprises separate trigger and high-precision tracking chambers measuring the deflection of muons in a magnetic field generated by superconducting air-core toroids. The precision chamber system covers the region |η| < 2.7 with three layers of monitored drift tubes, complemented by cathode strip chambers in the forward region, where the background is highest. The muon trigger system covers the range |η| < 2.4 with resistive plate chambers in the barrel, and thin-gap chambers in the endcap regions.
A three-level trigger system [32] is used to select events for offline analysis. The Level-1 trigger is implemented in hardware and uses a subset of detector information to reduce the event rate to at most 75 kHz. This is followed by two software-based trigger levels that together reduce the event rate to about 400 Hz.
3 Signal and background samples
The pair-production cross section for a new heavy quark ranges from 12 pb for a 300 GeV quark to 21 fb for a 800 GeV quark. It was calculated at next-to-next-to-leading-order (NNLO) in QCD, including resummation of next-to-next-to-leading logarithmic (NNLL) soft gluon terms, with Top++2.0 [33–38], using the MSTW2008 NNLO [39,40] set of parton distribution functions (PDFs) and αS = 0.117. The
PDF and αSuncertainties were calculated using the PDF4LHC prescription [41] with the MSTW2008
68% CL NNLO, CT10 NNLO [42], and NNPDF2.3 5f FFN [43] PDF sets. The uncertainties in the prediction stem from scale variations and the PDF+αSuncertainty and range from approximately 11% to
12% for masses from 300 GeV to 800 GeV.
VLQ signal samples were simulated with the tree-level event generator CompHEP v4.5.1 [44] at the parton level with the CTEQ6L1 LO PDF set [45] and with the QCD scale set to the mass of the heavy quark, mQ. The generated events were then passed into Pythia v8.165 [46, 47] for hadronization and parton
showering. The VLQ signal samples were produced for values of mQranging from 300 GeV to 800 GeV
in 100 GeV steps. This range is motivated by the previous limit at 350 GeV and the expected sensitivity of this analysis to masses up to approximately 700 GeV. Although the analysis is targeting the Q → Wq decay, there is also sensitivity to the neutral-current decays Q → Zq and Q → Hq (e.g., Q ¯Q → WqZ¯q → `νqq¯q¯q) and events were generated for all six decay combinations. In addition to the VLQ signal samples, a set of fourth-generation chiral-quark signal samples were generated with Pythia v8.1 using the MSTW 2008 LO PDF set. The kinematics of the chiral-quark signal samples, which only contain Q ¯Q → WqW¯q, are compatible with the VLQ samples when requiring BR(Q → Wq)= 1. Therefore, the more generic VLQ samples are used for the statistical analysis, with the sample corresponding to mQ= 700 GeV and
The background originates mainly from W-boson production in association with jets, W+jets, with lesser contributions from top quark pair production (t¯t), Z+jets, single-top, diboson, and multijet events. The W+jets and Z+jets samples were produced using Sherpa v1.4.1 [48] with the CT10 PDF set, taking the c- and b-quarks as massive. Samples of t¯t and single-top events were generated with Powheg-Box 3.0 [49, 50] interfaced to Pythia v6.426 [47] using the Perugia2011C set of tunable parameters [51] for the underlying event and the CTEQ6L1 PDF set. Diboson production was modeled using Alpgen v2.13 [52] interfaced to Herwig v6.520 [53] with the CTEQ6L1 PDF set, except for the lepton+jets final state (WV → `νqq with V = W, Z), which used the Sherpa v1.4.1 event generator with the CT10 PDF set. The contribution from multijet events originates from the misidentification of a jet or a photon as an electron, or from the semileptonic decay of a b- or c-quark, and the matrix method [54] is used to determine the kinematic distributions for the multijet background.
The W/Z+jets and multijet backgrounds are normalized to data and a data-driven correction is applied to the transverse momentum pT of the boson as described in Sec.5.1. The t¯t cross section is
determ-ined by the Top++ prediction, with the top-quark mass taken to be 172.5 GeV. The single-top samples are normalized to the approximate NNLO theoretical cross sections [55–57] calculated using the MSTW 2008 NNLO PDF set. The diboson background processes are normalized to NLO theoretical cross sec-tions [58].
All simulated samples include multiple pp interactions per bunch crossing and simulated events are weighted such that the distribution of the average number of interactions per bunch crossing agrees with data. The generated samples are processed through a simulation [59] of the detector geometry and re-sponse using Geant4 [60], then reconstructed using the same software as used for data. Simulated events are corrected so that the object identification efficiencies, energy scales, and energy resolutions match those determined in data control samples.
4 Event selection
The data analyzed in this search were collected with the ATLAS detector in 2012 and correspond to an integrated luminosity of 20.3 fb−1. Data quality requirements are applied to remove events with incom-plete, corrupted, or otherwise compromised subdetector information. Events are required to pass a single-electron or single-muon trigger. The pTthresholds are 24 GeV and 60 GeV for the electron triggers and
24 GeV and 36 GeV for the muon triggers. The lower-threshold triggers include isolation requirements on the candidate leptons, resulting in inefficiencies at higher pTthat are recovered by the higher-threshold
triggers without an isolation requirement.
4.1 Preselection
The basic object selection is called preselection and requires exactly one charged lepton (electron or muon), at least four jets, and large missing transverse momentum (EmissT ), as described below. The criteria are similar to those used in recent ATLAS top-quark studies [61], except that this analysis requires that there are no jets identified as originating from a b-quark. The expected and observed numbers of events after preselection are shown in Table1. There is negligible sensitivity to heavy quark production because the signal expectations for all masses are much smaller than the uncertainty on the background, dominated at this stage by systematic uncertainties.
Charged-lepton requirements
Electron candidates are required to have pT > 25 GeV and either |η| < 1.37 or 1.52 < |η| < 2.47 to
exclude the transition between the barrel and endcap calorimeters. Muon candidates are required to have pT > 25 GeV and |η| < 2.5. Nonprompt leptons and nonleptonic particles may be reconstructed as leptons
and satisfy the selection criteria, giving rise to nonprompt and fake lepton backgrounds. In the case of electrons, these include contributions from semileptonic decays of b- and c-quarks, photon conversions, and jets with a large electromagnetic energy fraction. Nonprompt or fake muons can originate from semileptonic decays of b- and c-quarks, from charged-hadron decays in the tracking volume or in had-ronic showers, or from punchthrough particles emerging from high-energy hadhad-ronic showers [54]. The nonprompt and fake lepton backgrounds are reduced by requiring the lepton candidates to be isolated from other energy deposits or high-pTtracks. The tracks used in the isolation calculation are required to
originate from the primary interaction vertex and have pT > 1 GeV. For electrons, an η-dependent limit
is placed on the amount of energy measured in the calorimeter within a∆R = 0.2 cone around the can-didate which is neither from the electron cancan-didate itself nor from additional pp interactions. A similar requirement is placed on the scalar sum of the pTof tracks within a ∆R = 0.3 cone around the track of
the electron candidate. Each requirement has an average efficiency of 90% for electrons from Z → ee. Muons are required to have a pT-dependent track isolation [62], requiring the scalar sum of the pT from
tracks with∆R < 10 GeV/pµT to be less than 0.05 · pµT, where pµT is the pT of the candidate muon track.
This requirement has an efficiency of approximately 95% for muons from W → µν.
In this analysis, τ leptons are not explicitly reconstructed. Because of the high pTthreshold, only a small
fraction of τ leptons decaying leptonically are reconstructed as electrons or muons, while the majority of τ leptons decaying hadronically are reconstructed as jets.
Jet requirements
Events must contain at least four jets with pT > 25 GeV and |η| < 2.5 reconstructed using the anti-kt
algorithm [63] with a radius parameter R = 0.4. The jets are constructed from calibrated topological clusters built from energy deposits in the calorimeters, and they are calibrated to the hadronic scale [64]. Prior to jet finding, a local cluster calibration scheme [65] is applied to correct the topological cluster energies for the effects of calorimeter noncompensation, dead material and out-of-cluster leakage. The jet energy scale was determined using information from test-beam data, LHC collision data, and simula-tion [64,66]. All jets are required to have at least two tracks that originate from the primary interaction vertex. In order to suppress jets that do not originate from the primary vertex, jets with pT< 50 GeV and
|η| < 2.4 are required to have a jet vertex fraction (JVF) above 0.5, where JVF is the ratio of the summed scalar pT of tracks originating from the primary vertex to that of all tracks associated with the jet. An
overlap removal procedure [61] is applied to remove jets that were already identified as electrons. To identify jets originating from the hadronization of a b-quark (‘b-tagging’), a continuous discriminant is produced by an algorithm using multivariate techniques [67] to combine information from the impact parameter of displaced tracks and topological properties of secondary and tertiary vertices reconstructed within the jet. The efficiency for a jet containing a b-hadron to be b-tagged is 70%, while the light-jet (c-jet) efficiency is less than 1% (20%) as determined in simulated t¯tevents, where light jets are jets initiated by a u-, d-, s-quark, or gluon. If any jets are b-tagged, the event is rejected.
Missing transverse momentum requirements
The ~EmissT is constructed from the vector sum of calibrated energy deposits in the calorimeter and re-constructed muons [68]. Events that do not contain a leptonically decaying W boson are suppressed by requiring EmissT > 30 GeV and (ETmiss+ mWT) > 60 GeV, where mWT is the transverse mass of the W boson defined as mWT =
q
2p`TEmissT (1 − cos∆φ), where ∆φ is the azimuthal angle between the charged-lepton transverse momentum vector and ~EmissT .
Table 1: Observed and expected event yields after preselection. The quoted uncertainties include both the statistical and systematic contributions, with the latter being dominant. The sources of systematic uncertainty are discussed in Sec.6. Electron Muon W+jets 110000+15000−21000 145000+20000−28000 Z+jets 28000+14000−15000 15200+7700−7800 t¯t 19200+2800−2900 23700+3400−3500 Diboson 3900 ±1900 4400 ±2200 Single top 3750+540−560 4500+630−710 Multijet 22000 ±8800 13300 ±5300 Total background 183000+27000−33000 206000+27000−34000 Signal (mQ= 700 GeV) 79 ±10 79 ±10 Data 182075 208641 4.2 Final selection
With the final-state objects identified, additional kinematic requirements are applied to exploit the distinct features of the signal, assumed to be heavier than the previously excluded mass of 350 GeV. The W boson and light quark originating from Q → Wq would be very energetic and have a large angular separation due to the large mass of the Q quark. On the other hand, the decay products of the W boson would tend to have a small separation due to the W boson’s boost. By selecting only events that are consistent with these properties, the W+jets background yield is reduced by orders of magnitude. To facilitate the discussion of the kinematic selection, the following objects are defined:
• Whadis the candidate for a W boson in the decay Q → Wq → qqq;
• Wlepis the candidate for a W boson in the decay Q → Wq → `νq;
• q-jet is a candidate for the jet originating from the q in Q → Wq (i.e., from the decay of the heavy quark, not the hadronically decaying W boson). There are two q-jets per event, so q1(q2) is used to
The Whad candidate is defined as a dijet system with pT > 200 GeV, angular separation ∆R < 1.0, and
an invariant mass in the range 65–100 GeV. All possible jet combinations are considered and, if multiple pairs satisfy the above requirements, the pair with the mass closest to that of the W boson [69] is chosen. If no Whadcandidate is found, the event is removed. This requirement results in 94% background rejection
while keeping 53% of the signal if mQ= 700 GeV. The mass distribution of the Whadcandidates prior to
the mass requirement is shown in Fig.2.
0 50 100150200250
Events / 10 GeV 1 10 2 10 3 10 4 10 5 10 6 10 7 10 Data W+jets Z+jets Multijet Diboson t t Single top = 700 GeV Q Signal, m Uncertainty ATLAS 4 jets ≥ e + preselection -1 = 8 TeV, 20.3 fb s [GeV] jj m 0 50 100 150 200 250 Sig. -2 0 20 50 100150200250
Events / 10 GeV 1 10 2 10 3 10 4 10 5 10 6 10 7 10 Data W+jets Z+jets Multijet Diboson t t Single top = 700 GeV Q Signal, m Uncertainty ATLAS 4 jets ≥ + µ preselection -1 = 8 TeV, 20.3 fb s [GeV] jj m 0 50 100 150 200 250 Sig. -2 0 2Figure 2: Invariant mass distributions for dijet systems with pT > 200 GeV, angular separation ∆R < 1.0, and an
invariant mass closest to the W boson mass, for the (left) electron and (right) muon channels after the preselection requirements. Whadcandidates correspond to the mass range 65–100 GeV. The highest bin includes all events with
mj j> 240 GeV. The shaded band shows the total uncertainty on the background prediction. The lower panel shows
the significance of the difference between data and expectation in units of normal standard deviations as explained in Ref. [70].
The Wlep candidate is reconstructed using the lepton and ~EmissT , which is taken to be the neutrino ~pT.
The longitudinal momentum of the neutrino is determined up to a two-fold ambiguity by requiring the invariant mass of the lepton–neutrino system to equal the mass of the W boson. When no real solution exists, the neutrino pseudorapidity is set equal to that of the lepton because the decay products of the Wboson tend to be nearly collinear for the kinematic regime of interest. In simulated samples, the rate of events with no real solution is approximately 35%. Signal events are expected to have energetic W bosons, so the Wlepcandidate is required to have pT > 125 GeV.
The W candidates (Whad and Wlep) are then each paired with a different one of the remaining jets to
create the two heavy quark candidates, Q1 and Q2. This step involves testing all possible pairings of q-jet candidates with the Whad and Wlepcandidates. In addition, the Wlep candidate may have two real
solutions for the longitudinal momentum of the neutrino. Among the possible combinations of neutrino momentum solutions and Wq pairings, the one yielding the smallest absolute difference between the two reconstructed heavy quark masses is chosen. In simulated samples, the rate of correct Wq pairing is approximately 40% (48%) for a signal of mass 400 GeV (800 GeV). Once the heavy quark candidates are determined, the q-jets are required to have pT(q1) > 160 GeV and pT(q2) > 120 GeV and the difference
With candidate objects identified for two heavy quarks and their decay products, the following additional kinematic criteria are applied. Each event must have HT > 1100 GeV, where HT is the scalar sum of the
transverse momenta of the lepton, neutrino, Whad, and the two q-jets. The angular separation between the
lepton and neutrino candidates must satisfy∆R(`, ν) < 1.4. The heavy quarks would tend to be central and back-to-back, so the angular separation between the two reconstructed heavy quarks is required to satisfy 2.0 <∆R(Q1, Q2) < 4.2.
To further capitalize on the presence of a hadronically decaying W boson with high pTin the signal, the
analysis makes use of a splitting variable [30] defined as: y12 =
min(pT j1, pT j2)2×∆R( j1, j2)2
m2j1 j2 ;
where j1 and j2 are the two jets from the Whad candidate and mj1 j2 is the mass of the Whad candidate.
The two jets from a hadronically decaying W boson tend to have roughly equal energies, while dijets from QCD processes are likely be asymmetric in energy. Furthermore, jets from W → qq tend to have a larger opening angle due to the mass of the W boson. Dividing by the dijet mass provides discrimination for cases in which a QCD dijet system happens to have large values for min(pT j1, pT j2)2and∆R( j1, j2)2,
as such systems are likely to have a very large mass. The background is reduced by a factor of 3.2 by requiring y12> 0.25. This requirement has a signal efficiency of approximately 50%, although the precise
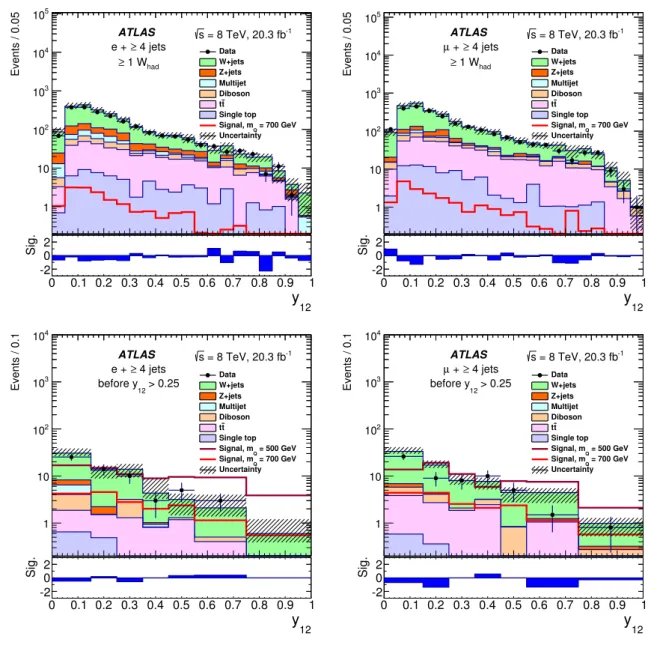
value depends on the mass of the heavy quark. The modeling of the splitting variable with a large number of events can be seen in the top histograms of Fig.3, which depict the y12distribution after preselection
and requiring a Whadcandidate. The bottom of Fig.3contains the distributions of y12immediately before
the y12> 0.25 requirement is applied.
The final selection criteria are motivated by the fact that the decay products from the Q quark are well separated. The final requirements are∆R(Whad, q1) > 1.0,∆R(Whad, q2) > 1.0,∆R(Wlep, q1) > 1.0, and
∆R(Wlep, q2) > 1.0. Table2presents a summary of the expected and observed numbers of events after the
final selection, for which the signal (background) efficiency compared to preselection is approximately 8% (0.004%). The small contributions from t¯t, Z+jets, dibosons, single-top, and multijet events are combined into a single background source referred to as ‘non-W+jets’. Uncertainties on the yields include the uncertainty due to the size of the signal and background samples and the cumulative effect of the systematic uncertainty described in Sec.6.
The final discriminant variable used in this search is mreco, the reconstructed heavy quark mass built from
the Whadcandidate and the paired q-jet candidate.
5 Background modeling
5.1 Correction to W+jets modeling
It is observed after applying the preselection criteria that the simulated W+jets sample does not accurately model the pT spectrum of the leptonically decaying W boson candidate. This mismodeling leads to an
overestimation of the W+jets yields in the high-momentum tails of the Emiss
T , lepton pT, jet pT, and
HT distributions. The dominant background for this analysis is W+jets events in which the transverse
momentum of the W boson, pT(W), is high. Therefore, it is important to have accurate predictions for
00.1
0.2
0.3
0.4
0.5
0.6
0.7
0.8
0.91
Events / 0.05 1 10 2 10 3 10 4 10 5 10 Data W+jets Z+jets Multijet Diboson t t Single top = 700 GeV Q Signal, m Uncertainty ATLAS 4 jets ≥ e + had 1 W ≥ -1 = 8 TeV, 20.3 fb s 12 y 0 0.1 0.2 0.3 0.4 0.5 0.6 0.7 0.8 0.9 1 Sig. -2 0 200.1
0.2
0.3
0.4
0.5
0.6
0.7
0.8
0.91
Events / 0.05 1 10 2 10 3 10 4 10 5 10 Data W+jets Z+jets Multijet Diboson t t Single top = 700 GeV Q Signal, m Uncertainty ATLAS 4 jets ≥ + µ had 1 W ≥ -1 = 8 TeV, 20.3 fb s 12 y 0 0.1 0.2 0.3 0.4 0.5 0.6 0.7 0.8 0.9 1 Sig. -2 0 200.1
0.2
0.3
0.4
0.5
0.6
0.7
0.8
0.91
Events / 0.1 1 10 2 10 3 10 4 10 Data W+jets Z+jets Multijet Diboson t t Single top = 500 GeV Q Signal, m = 700 GeV Q Signal, m Uncertainty ATLAS 4 jets ≥ e + > 0.25 12 before y -1 = 8 TeV, 20.3 fb s 12 y 0 0.1 0.2 0.3 0.4 0.5 0.6 0.7 0.8 0.9 1 Sig. -2 0 200.1
0.2
0.3
0.4
0.5
0.6
0.7
0.8
0.91
Events / 0.1 1 10 2 10 3 10 4 10 Data W+jets Z+jets Multijet Diboson t t Single top = 500 GeV Q Signal, m = 700 GeV Q Signal, m Uncertainty ATLAS 4 jets ≥ + µ > 0.25 12 before y -1 = 8 TeV, 20.3 fb s 12 y 0 0.1 0.2 0.3 0.4 0.5 0.6 0.7 0.8 0.9 1 Sig. -2 0 2Figure 3: The splitting variable y12 between the decay products of the hadronic W boson (top) after preselection
and requiring a hadronic W boson candidate and (bottom) immediately before applying the requirement y12> 0.25,
for the (left) electron and (right) muon channels. The shaded band shows the total uncertainty on the background prediction. The lower panel shows the significance of the difference between data and expectation in units of normal standard deviations.
Table 2: Expected yields for the backgrounds and the VLQ signal with mQ = 700 GeV, along with the observed
number of data events, after applying all selection criteria. The uncertainties on the predicted yields correspond to the statistical uncertainty due to finite sample size and the systematic uncertainty, respectively.
Electron Muon W+jets 5.6 ±1.5+1.5−1.2 6.0 ±1.0+2.2−1.6 Non-W+jets 1.2 ±0.5+1.0−0.4 1.2 ±0.4+0.8−1.0 Total background 6.8 ±1.6+2.4−1.5 7.2 ±1.1+2.5−2.3 Signal (mQ= 700 GeV) 7.0 ±0.6+1.1−1.3 6.9 ±0.6+1.0−1.0 Data 9 11
derive the W+jets and multijet normalizations and a reweighting function to correct the vector-boson pT
in the W+jets and Z+jets2simulated samples. All steps in the procedure rely on fits to the data using the
pTdistribution of the Wlepcandidate, precoT (Wlep), after applying the preselection requirements.
First, the normalizations for the W+jets templates and the multijet templates are fit to the data, with all other background processes fixed at their expectations. The difference between the observed and predicted number of W+jets events is assumed to be due to the cross section differing from its predicted value, so the electron and muon channels are fit simultaneously to determine a single W+jets scale factor of 0.82. A correction for ptruthT (V) is then derived that minimizes the χ2 between data and simulation for the precoT (Wlep) distribution, where ptruthT (V) is the pT of the generated vector boson in the W+jets or
Z+jets sample just before its leptonic decay. The reweighting is approximately unity for low ptruthT (V), decreasing to 0.86 for ptruthT (V)= 200 GeV and 0.65 for ptruthT (V)= 500 GeV. Finally, the normalizations for the multijet samples and the corrected W+jets samples are fit to the data, with all other background processes fixed. The fit is done simultaneously in the electron and muon channels. Figure4shows the precoT (Wlep) distribution in the electron and muon channels after applying the ptruthT (V) correction and scale
factors. The corresponding distributions for HT and EmissT are shown in Figs.5and6. The uncertainties
on the normalizations and ptruthT (V) reweighting are described in Sec.6.
5.2 Validation regions
The following validation regions are used to verify the modeling of the background processes: • VR1: preselection, plus one Whadand mreco< 350 GeV;
• VR2: preselection, plus one Whadand HT < 800 GeV ;
• VR3: final selection, but with the requirements on pT(q1), pT(q2), and HT changed to pT(q1) <
160 GeV, pT(q2) < 80 GeV, and HT < 800 GeV and with no requirements on ∆R(Whad, q1),
∆R(Whad, q2),∆R(Wlep, q1), and∆R(Wlep, q2).
The validation regions are orthogonal to the signal region, but are nevertheless useful for checking with a larger number of events that the background normalization and kinematics are well-modeled. The expec-ted signal contribution in each validation region is approximately the size of the background uncertainty
0100
200
300
400
500
600
700
800
Events / 40 GeV 1 10 2 10 3 10 4 10 5 10 6 10 7 10 Data W+jets Z+jets Multijet Diboson t t Single top = 700 GeV Q Signal, m Uncertainty ATLAS 4 jets ≥ e + preselection -1 = 8 TeV, 20.3 fb s )[GeV] lep (W reco T p 0 100 200 300 400 500 600 700 800 Sig. -2 0 20100
200
300
400
500
600
700
800
Events / 40 GeV 1 10 2 10 3 10 4 10 5 10 6 10 7 10 Data W+jets Z+jets Multijet Diboson t t Single top = 700 GeV Q Signal, m Uncertainty ATLAS 4 jets ≥ + µ preselection -1 = 8 TeV, 20.3 fb s )[GeV] lep (W reco T p 0 100 200 300 400 500 600 700 800 Sig. -2 0 2Figure 4: The transverse momentum distributions for the leptonic W boson candidate after the ptruth
T (V) correction
and final normalization for the (left) electron and (right) muon channels. All overflows are included in the right-most bin. The shaded band shows the total uncertainty on the background prediction. The lower panel shows the significance of the difference between data and expectation in units of normal standard deviations.
0 5001000
1500
2000
2500
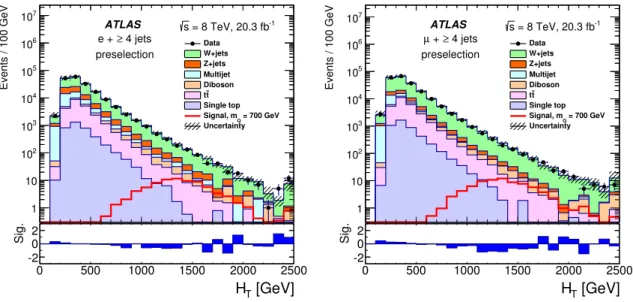
Events / 100 GeV 1 10 2 10 3 10 4 10 5 10 6 10 7 10 Data W+jets Z+jets Multijet Diboson t t Single top = 700 GeV Q Signal, m Uncertainty ATLAS 4 jets ≥ e + preselection -1 = 8 TeV, 20.3 fb s [GeV] T H 0 500 1000 1500 2000 2500 Sig. -2 0 20 5001000
1500
2000
2500
Events / 100 GeV 1 10 2 10 3 10 4 10 5 10 6 10 7 10 Data W+jets Z+jets Multijet Diboson t t Single top = 700 GeV Q Signal, m Uncertainty ATLAS 4 jets ≥ + µ preselection -1 = 8 TeV, 20.3 fb s [GeV] T H 0 500 1000 1500 2000 2500 Sig. -2 0 2Figure 5: Distributions of the scalar sum of the transverse momenta of the lepton, neutrino, Whad, and the two
q-jets (HT) after the ptruthT (V) correction and final normalization for the (left) electron and (right) muon channels.
All overflows are included in the rightmost bin. The shaded band shows the total uncertainty on the background prediction. The lower panel shows the significance of the difference between data and expectation in units of normal standard deviations.
for signal masses around the previous limit (350 GeV) and decreases very rapidly for higher masses. VR2 and VR3 are used to validate the modeling of the final discriminant, mreco, as shown in Figs.7and 8.
050
100
150
200
250
300
350
400
450
500
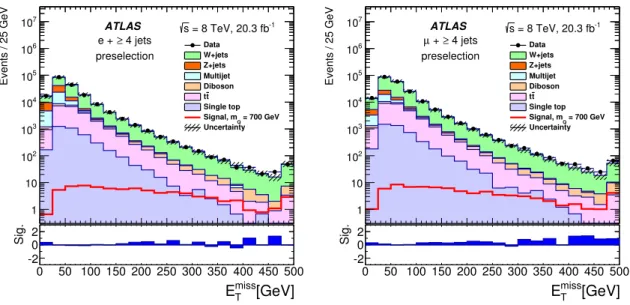
Events / 25 GeV 1 10 2 10 3 10 4 10 5 10 6 10 7 10 Data W+jets Z+jets Multijet Diboson t t Single top = 700 GeV Q Signal, m Uncertainty ATLAS 4 jets ≥ e + preselection -1 = 8 TeV, 20.3 fb s [GeV] T miss E 0 50 100 150 200 250 300 350 400 450 500 Sig. -2 0 2050
100
150
200
250
300
350
400
450
500
Events / 25 GeV 1 10 2 10 3 10 4 10 5 10 6 10 7 10 Data W+jets Z+jets Multijet Diboson t t Single top = 700 GeV Q Signal, m Uncertainty ATLAS 4 jets ≥ + µ preselection -1 = 8 TeV, 20.3 fb s [GeV] T miss E 0 50 100 150 200 250 300 350 400 450 500 Sig. -2 0 2Figure 6: Distributions of the missing transverse momentum after the ptruth
T (V) correction and final normalization
for the (left) electron and (right) muon channels. All overflows are included in the rightmost bin. The shaded band shows the total uncertainty on the background prediction. The lower panel shows the significance of the difference between data and expectation in units of normal standard deviations.
VR1 is used to verify the modeling of variables other than mreco, such as the HTdistribution and the pT
spectra for the individual objects.
0 200400600800
1000
1200
Events / 50 GeV 1 10 2 10 3 10 4 10 5 10 Data W+jets Z+jets Multijet Diboson t t Single top Uncertainty ATLAS 4 jets ≥ e + VR2 -1 = 8 TeV, 20.3 fb s [GeV] reco m 0 200 400 600 800 1000 1200 Sig. -2 0 20 200400600800
1000
1200
Events / 50 GeV 1 10 2 10 3 10 4 10 5 10 Data W+jets Z+jets Multijet Diboson t t Single top Uncertainty ATLAS 4 jets ≥ + µ VR2 -1 = 8 TeV, 20.3 fb s [GeV] reco m 0 200 400 600 800 1000 1200 Sig. -2 0 2Figure 7: Comparison between data and simulation for the distribution of mreco, the reconstructed heavy quark
mass built from the Whadcandidate and the paired q-jet candidate, in validation region VR2 for the (left) electron
and (right) muon channels. All overflows are included in the rightmost bin. The shaded band shows the total uncertainty on the background prediction. The lower panel shows the significance of the difference between data and expectation in units of normal standard deviations.
0 200400600800
1000
1200
Events / 50 GeV -1 10 1 10 2 10 3 10 4 10 5 10 Data W+jets Z+jets Multijet Diboson t t Single top Uncertainty ATLAS 4 jets ≥ e + VR3 -1 = 8 TeV, 20.3 fb s [GeV] reco m 0 200 400 600 800 1000 1200 Sig. -2 0 20 200400600800
1000
1200
Events / 50 GeV -1 10 1 10 2 10 3 10 4 10 5 10 Data W+jets Z+jets Multijet Diboson t t Single top Uncertainty ATLAS 4 jets ≥ + µ VR3 -1 = 8 TeV, 20.3 fb s [GeV] reco m 0 200 400 600 800 1000 1200 Sig. -2 0 2Figure 8: Comparison between data and simulation for the mrecodistribution in validation region VR3 for the (left)
electron and (right) muon channels. The shaded band shows the total uncertainty on the background prediction. The lower panel shows the significance of the difference between data and expectation in units of normal standard deviations.
6 Systematic uncertainties
The uncertainties considered in this analysis can affect the normalization of signal and background and the shape of the final discriminant, mreco. Each source of systematic uncertainty is assumed to be 100%
cor-related across all samples, but the different sources are treated as uncorrelated with one another. Table3 shows the impact of the dominant uncertainties on the normalization of the background processes and a signal sample with a mass of 700 GeV.
Table 3: Table summarizing the overall normalization changes (expressed in %) in signal and background yields for the dominant systematic uncertainties considered. The selection presented here is the combination of the e+jets and µ+jets channels after the final selection.
Signal (mQ= 700 GeV) Non-W+jets W+jets
Luminosity +2.8/–2.8 +2.8/–2.8 +2.8/–2.8
Normalization ±15 +2.7/–4.4
Lepton identification +1.6/–1.6 +1.5/–1.5 +1.4/–1.4
Jet energy resolution +0.6/–0.6 +12/–12 +8.7/–8.7
Jet energy scale +6.1/–4.3 +33/–34 +14/–18
b-tagging +0.2/–0.2 +5.1/–5.3 +0.3/–0.3
c-tagging +1.5/–1.5 +1.5/–1.5 +1.2/–1.2
Light-jet tagging +1.0/–1.0 +0.9/–0.9 +1.0/–1.0
6.1 Normalization uncertainties
Uncertainties affecting only the normalization include those on the integrated luminosity (±2.8%) and the cross sections for various background processes. The uncertainty on the integrated luminosity is derived following the same methodology as that detailed in Ref. [71]. This uncertainty is applied to all simulated signal and background processes.
After the final selection, the non-W+jets background has a total normalization uncertainty of 15%. The predicted contribution from the multijet background is negligible compared to the uncertainty on the non-W+jets background, so it is neglected.
As described in Sec.5.1, the normalization of the W+jets background is determined from a fit to data using both lepton channels. The uncertainty on the W+jets normalization is determined by comparing that result to the normalization one would obtain if only the electron or only the muon channel were used. This is motivated by the fact that it is not known whether the normalization from the electron channel or the muon channel (or something in between) is correct and this procedure leads to an uncertainty of +2.7/–4.4%. The statistical uncertainty from the fit is negligible (0.03%) in comparison.
The rest of the systematic uncertainties can modify both the normalization and shape of the mreco
distri-bution.
6.2 Shape uncertainties
Uncertainties on the trigger, reconstruction, and isolation efficiencies for the selected lepton are estim-ated using Z → ee and Z → µµ events [72, 73]. In addition, high jet-multiplicity Z → `` events are studied, from which extra uncertainties on the isolation efficiency are assigned to account for the differ-ence between Z boson and t¯t events. Uncertainties on the ETmissreconstruction and the energy scale and resolution of the leptons were also considered; however, these have a very small impact on the results. The jet energy resolution is measured by studying dijet events in data and simulation. The simulation is found to agree with data to better than 10% [74]. The differences in resolutions between data and simu-lations are used to determine the relative systematic uncertainty. The uncertainty on the jet energy scale is evaluated by repeating the analysis with the jet energy scale shifted by ±1σ [64,66]. The jet recon-struction efficiency is estimated using track-based jets and is well described in simulation. To account for differences in the efficiency for reconstructing jets in simulated events compared to collider data, the efficiencies are measured in both samples and the difference is taken as the uncertainty. The uncertainty due to the JVF requirement is evaluated by comparing the signal and background distributions with the JVF cut shifted up and down by 10%, a variation that spans the difference observed between data and simulation in this quantity. The b-tagging efficiency for b-jets, as well as c-jets and light jets, is derived in data and a simulated t¯t sample, parameterized as a function of pT and η [67,75]. The corresponding
(in)efficiencies in the simulated samples are corrected to match those in data and the uncertainties from the calibration are propagated through the analysis.
The W+jets sample is assigned a ptruth
T (V)-dependent shape uncertainty due to the correction described in
Sec.5.1. Four sources of uncertainty on the ptruthT (V) correction are considered: (1) the statistical
uncer-tainty on the parameters of the reweighting function; (2) the difference between the nominal reweighting function and alternative corrections obtained by only considering the electron or muon channel; (3) the dependence of the fit on the choice of bin width when deriving the reweighting function; (4) the difference
between alternative parameterizations of the reweighting function. A closure test is performed to verify that any residual differences between data and prediction are well within the assigned uncertainty.
7 Results
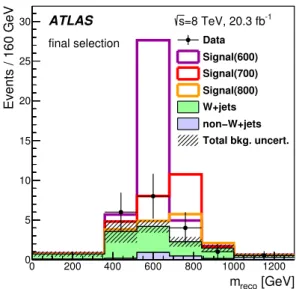
The final mreco distribution for the combined electron and muon channels is shown in Fig. 9 for three
signal scenarios: mQ= 600 GeV, mQ= 700 GeV, and mQ= 800 GeV. The observed distribution shows a
slight excess over the SM expectation, but the excess is broader than expected for signal and is consistent with the background-only prediction at the level of two standard deviations. Therefore, the analysis proceeds to setting limits on the signal hypothesis.
The mreco distribution for the combined electron and muon channels after the final selection (Fig. 9)
is used to derive 95% confidence level (CL) limits on the Q ¯Qproduction cross section using the CLs
method [76,77]. [GeV] reco m 0 200 400 600 800 1000 1200 Events / 160 GeV 0 5 10 15 20 25 30 Data Signal(600) Signal(700) Signal(800) W+jets non−W+jets Total bkg. uncert. ATLAS s=8 TeV, 20.3 fb-1 final selection
Figure 9: Distribution of the final discriminant, the mass of the hadronically decaying heavy quark candidate, with the bin widths chosen as for the statistical analysis. The expected contribution from signal with BR(Q → Wq)=1 is shown stacked on top of the total background prediction for three mass scenarios, mQ= 600, 700, and 800 GeV. The
backgrounds are stacked with the largest on top. The shaded band shows the total uncertainty on the background prediction.
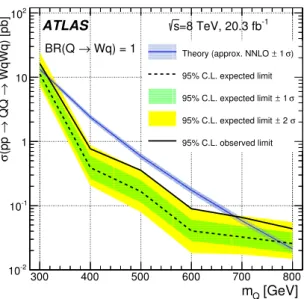
Limits on the pair production of new chiral quarks are evaluated by setting BR(Q → Wq) = 1. Fig-ure10shows the observed and expected limits on a heavy chiral quark as a function of mQ, compared
to the theoretical prediction [33–38]. The total uncertainty on the theoretical cross section includes the contributions from the scale variations and PDF uncertainties. Using the central value of the theoretical cross section, the observed (expected) 95% CL limit on the mass of a new chiral quark is mQ> 690 GeV
(780 GeV). This represents the most stringent limit to date on the mass of a new quark decaying exclus-ively into a W boson and a light quark (u, d, s). This limit is also applicable to the production of pairs of
300 400 500 600 700 800 -2 10 -1 10 1 10 2 10 [GeV] Q m WqWq) [pb] → Q Q → (pp σ ATLAS Wq) = 1 → BR(Q -1 =8 TeV, 20.3 fb s ) σ 1 ± Theory (approx. NNLO
95% C.L. expected limit σ 1 ± 95% C.L. expected limit σ 2 ± 95% C.L. expected limit 95% C.L. observed limit
Figure 10: The expected (black dashed line) and observed (black solid line) 95% CL upper limits on the cross section as a function of mQwhen setting BR(Q → Wq)= 1, which would be the case for a new chiral quark. The
green and yellow shaded bands indicate the ±1σ and ±2σ intervals on the distribution of expected results for the chiral model if no signal exists. The blue line is the theoretical prediction for the total cross section [i.e., assuming BR(Q → Wq)= 1] with its uncertainties.
down-type vectorlike quarks with electric charge of −4/3 which each decay into a W boson and a light quark (d, s).
Next, the VLQ signal samples are used to set limits on the mass of a heavy quark that decays to a light quark (u, d, s) and either a W, Z, or H boson. The results are given as a function of the branching ratios BR(Q → Wq) versus BR(Q → Hq), with the branching ratio to Zq fixed by the requirement BR(Q → Zq) = 1 − BR(Q → Wq) − BR(Q → Hq). The analysis loses sensitivity at low masses due to the tight selection requirements optimized for the decay Q → Wq, so the results are presented as the upper and lower bounds on the mass range that is excluded at 95% CL. The expected limits on mQas a
function of the branching ratios are shown in Fig.11and the observed limits are shown in Fig.12. For example, for the branching ratios BR(Q → Wq) = 0.6, BR(Q → Zq) = 0.4, and BR(Q → Hq) = 0, the results exclude VLQs with a mass from 370 GeV to 610 GeV. If no signal is present, the median expected exclusion range for that set of branching ratios is 340 GeV to 690 GeV. For BR(Q → Wq)= 0.6, BR(Q → Zq) = 0.3, and BR(Q → Hq) = 0.1, the results exclude VLQs with a mass from 370 GeV to 470 GeV, while the median expected exclusion range is 340 GeV to 680 GeV. For BR(Q → Wq) = 0.5, BR(Q → Zq) = 0.25, and BR(Q → Hq) = 0.25, the results exclude VLQs with a mass from 390 GeV to 410 GeV, while the median expected exclusion range is 360 GeV to 650 GeV.
Wq) → BR (Q 0 0.1 0.2 0.3 0.4 0.5 0.6 0.7 0.8 0.9 1 Hq) → BR (Q 0.1 0.2 0.3 0.4 0.5 0.6 0.7 0.8 0.9 1
Expected 95% CL mass limit [GeV]
300 350 400 450 500 550 600 650 700 750 800 ATLAS -1 = 8TeV, 20.3 fb s
Expected upper bound of excluded mass range
700 650 600 Wq) → BR (Q 0 0.1 0.2 0.3 0.4 0.5 0.6 0.7 0.8 0.9 1 Hq) → BR (Q 0.1 0.2 0.3 0.4 0.5 0.6 0.7 0.8 0.9 1
Expected 95% CL mass limit [GeV]
300 350 400 450 500 550 600 650 700 750 800 ATLAS -1 = 8TeV, 20.3 fb s
Expected lower bound of excluded mass range
350
400
500
Figure 11: The (left) upper and (right) lower bounds on the range of heavy quark masses expected to be excluded at 95% CL, as a function of the branching ratio of the heavy quark to Wq versus Hq, with the branching ratio to Zqfixed by the requirement BR(Q → Zq)= 1 − BR(Q → Wq) − BR(Q → Hq). The region above the diagonal is forbidden by unitarity. Wq) → BR (Q 0 0.1 0.2 0.3 0.4 0.5 0.6 0.7 0.8 0.9 1 Hq) → BR (Q 0.1 0.2 0.3 0.4 0.5 0.6 0.7 0.8 0.9 1
Observed 95% CL mass limit [GeV]
300 350 400 450 500 550 600 650 700 750 800 ATLAS -1 = 8TeV, 20.3 fb s
Observed upper bound of excluded mass range
600 500 450 400 Wq) → BR (Q 0 0.1 0.2 0.3 0.4 0.5 0.6 0.7 0.8 0.9 1 Hq) → BR (Q 0.1 0.2 0.3 0.4 0.5 0.6 0.7 0.8 0.9 1
Observed 95% CL mass limit [GeV]
300 350 400 450 500 550 600 650 700 750 800 ATLAS -1 = 8TeV, 20.3 fb s
Observed lower bound of excluded mass range
350
400
Figure 12: The (left) upper and (right) lower bounds on the range of heavy quark masses observed to be excluded at 95% CL, as a function of the branching ratio of the heavy quark to Wq versus Hq, with the branching ratio to Zqfixed by the requirement BR(Q → Zq)= 1 − BR(Q → Wq) − BR(Q → Hq). The region above the diagonal is forbidden by unitarity.
8 Conclusion
A search for new heavy quarks that decay to a W boson and a light quark (u, d, s) is performed with a dataset corresponding to 20.3 fb−1that was collected by the ATLAS detector at the LHC in pp collisions at √s = 8 TeV. No significant evidence of a heavy quark signal is observed when selecting events with one charged lepton, large EmissT , and four non-b-tagged jets. The results exclude new heavy chiral quarks with masses up to 690 GeV at 95% CL. This search is also interpreted in the context of vectorlike quark models, for which the new heavy quark can decay to a light quark and either a W, Z, or H boson. New
exclusions limits are presented in the two-dimensional plane of BR(Q → Wq) versus BR(Q → Hq).
9 Acknowledgements
We thank CERN for the very successful operation of the LHC, as well as the support staff from our institutions without whom ATLAS could not be operated efficiently.
We acknowledge the support of ANPCyT, Argentina; YerPhI, Armenia; ARC, Australia; BMWFW and FWF, Austria; ANAS, Azerbaijan; SSTC, Belarus; CNPq and FAPESP, Brazil; NSERC, NRC and CFI, Canada; CERN; CONICYT, Chile; CAS, MOST and NSFC, China; COLCIENCIAS, Colombia; MSMT CR, MPO CR and VSC CR, Czech Republic; DNRF, DNSRC and Lundbeck Foundation, Denmark; EPLANET, ERC and NSRF, European Union; IN2P3-CNRS, CEA-DSM/IRFU, France; GNSF, Geor-gia; BMBF, DFG, HGF, MPG and AvH Foundation, Germany; GSRT and NSRF, Greece; RGC, Hong Kong SAR, China; ISF, MINERVA, GIF, I-CORE and Benoziyo Center, Israel; INFN, Italy; MEXT and JSPS, Japan; CNRST, Morocco; FOM and NWO, Netherlands; BRF and RCN, Norway; MNiSW and NCN, Poland; GRICES and FCT, Portugal; MNE/IFA, Romania; MES of Russia and NRC KI, Rus-sian Federation; JINR; MSTD, Serbia; MSSR, Slovakia; ARRS and MIZŠ, Slovenia; DST/NRF, South Africa; MINECO, Spain; SRC and Wallenberg Foundation, Sweden; SER, SNSF and Cantons of Bern and Geneva, Switzerland; NSC, Taiwan; TAEK, Turkey; STFC, the Royal Society and Leverhulme Trust, United Kingdom; DOE and NSF, United States of America.
The crucial computing support from all WLCG partners is acknowledged gratefully, in particular from CERN and the ATLAS Tier-1 facilities at TRIUMF (Canada), NDGF (Denmark, Norway, Sweden), CC-IN2P3 (France), KIT/GridKA (Germany), INFN-CNAF (Italy), NL-T1 (Netherlands), PIC (Spain), ASGC (Taiwan), RAL (UK) and BNL (USA) and in the Tier-2 facilities worldwide.
References
[1] ATLAS Collaboration, Observation of a new particle in the search for the Standard Model Higgs boson with the ATLAS detector at the LHC, Phys.Lett. B716 (2012) 1–29.
[2] CMS Collaboration,
Observation of a new boson at a mass of 125 GeV with the CMS experiment at the LHC, Phys.Lett. B716 (2012) 30–61.
[3] L. Susskind, Dynamics of Spontaneous Symmetry Breaking in the Weinberg-Salam Theory, Phys.Rev. D20 (1979) 2619–2625.
[4] S. Dimopoulos and H. Georgi, Softly Broken Supersymmetry and SU(5), Nucl.Phys. B193 (1981) 150.
[5] N. Arkani-Hamed et al., The Littlest Higgs, JHEP 07 (2002) 034.
[6] R. Contino, Y. Nomura and A. Pomarol, Higgs as a holographic pseudoGoldstone boson, Nucl.Phys. B671 (2003) 148–174.
[7] B. A. Dobrescu and C. T. Hill, Electroweak symmetry breaking via top condensation seesaw, Phys.Rev.Lett. 81 (1998) 2634–2637.
[8] C. T. Hill, Topcolor assisted technicolor, Phys.Lett. B345 (1995) 483–489.
[9] C. T. Hill and E. H. Simmons, Strong dynamics and electroweak symmetry breaking, Phys.Rept. 381 (2003) 235–402.
[10] J. Kang, P. Langacker and B. D. Nelson,
Theory and Phenomenology of Exotic Isosinglet Quarks and Squarks, Phys.Rev. D77 (2008) 035003.
[11] S. Sultansoy and G. Unel, The E6inspired isosinglet quark and the Higgs boson,
Phys.Lett. B669 (2008) 39–45.
[12] K. S. Babu and R. N. Mohapatra, Solution to the strong CP problem without an axion, Phys. Rev. D 41 (1990) 1286–1291.
[13] D. Guadagnoli, R. N. Mohapatra and I. Sung, Gauged Flavor Group with Left-Right Symmetry, JHEP 1104 (2011) 093.
[14] S. P. Martin and J. D. Wells, Implications of gauge-mediated supersymmetry breaking with vector-like quarks and a 125 GeV Higgs boson, Phys.Rev. D86 (2012) 035017.
[15] A. Djouadi and A. Lenz, Sealing the fate of a fourth generation of fermions, Phys.Lett. B715 (2012) 310–314.
[16] S. Bar-Shalom et al., Two Higgs doublets, a 4th generation and a 125 GeV Higgs: A review., Adv.High Energy Phys. 2013 (2013) 672972.
[17] S. Chakdar et al.,
Collider signatures of mirror fermions in the framework of a left-right mirror model, Phys.Rev. D88 (2013) 095005.
[18] ATLAS Collaboration, Search for pair-produced heavy quarks decaying to Wq in the two-lepton channel at √s= 7 TeV with the ATLAS detector, Phys.Rev. D86 (2012) 012007.
[19] ATLAS Collaboration, Search for heavy vector-like quarks coupling to light quarks in
proton-proton collisions at √s= 7 TeV with the ATLAS detector, Phys.Lett. B712 (2012) 22–39. [20] T. Aaltonen et al. (CDF Collaboration),
Search for a Heavy Top-Like Quark in p¯p Collisions at √s= 1.96 TeV, Phys.Rev.Lett. 107 (2011) 261801.
[21] ATLAS Collaboration, Search for production of vector-like quark pairs and of four top quarks in the lepton-plus-jets final state in pp collisions at √s= 8 TeV with the ATLAS detector,
Submitted to JHEP(2015), arXiv:1505.04306 [hep-ex].
[22] ATLAS Collaboration, Search for pair and single production of new heavy quarks that decay to a Z boson and a third-generation quark in pp collisions at √s= 8 TeV with the ATLAS detector, JHEP 1411 (2014) 104.
[23] ATLAS Collaboration, Search for vectorlike B quarks in events with one isolated lepton, missing transverse momentum and jets at √s= 8 TeV with the ATLAS detector,
Phys.Rev. D91 (2015) 112011.
[24] ATLAS Collaboration, Analysis of events with b-jets and a pair of leptons of the same charge in pp collisions at √s= 8 TeV with the ATLAS detector, Submitted to JHEP (2015),
arXiv:1504.04605 [hep-ex].
[25] CMS Collaboration, Search for pair produced fourth-generation up-type quarks in pp collisions at √s= 7 TeV with a lepton in the final state, Phys.Lett. B718 (2012) 307–328.
[26] CMS Collaboration, Search for heavy, top-like quark pair production in the dilepton final state in pp collisions at √s= 7 TeV, Phys.Lett. B716 (2012) 103–121.
[27] CMS Collaboration, Search for heavy quarks decaying into a top quark and a W or Z boson using lepton+ jets events in pp collisions at √s= 7 TeV, JHEP 1301 (2013) 154.
[28] CMS Collaboration,
Search for a Vector-like Quark with Charge 2/3 in t + Z Events from pp Collisions at √s= 7 TeV, Phys.Rev.Lett. 107 (2011) 271802.
[29] J. M. Butterworth, B. Cox and J. R. Forshaw, WW scattering at the CERN LHC, Phys.Rev. D65 (2002) 096014.
[30] J. M. Butterworth et al., Jet substructure as a new Higgs search channel at the LHC, Phys.Rev.Lett. 100 (2008) 242001.
[31] ATLAS Collaboration, The ATLAS Experiment at the CERN Large Hadron Collider, JINST 3 (2008) S08003.
[32] ATLAS Collaboration, Performance of the ATLAS Trigger System in 2010, Eur. Phys. J. C72 (2012) 1849.
[33] P. Bärnreuther, M. Czakon and A. Mitov, Percent Level Precision Physics at the Tevatron: First Genuine NNLO QCD Corrections to q¯q → t¯t+ X, Phys.Rev.Lett. 109 (2012) 132001.
[34] M. Czakon and A. Mitov, NNLO corrections to top-pair production at hadron colliders: the all-fermionic scattering channels, JHEP 1212 (2012) 054.
[35] M. Czakon and A. Mitov,
NNLO corrections to top pair production at hadron colliders: the quark-gluon reaction, JHEP 1301 (2013) 080.
[36] M. Czakon, P. Fiedler and A. Mitov,
Total Top-Quark Pair-Production Cross Section at Hadron Colliders Through O(α4S), Phys.Rev.Lett. 110.25 (2013) 252004.
[37] M. Cacciari et al., Top-pair production at hadron colliders with next-to-next-to-leading logarithmic soft-gluon resummation, Phys.Lett. B710 (2012) 612–622.
[38] M. Czakon and A. Mitov,
Top++: A Program for the Calculation of the Top-Pair Cross-Section at Hadron Colliders, Comput.Phys.Commun. 185 (2014) 2930.
[39] A. Martin et al., Parton distributions for the LHC, Eur.Phys.J. C63 (2009) 189–285.
[40] A. Martin et al., Uncertainties on αS in global PDF analyses and implications for predicted
hadronic cross sections, Eur.Phys.J. C64 (2009) 653–680.
[41] M. Botje et al., The PDF4LHC Working Group Interim Recommendations (2011), arXiv:1101.0538 [hep-ph].
[42] H.-L. Lai et al., New parton distributions for collider physics, Phys.Rev. D82 (2010) 074024. [43] R. D. Ball et al., Parton distributions with LHC data, Nucl.Phys. B867 (2013) 244–289. [44] E. Boos et al. (CompHEP Collaboration),
CompHEP 4.4: Automatic computations from Lagrangians to events, Nucl.Instrum.Meth. A534 (2004) 250–259.
[45] P. M. Nadolsky et al., Implications of CTEQ global analysis for collider observables, Phys.Rev. D78 (2008) 013004.
[46] T. Sjöstrand, S. Mrenna and P. Z. Skands, A Brief Introduction to PYTHIA 8.1, Comput.Phys.Commun. 178 (2008) 852–867.
[47] T. Sjöstrand, S. Mrenna and P. Z. Skands, PYTHIA 6.4 Physics and Manual, JHEP 0605 (2006) 026.
[48] T. Gleisberg et al., Event generation with SHERPA 1.1, JHEP 0902 (2009) 007. [49] S. Frixione, P. Nason and C. Oleari,
Matching NLO QCD computations with Parton Shower simulations: the POWHEG method, JHEP 0711 (2007) 070.
[50] S. Alioli et al., A general framework for implementing NLO calculations in shower Monte Carlo programs: the POWHEG BOX, JHEP 1006 (2010) 043.
[51] P. Z. Skands, Tuning Monte Carlo Generators: The Perugia Tunes, Phys.Rev. D82 (2010) 074018. [52] M. L. Mangano et al.,
ALPGEN, a generator for hard multiparton processes in hadronic collisions, JHEP 07 (2003) 001.
[53] G. Corcella et al., HERWIG 6: An Event generator for hadron emission reactions with interfering gluons (including supersymmetric processes), JHEP 0101 (2001) 010.
[54] ATLAS Collaboration, Estimation of non-prompt and fake lepton backgrounds in final states with top quarks produced in proton-proton collisions at √s= 8 TeV with the ATLAS detector,
ATLAS-CONF-2014-058 (2014), eprint:https://cds.cern.ch/record/1951336. [55] N. Kidonakis, Next-to-next-to-leading-order collinear and soft gluon corrections for t-channel
single top quark production, Phys.Rev. D83 (2011) 091503. [56] N. Kidonakis,
Two-loop soft anomalous dimensions for single top quark associated production with a W−or H−, Phys.Rev. D82 (2010) 054018.
[57] N. Kidonakis, NNLL resummation for s-channel single top quark production, Phys.Rev. D81 (2010) 054028.
[58] J. M. Campbell and R. K. Ellis, An Update on vector boson pair production at hadron colliders, Phys.Rev. D60 (1999) 113006.
[59] ATLAS Collaboration, The ATLAS Simulation Infrastructure, Eur.Phys.J. C70 (2010) 823–874. [60] S. Agostinelli et al. (GEANT4 Collaboration), GEANT4: A Simulation toolkit,
Nucl.Instrum.Meth. A506 (2003) 250–303.
[61] ATLAS Collaboration, Measurement of the top pair production cross section in 8 TeV
proton-proton collisions using kinematic information in the lepton+jets final state with ATLAS, Phys.Rev. D91 (2015) 112013.
[62] K. Rehermann and B. Tweedie,
Efficient Identification of Boosted Semileptonic Top Quarks at the LHC, JHEP 1103 (2011) 059. [63] M. Cacciari, G. P. Salam and G. Soyez, The anti-ktjet clustering algorithm,
[64] ATLAS Collaboration, Jet energy measurement and its systematic uncertainty in proton-proton collisions at √s= 7 TeV with the ATLAS detector, Eur.Phys.J. C75 (2015) 17.
[65] ATLAS Collaboration, Local hadronic calibration, ATL-LARG-PUB-2009-001-2 (2009), eprint:https://cds.cern.ch/record/1112035.
[66] ATLAS Collaboration,
Jet energy measurement with the ATLAS detector in proton-proton collisions at √s= 7 TeV, Eur.Phys.J. C73 (2013) 2304.
[67] ATLAS Collaboration,
Calibration of the performance of b-tagging for c and light-flavour jets in the 2012 ATLAS data, ATLAS-CONF-2014-046 (2014), eprint:http://cds.cern.ch/record/1741020.
[68] ATLAS Collaboration, Performance of Missing Transverse Momentum Reconstruction in Proton-Proton Collisions at 7 TeV with ATLAS, Eur.Phys.J. C72 (2012) 1844.
[69] K.A. Olive et al. (Particle Data Group Collaboration), Review of Particle Physics, Chin.Phys. C38 (2014) 090001.
[70] G. Choudalakis and D. Casadei, Plotting the differences between data and expectation, The European Physical Journal Plus 127.2 (2012) 1–11.
[71] ATLAS Collaboration, Improved luminosity determination in pp collisions at √s= 7 TeV using the ATLAS detector at the LHC, Eur.Phys.J. C73 (2013) 2518.
[72] ATLAS Collaboration, Measurement of the muon reconstruction performance of the ATLAS detector using 2011 and 2012 LHC proton-proton collision data, Eur.Phys.J. C74 (2014) 3130. [73] ATLAS Collaboration,
Electron and photon energy calibration with the ATLAS detector using LHC Run 1 data, Eur.Phys.J. C74 (2014) 3071.
[74] ATLAS Collaboration, Jet energy resolution in proton-proton collisions at √s= 7 TeV recorded in 2010 with the ATLAS detector, Eur.Phys.J. C73 (2013) 2306.
[75] ATLAS Collaboration, Calibration of b-tagging using dileptonic top pair events in a
combinatorial likelihood approach with the ATLAS experiment, ATLAS-CONF-2014-004 (2014), eprint:https://cds.cern.ch/record/1664335.
[76] T. Junk, Confidence level computation for combining searches with small statistics, Nucl.Instrum.Meth. A434 (1999) 435–443.
The ATLAS Collaboration
G. Aad85, B. Abbott113, J. Abdallah151, O. Abdinov11, R. Aben107, M. Abolins90, O.S. AbouZeid158, H. Abramowicz153, H. Abreu152, R. Abreu116, Y. Abulaiti146a,146b, B.S. Acharya164a,164b,a,
L. Adamczyk38a, D.L. Adams25, J. Adelman108, S. Adomeit100, T. Adye131, A.A. Affolder74, T. Agatonovic-Jovin13, J. Agricola54, J.A. Aguilar-Saavedra126a,126f, S.P. Ahlen22, F. Ahmadov65,b, G. Aielli133a,133b, H. Akerstedt146a,146b, T.P.A. Åkesson81, A.V. Akimov96, G.L. Alberghi20a,20b, J. Albert169, S. Albrand55, M.J. Alconada Verzini71, M. Aleksa30, I.N. Aleksandrov65, C. Alexa26b, G. Alexander153, T. Alexopoulos10, M. Alhroob113, G. Alimonti91a, L. Alio85, J. Alison31, S.P. Alkire35, B.M.M. Allbrooke149, P.P. Allport18, A. Aloisio104a,104b, A. Alonso36, F. Alonso71, C. Alpigiani138, A. Altheimer35, B. Alvarez Gonzalez30, D. Álvarez Piqueras167, M.G. Alviggi104a,104b, B.T. Amadio15,
K. Amako66, Y. Amaral Coutinho24a, C. Amelung23, D. Amidei89, S.P. Amor Dos Santos126a,126c, A. Amorim126a,126b, S. Amoroso48, N. Amram153, G. Amundsen23, C. Anastopoulos139, L.S. Ancu49, N. Andari108, T. Andeen35, C.F. Anders58b, G. Anders30, J.K. Anders74, K.J. Anderson31,
A. Andreazza91a,91b, V. Andrei58a, S. Angelidakis9, I. Angelozzi107, P. Anger44, A. Angerami35, F. Anghinolfi30, A.V. Anisenkov109,c, N. Anjos12, A. Annovi124a,124b, M. Antonelli47, A. Antonov98, J. Antos144b, F. Anulli132a, M. Aoki66, L. Aperio Bella18, G. Arabidze90, Y. Arai66, J.P. Araque126a, A.T.H. Arce45, F.A. Arduh71, J-F. Arguin95, S. Argyropoulos63, M. Arik19a, A.J. Armbruster30, O. Arnaez30, H. Arnold48, M. Arratia28, O. Arslan21, A. Artamonov97, G. Artoni23, S. Asai155, N. Asbah42, A. Ashkenazi153, B. Åsman146a,146b, L. Asquith149, K. Assamagan25, R. Astalos144a, M. Atkinson165, N.B. Atlay141, K. Augsten128, M. Aurousseau145b, G. Avolio30, B. Axen15, M.K. Ayoub117, G. Azuelos95,d, M.A. Baak30, A.E. Baas58a, M.J. Baca18, C. Bacci134a,134b,
H. Bachacou136, K. Bachas154, M. Backes30, M. Backhaus30, P. Bagiacchi132a,132b, P. Bagnaia132a,132b, Y. Bai33a, T. Bain35, J.T. Baines131, O.K. Baker176, E.M. Baldin109,c, P. Balek129, T. Balestri148, F. Balli84, W.K. Balunas122, E. Banas39, Sw. Banerjee173, A.A.E. Bannoura175, L. Barak30,
E.L. Barberio88, D. Barberis50a,50b, M. Barbero85, T. Barillari101, M. Barisonzi164a,164b, T. Barklow143, N. Barlow28, S.L. Barnes84, B.M. Barnett131, R.M. Barnett15, Z. Barnovska5, A. Baroncelli134a, G. Barone23, A.J. Barr120, F. Barreiro82, J. Barreiro Guimarães da Costa57, R. Bartoldus143,
A.E. Barton72, P. Bartos144a, A. Basalaev123, A. Bassalat117, A. Basye165, R.L. Bates53, S.J. Batista158, J.R. Batley28, M. Battaglia137, M. Bauce132a,132b, F. Bauer136, H.S. Bawa143,e, J.B. Beacham111, M.D. Beattie72, T. Beau80, P.H. Beauchemin161, R. Beccherle124a,124b, P. Bechtle21, H.P. Beck17, f, K. Becker120, M. Becker83, M. Beckingham170, C. Becot117, A.J. Beddall19b, A. Beddall19b, V.A. Bednyakov65, C.P. Bee148, L.J. Beemster107, T.A. Beermann30, M. Begel25, J.K. Behr120,
C. Belanger-Champagne87, W.H. Bell49, G. Bella153, L. Bellagamba20a, A. Bellerive29, M. Bellomo86, K. Belotskiy98, O. Beltramello30, O. Benary153, D. Benchekroun135a, M. Bender100, K. Bendtz146a,146b, N. Benekos10, Y. Benhammou153, E. Benhar Noccioli49, J.A. Benitez Garcia159b, D.P. Benjamin45, J.R. Bensinger23, S. Bentvelsen107, L. Beresford120, M. Beretta47, D. Berge107,
E. Bergeaas Kuutmann166, N. Berger5, F. Berghaus169, J. Beringer15, C. Bernard22, N.R. Bernard86, C. Bernius110, F.U. Bernlochner21, T. Berry77, P. Berta129, C. Bertella83, G. Bertoli146a,146b,
F. Bertolucci124a,124b, C. Bertsche113, D. Bertsche113, M.I. Besana91a, G.J. Besjes36, O. Bessidskaia Bylund146a,146b, M. Bessner42, N. Besson136, C. Betancourt48, S. Bethke101, A.J. Bevan76, W. Bhimji15, R.M. Bianchi125, L. Bianchini23, M. Bianco30, O. Biebel100,
D. Biedermann16, S.P. Bieniek78, N.V. Biesuz124a,124b, M. Biglietti134a, J. Bilbao De Mendizabal49, H. Bilokon47, M. Bindi54, S. Binet117, A. Bingul19b, C. Bini132a,132b, S. Biondi20a,20b, D.M. Bjergaard45, C.W. Black150, J.E. Black143, K.M. Black22, D. Blackburn138, R.E. Blair6, J.-B. Blanchard136,