A Work Project, presented as part of the requirements for the Award of a Masters Degree in Economics from the NOVA – School of Business and Economics.
Active Ageing Index and
Quality of Life
Joana Cruz Ferreira Nunes #570
Masters in Economics
A Project carried out on the area of Applied Policy Analysis under the supervision of Professor Pedro Pita Barros.
ABSTRACT
Objectives: This work project can be divided into 2 parts. The first one is intended to compute Active Ageing Index (AAI) for 16 European Countries and for Lisbon and the second one to study the association of AAI and Quality of Life (QOL) indicators. It also aims at verifying whether the elements that compose AAI, domains or indicators, are also elements that define one’s Life Satisfaction or Life Happiness.
Methods: The computation of the index closely follows the original methodology of AAI. The study of the association of AAI and QOL variables is performed by computing AAI at an individual level and by considering the estimations of consecutive Ordered Probit Models. Results: Sweden, Denmark and Switzerland are the frontrunners at actively ageing, among the sample; while Portugal, Hungary and Poland fare the worst. Lisbon faces a smaller untapped potential to Active Ageing (59,41%) than the whole country (65,91%). Additionally, one can consistently conclude that the overall AAI, and its 1st, 2nd and 4th domains are positively associated with QOL indicators. The 3rd domain- Independent, Secure and Healthy Living, specifically the indicator that considers the livelihood in a single or double household, is negatively associated with life satisfaction and life happiness. These results not only represent a paradox, but they also suggest a revision on the construction of the 3rd domain of AAI. Key-words: Active Ageing, Weighted-Average Indices, Quality of Life.
1. INTRODUCTION
According to Eurostat yearbook 2010 forecasts, age pyramids of developed countries are to be shaped in a very different way by 2050.1 The narrowing of both medium and bottom parcels and the enlargement of the top of pyramids has already been evident in EU’s countries. This phenomenon is named Population Ageing and has been triggered by the rise of life expectancy,the low fertility rates and the arrival of the baby boom generation to retirement age. 2
1 A more interested reader may refer to “Annex A - Moving Age Pyramids, EU-27” 2 Baby Boom regards
Eurostat has also advanced striking facts about EU-27 population’s future. It has predicted that the fastest growing age group will be that referring to people aged over 80 years; that the ratio of working-age population to those aged over 65 will decrease from 4:1 in 2008 to less than 2:1 by 2060; and that population aged over 65 will account for 30.0 % of the EU-27’s population by 2060, compared with a 17.0 % in 2008. All of these figures will bring remarkable changes, as they disturb labor market performance, pension and health systems provision, public goods’ availability and public finances’ sustainability. Other social consequences will also be set in motion in family structure and in international flows of people and capitals. Henceforth, an urge to acknowledge such demographic shift, to anticipate its impacts and to overcome its challenges has emerged.
EU has already started tackling the problem. Most of proposed policy responses have pointed towards promoting employment, encouraging productivity, stimulating demographic renewal, improving the integration of migrants or guaranteeing the sustainability of public finances. Besides them, policies aimed at fully realize the potential of newly shaped societies have also been addressed; the concept of Active Ageing emerges on this grounding. Active Ageing has been considered as a powerful instrument that will help tackling the consequences of Population Ageing. It combines multidisciplinary requirements and forms of mobilizing all the available human resources towards maximizing the older’s participation in society and their contribution to the economy. Resultantly, EC has ordered the development of AAI. This index is an evidence-gathering tool aimed at assessing the countries’ experiences on ageing and at measuring the untapped capacity to improve the older’s quality of life.
are the areas that should attract afterward specific policy actions the most. Lisbon faces a smaller untapped potential to Active Ageing (59,41%) than the whole country (65,91%).
The second part of this work is meant to study the association of AAI and QOL indicators. It assesses whether the elements that compose AAI, domains or indicators, can also be referred as elements that define Life Satisfaction or Life Happiness. Estimations reveal a great paradox. While the overall AAI, and its Employment, Participation in Society and Capacity and Enabling Environment domains are positively associated with QOL indicators - meaning that they are also elements that define QOL; the 3rd domain – Independent, Secure and Healthy Living, is negatively associated with the same indicators. The breakdown of this domain into its indicators illustrates some data limitations and thus some incapacity to consistently assess the full domain’s scope. However, it can be concluded that the indicator that considers the livelihood in a single or double household is at the origin of the negative relation between 3rd domain and QOL indicators. These results suggest a revision of AAI construction, attending a special care to the composition of the 3rd domain.
This study is organized as follows. Section 2 presents a literature review on the development of Active Ageing concept and on the construction of similar indices. The description of the data and methodology is addressed in Section 3. Section 4 contains the results derived from the computation of AAI at an aggregate level and from the empirical estimations that associate AAI and the QOL indicators. Finally, section 5 concludes the work.
2.LITERATURE REVIEW
Due to the shortage of literature on AAI, this work project has been backed up with research on the conceptualization of Active Ageing and on the construction of similar Weighted Average Indices.
the complexity of the matter, they all fail to completely assess the wide-ranging Active Ageing outcomes (Zaidi et al, 2013).
It was the Commission of the European Communities that firstly defined the concept of Active Ageing. In their view, “Active Ageing is about adjusting our life practices to the fact that we live longer and are more resourceful and in better health than ever before, and about seizing the opportunities offered by these improvements. In practice, it means adopting healthy life styles, working longer, retiring later and being active after retirement”(COM, 1999).
Since then, several international organizations have been proclaiming Active Ageing’s virtues. World Health Organization (WHO) has postulated a definition that has become the most widely used.3 Such definition is a policy-oriented approach based on 3 domains: the labor market engagement, the participation in unpaid productive activities, as well as the maintenance of a good health status, for both physical and mental spheres. OECD takes a narrower view. 4 Its conceptualization diverges from the one postulated by WHO in 2 main points. Firstly, it is focused on the specific transition period from labor market to retirement, rather than considering a life course approach. Secondly, it delivers a bigger responsibility to individuals, highlighting their autonomous choices and constraining the actions of policy makers (Christensen et al., 2003).
Beyond the postulation of the concept, EU has been very participative in addressing the demographic occurrences. Indeed, it has been launching multiple events to raise the awareness of the Population Ageing phenomenon and engaging in studies to better anticipate and cope with the challenges.5 By May 2012, EC has recognized the need to gather robust evidence to help on formulating and on implementing policies aimed at improving the quality of life of the older and at renovating the foundations of social welfare systems. Therefore, the United Nations Economic Commission for Europe’s Active Ageing Group was gathered to create AAI. 6 This index is the materialization of the concept of Active Ageing; it is meant to
3 “Active Ageing is the process of optimizing opportunities for health, participation and security in order to enhance quality of life as people age” (WHO, 2002)
4 “Active Ageing is the capacity of people, as they grow older, to lead productive lives in society and the economy. This means that people can make flexible choices in the way they spend time over life – learning, working, taking part in leisure activities and giving care” (OECD, 2000)
5More on the multiple ageing related events of UNECE and EU in http://www.unece.org/pau/age/welcome.html and in Zaidi et al (2013).
6 Specialists from UNECE, European Commission, OECD, AGE Platform Europe, Eurofound, National agencies, Erasmus University, Oxford Institute of Population
capture the multidimensional aspects of the process and to illustrate how the current demographic shift can be used as a society asset (Zaidi et al, 2013).7
Human Development Index (HDI) has closely inspired the construction of AAI. Actually, since it has been presented in the Human Development Report 1990 (UNDP, 1990), HDI became a reference for both social and economic development. Its breakthrough consisted in the development of a single statistic item that encompasses wide-ranging evidence. HDI is a geometric mean of normalized indices on 3 dimensions:
Life Expectancy, Educational Attainment and Income. Its ultimate goal is to emphasize that people and their capabilities should be the ultimate criteria for assessing the development of a country, instead of economic growth alone. The construction of HDI accounts for 2 stages: the creation of the dimension indices and their subsequent aggregation into the overall index. Along these stages, goalposts are set in order to transform the indicators into indices between 0 and 1- maximum values refer to the highest observed values in a given time series and minimum values are conceived of as subsistence values. The geometric mean of the domain indices is finally computed using equal weights for the 3 domains (UNDP, 2013).
In its turn, AAI has already served as inspiration to other works, such as the construction of a comparable AAI for the US, by AARP International, and the Global AgeWatch Index, by HelpAge International. Global AgeWatch Index ranks countries according to the social and economic wellbeing of older people. It celebrates the world longevity rise and ultimately aims at improving the quality of life and wellbeing of the older. Similarly to AAI, it is designed to stimulate debate among the public and policy-makers on Population Ageing and to improve the formulation of policies. It is a weighted average index, whose domains are: Income Security, Health Status, Employment and Education, and Enabling Environments. The methodology used by this index is the same as the one used in HDI (HelpAge International Report, 2013).
Finally, it is worth pointing out that conclusions derived from both aged related indices have been quite limited. Aside the description of countries performances – both at an overall index and at a domain-specific level, and the assessment of the indices’ correlation with income per capita, inequality indicators and HDI; no
further utility or policy implications have been proposed. Additionally, literature lacks the association of these indices with other variables of interest.
3. DATA & METHODOLOGY
3.1 Data Sources Descriptions
The replication of AAI accounted for 3 data sources. SHARE is the central data source, providing information on 14 out of the 22 indicators that compose AAI and on 2 QOL variables. Remaining data gaps were covered by ESS and, every time data was not accessible in any of these, by Eurostat.8 Before describing the 3 data sources, one should have in mind that they are different in their coverage and content from those used in the original computation of AAI; these divergences will be stressed later.
SHARE, Survey on Health, Ageing and Retirement in Europe, is a multidisciplinary and cross-national panel database of micro data on health, socio-economic status and social and family networks. Its universe includes all persons born in 1960 or earlier having their regular domicile in the respective country, together with their current partners/spouses, independently of age. For the purpose of this work, data used refers to the 4th wave (last wave until recently). It accounts for 55126 surveys administered to individuals aged over 55, from 2010 to 2012, in 16 European countries.9 Individual calibrated weights developed by SHARE were considered in statistical exercises.
ESS, European Social Survey, is also a cross-national panel database of micro data. Its purpose is to describe the changes on public attitudes and values within Europe and to assess its interaction with Europe’s changing institutions. ESS’s universe comprises persons aged 15 and over resident within a private households regardless of their nationality, citizenship, language or legal status. Data used regards ESS 4th round; it includes results from 26692 individual surveys, administered in 14 countries, from 2008 to 2011.10 Again, design and population weights produced by ESS were considered in the computation of AAI.
Eurostat data refers to aggregate data collected and computed from multiple European surveys.11
8 Access to SILC, EHLEIS and LFS has been attempted but put aside for that it involved a longer process than the time affordable by this work project 9 Austria, Belgium, Czech Republic, Denmark, Estonia, France, Germany, Hungary, Italy, Netherlands, Poland, Portugal, Slovenia, Spain, Sweden, and Switzerland
Selected data contemplates information on the same 16 countries covered by SHARE and refers to most recent period available. Note that, on the contrary to SHARE and ESS, which account for individual data, Eurostat provides data at a country level.
3.2 Active Ageing Index
3.2.1 Active Ageing Concept
For the purpose of the index creation, the definition of Active Ageing has further been clarified. The new concept was inspired in the WHO’s work and had to follow the guidelines specified in Conference of Vienna. 12 Thus,“Active Ageing refers to the situation where people continue to 1) participate in the formal labor market, 2) as well as engage in other unpaid productive activities (such as care provision to family members and volunteering), and 3) live healthy, independent and secure lives as they age” (Zaidi et al, 2013). It is important to highlight that the ultimate goal of Active Ageing is to safeguard the quality of life of an ageing population.
3.2.2 Active Ageing Index’s purpose, conceptualization and structure
AAI is an evidence-gathering tool that respects the conceptual framework presented above. It assesses how societies fare in experiencing ageing and measures the untapped capacity of to improve the older’s quality of life. Aimed at ranking countries and sub population groups on the basis of their ageing performance, it is claimed to provide relevant insights for formulating policy advices, to monitor the progress of ageing related projects and to track policy outcomes over the time (Zaidi et al, 2013).
Big challenges arose along the index development, for that simple and easy to read indicators had to be selected. Indicators should translate the postulated definition of Active Ageing and to be shaped according to 2 scopes: 1) The promotion of full participation older people and their actual experience; and 2) The empowerment of the older and their untapped potential (Zaidi et al, 2013). The UNECE group agreed on a precise definition of each indicator and set 10 principles to select them (UNECE, 2012; Zaidi et al, 2013).13
As Table 1 illustrates, 22 indicators that are grouped into 4 different domains compose AAI. The first 3 domains assess its first scope presented above and the last one evaluates the second scope. (Zaidi et al, 2013). The first domain “Employment” measures the contribution of older people to society through paid activities. As people age, they become less productive, easily overcome by technologies advancements and replaced by the youngest generation. All of these facts undermine the capacity of the older to maintain jobs or to find new ones. This domain quantifies the share of work force among the older and gauges their actual chances to be part of the labour market (Zaidi et al, 2013).
The next domain quantifies the engagement of the older on unpaid but still productive activities. Since people can actually contribute to society through indirect means, this domain is a proxy for such situations. It includes volunteering activities that are often disregarded despite creating supportive conditions for others to function and contribute to society (Zaidi et al, 2013).
Thirdly, the “Independent Living” domain is created to assess how people cope with their ageing. As health declines and retirement takes place, idleness is very likely to be installed. For these reasons, the domain aims to understand if people live in charge of their own lives, including security, autonomy and independence aspects of daily lives (Zaidi et al, 2013).
Finally, the fourth domain is an attempt to evaluate the capabilities provided so that people can freely choose how to achieve the well-being that they value as they age (Sen, 1999). This domains is intended to
TABLE 1: Breakdown of AAI into domains and indicators, and respective explicit weights
Domains Indicators Domain’s explicit weights Indicators’ explicit weights
1.Employment 1.1 Employment rates for population aged 55-59 0.35 0.25
1.2 Employment rates for population aged 60-64 0.25
1.3 Employment rates for population aged 65-69 0.25
1.4 Employment rates for population aged 69-74 0.25
2. Participation in Society
2.1 Voluntary Activities 0.35 0.25
2.2 Care to children, grandchildren 0.25
2.3 Care to older adults 0.3
2.4 Political Participation 0.2
3. Independent, Healthy and Secure Living
3.1 Physical exercise 0.1 0.1
3.2 Access to health and dental care 0.2
3.3 Independent living arrangements 0.2
3.4 Relative Median Income 0.1
3.5 No poverty risk for older people 0.1
3.6 No severe material deprivation 0.1
3.7 Physical safety 0.1
3.8 Lifelong learning 0.1
4. Capacity and Enabling Environment for Active Ageing
4.1 Remaining life expectancy achievement 0.2 0.333333
4.2 Share of healthy years of reaming life expectancy 0.233333
4.3 Mental well-being 0.166667
4.4 Use of ICT 0.066667
4.5 Social connectedness 0.133333
include: Human Assets, by using outcome indicators on remaining life expectancy; Health Capital, incorporating healthy life expectancy and mental well-being indicators; and Human capital, with educational attainment, the use of ICT and social connectedness indicators (Zaidi et al, 2013).
3.4 Methodology used to compute Active Ageing Index at an aggregate level
In this work, the computation of AAI was performed at two levels: 1) at an aggregate (both country and region) level, as a closer replication of the original AAI; and 2) at an individual level, representing a debut practice. This doubled computation had to meet coherent results, that will be later explained.
Due to data access constraints mentioned before, a perfect replication of the AAI was not possible to be achieved; indicators’ proxies were used instead. 14
UNECE expert group has initially opted for using the z-score methodology, as in Bradshaw and Richardson (2009).15 However, during the second expert group meeting, it was decided that methodology would closely follow the one used in HDI. Therefore, the construction of aggregate AAI was based on 4 fundamental steps: 1) To assign a positive normative value for each and every indicator.16 2) To establish specific goalposts, by setting a minimum and maximum limit for each indicator. Here, two different approaches can be used: setting the goalposts according to any theoretical value or considering historical values (UNDP, 2013). My practice is very likely to be different from the original one, as no information on UNECE’s goalposts was made available. I have decided on the use of theoretical potential maximum values for indicators, even if some goalposts would represent utopian targets (Zaidi et al, 2013).17 Once no reasoning for the setting of a maximum ceiling for two indicators (3.1 and 4.1) was found, exceptions to this rule were made and historical maximum values were used. 18 Regarding minimum values, I have assumed 0 to be the subsistence value of all indicators. According to these, each indicator was re-scaled as following:
!"#$%& !"#$%!!"#"$%$ !"#$%
!"#$%&% !"#$%!!"#"$%$ !"#$%. 3) To calculate the arithmetic weighted average for each domain in the
14
An interested reader may refer to “Annex D –Indicators description and respective Data Sources”
15Indicators were expressed as a standardized deviation from the mean (scores;) their aggregation in a single index would refer to the the arithmetic mean of the scores. 16 To assign a normative and positive judgment value to an indicator means to transform it in such a way that higher it scores, the better the outcome.
17 Since 20 indicators are expressed as percentages, 1 was considered as maximum value
18 For indicator 3.4, the maximum value is 1,1339, which accounts for a Luxembourg scoring in 2011 (computations based on data from Eurostat). For indicator 4.1,
following way: 𝐷𝑜𝑚𝑎𝑖𝑛−𝑆𝑝𝑒𝑐𝑖𝑓𝑖𝑐 𝑖𝑛𝑑𝑒𝑥= ! 𝑥!𝑤!
! ; being 𝑥! = Indicator i and 𝑤!= i-Indicator’s
weight.4) To compute the overall AAI, as the arithmetic weighted average of the 4 domain-specific indices as follows: 𝑂𝑣𝑒𝑟𝑎𝑙𝑙 𝐴𝐴𝐼= ! 𝑥!𝑤!
! ; being 𝑥! = Domain-Specific Index j and 𝑤! = j-Domain-specific
index’s weight.
UNECE group has opposed to the equal weighting scheme used in HDI. Instead, the weighting arrangement of AAI was based on 2 distinct sets of weights: Explicit and Implicit weights. Explicit weights are the final weights assigned to each indicator and domain. In the absence of any theoretical or empirical foundation to define such values, these weights were set by considering the correlations between indicators, by testing multiple alternatives and by consulting EC’s for an opinion (See Table 1).19 Implicit weights are ad-hoc adjustments, reflecting the magnitudes of indicators, and set to meet the experts’ postulation of explicit weights.20 Due to the perceived limited relevance of implicit weights and to avoid a parsimonious computation of the index, implicit weights were ignored in this work.
The computation of AAI for Lisbon follows the methodology described above. But, since ESS and Eurostat would not supply data for specific regions, respective indicators were set constant accordingly to Portugal’s aggregate level.
3.5 Methodology used to compute Active Ageing Index at an individual level
The computation of the index at this level arises from the need to have a broader number of observations and a wider variation within observations, when associating AAI and QOL indicators. This step refers to the computation of AAI to each individual included in the SHARE sample. Note that, once again, indicators that were previously measured using a different data source were kept constant across individuals, according to their respective country value. The computation of individual AAI had to meet the following coherence equation: 𝐴𝑔𝑔𝑟𝑒𝑔𝑎𝑡𝑒 𝐴𝐴𝐼!= !!!!𝐼𝑛𝑑𝑖𝑣𝑖𝑑𝑢𝑎𝑙 𝐴𝐴𝐼!".This is, for c=1, country= Austria, aggregate
Austrian AAI must equal the sum of N Austrian AAI computed individually. So, to meet the above requirements, individual AAI computation took several steps: 1) Being 𝑥!" a variable that refers to the value
allocated to individual k for indicator i, linear and affine transformations were made, such as
𝑥!"becomes 𝑎𝑖𝑥𝑖𝑘+𝑏𝑖, where 𝑎!= !
!"#$!%! !"#$%!!!"#"!$! !"#$%! and
𝑏!= − !"#"!$! !"#$%!
!"#$!%! !"#$%!!!"#"!$! !"#$%!. This first
step concerns the standardization of variables according to each indicator i goalposts. 2) After this, to weight each indicator according to the pre-defined arrangement, a further transformation was taken: 𝜃! 𝑎!𝑥!"+𝑏! =
𝜃!𝑎!𝑥!"+𝜃!𝑏!, where 𝜃! refers to the indicator i’s explicit weight. 3) Third step emerges from the need to
compensate indicators for different population denominators used in their computation – note that indicator 1.1 refers to the population aged between 55 and 59, while indicator 2.1 refers to population aged 55 and more. Thus, instead of pondering indicators by 𝜃!, weights were further adjusted to respective population bases, such as 𝛿!= !!
!"#$% !"!#$%&'"( !"#$ !"#$""% !!!!" if i=1.1 and
𝛿!= !!
!"#$% !"!#$%&'"( !"#$ !! !" !!"# if i=2.1.
21
Variables were then transformed into 𝛿!𝑎!𝑥!"+𝛿!𝑏!. 4) Individual domain-specific indices were computed
as following: ! 𝛿!𝑎!𝑥!"+𝛿!𝑏!
!!! , where n=4 if referring to domain 1 or 2, n=8 if referring to domain 3 and
n=6 if referring to the last domain. 5) Domain-specific indices were then weighted in this way:
𝜆! !! (𝛿!𝑎!𝑥!"+𝛿!𝑏!
!! ), where 𝜆! refers to the explicit weight allocated to domain d. 6) Finally, individual
overall AAI was computed as the sum of the 4 domain-specific indices: 𝜆𝑑 𝑛𝑖 𝛿𝑖𝑎𝑖𝑥𝑖𝑘+𝛿𝑖𝑏𝑖 =1
4
𝑑=1 .
Before the coherence equation was tested, individual AAI were multiplied by SHARE’s sampling weights, wk , which refer to the number of people that each individual, k, represented: wk 𝜆! (𝛿!𝑎!𝑥!"+𝛿!𝑏!
!
!!! ).
!
!!! In the end, aggregate overall AAI should equalize the sum of the respective individual AAI: 𝐴𝑔𝑔𝑟𝑒𝑔𝑎𝑡𝑒 𝐴𝐴𝐼!= !!𝑤! 𝜆! (𝛿!𝑎!𝑥!"+𝛿!𝑏!
!
!!! ).
!
!!!
3.6 Ordered Probit/Logit Models
The present section introduces the model chosen to study the association of AAI and QOL indicators, as well as the tools used to evaluate the estimations. Ordered Probit and Logit Models belong to the category of Limited Dependent Variable Models. They are multinomial models, which means that they accept multiple mutually exclusive outcomes. These models allow for both individuals and alternative variant regressors and
their main characteristic - being ordered, denotes situations in which multiple outcomes are ranked according to a given order.
The general approach to model these situations implies the setting of latent variables, 𝑦!∗, which are
proxies of underlying processes that one wants to measure. The true variable that regards what is actually observed, 𝑦!, is then a function of the latent variables. It represents the choice of individual k, and takes the
values 0, 1, 2 , …, J. The base model stands as follows: 𝑦𝑘∗ = 𝛼𝑘+ 𝑥𝑘𝛽+ 𝜇
𝑘. As 𝑦!
∗crosses a set of
increasing unknown thresholds, the outcomes move up throughout the ordering of alternatives. In general, the observation rule for J alternative ordered model is given by: 𝑦! = 0 if 𝑦!∗≤ 𝛼!, 𝑦! = 1 if 𝛼!≤𝑦!∗≤ 𝛼
!, 𝑦! = 2 if 𝛼!≤𝑦!∗ ≤ 𝛼!, …,𝑦! = 𝐽 if 𝑦!∗≥ 𝛼!.
22
In these models, marginal effects of independent variables cannot be directly interpreted. Just by looking at the estimated coefficient, one can only infer the direction of variables’ effect and compare its magnitudes across coefficients. Only when coefficients are multiplied by the density of the distribution, one deduces marginal effects. To assess the models adequacy, I have used McFadden’s Pseudo-R2, which is an extension of R2 for non-linear regression models. 23
3.7 Dependent Variables
Defining QOL and monitoring its progress has remarkable policy implications, since it is a direct and indirect goal for individuals, nations, and world (Schuessler and Fisher, 1985). Despite the interest spurred by an increasing literature on QOL across disciplines, setting a definition for it has been quite elusive (Costanza et al, 2007). Research is divided into two measurement methodologies. The first exploits economic indicators to reflect the extent to which human needs are met; the other regards self reported levels of happiness, pleasure, fulfillment, and the like, and has been termed as “subjective well-being” (Diener and Lucas, 1999; Easterlin, 2003). All of the above considered, and according to Emerson’s (1985) definition of
QOL,24 I have selected from my database two indicators to serve as dependent variables in my model: self reported level of life satisfaction and self reported level of life happiness.
The use of self perception-based indicators was carefully considered. The first and major reason for it has already been stressed: not only there is no agreement on a single indicator to measure QOL, but also these 2 indicators were the best proxies found in databases. It is also important to recognize that QOL concerns de facto situations over the de jure. Kaufmann et al. (2003) have stated the importance of this distinction when approaching subjectivity. They have also underlined that, in some cases, subjective perceptions matter as much as reality, which I believe is the case of this study. Also, Diener and Suh (1999) have postulated evidence that subjective indicators are valid assessments of what people perceive to be important for their well-being. Nevertheless, I do not intend to suggest that these indicators are problem free. Instead, it is only right to remember that literature has pointed some critics on such usage. Schwarz and Strack (1999) have highlighted the fact that people judge their well being in comparison with peer groups rather than in absolute terms. It has also been said that mental capacity, cultural context, information, education and temperament are assumed to affect responses about life happiness and life satisfaction (Costanza et al, 2007).. Moreover, the link between the fulfillment of needs and subjective well-being is considered disturbed by time-varying relevance that individuals and cultures give to fulfilling each of the human needs relative to the others.
Having identified such flaws on subjective indicators; I have performed the feasible transformations on my variables. The national average of people aged below 55 was calculated for each variable and subtracted to individual values.By doing so, cultural differences among countries were somewhat avoided.25
Table 2: Description of Dependent Variables
lifesat Self reported level of life satisfaction, from 1 to 5
lifehap Self reported frequency of happy feelings towards life, from 1 to 4
3.6.3 Independent Variables
Table 3: Description of Independent Variables26
Variables Definition
AAI Overall Active Ageing Index, at an individual level
a1d First Domain-Specific Index, Employment Domain, at an individual level a2d Second Domain-Specific Index, Participation in Society, at an individual level
24 “QOL is the satisfaction of an individual’s values, goals and needs through the actualization of their abilities or lifestyle”
25 A more interested reader may refer to “Annex F- Detailed Description of Dependent Variables”
a3d Third Domain-Specific Index, Independent, Healthy and Secure Living, at an individual level
a4d Fourth Domain-Specific Index, Capacity and Enabling Environment for Active Ageing, at an individual level female Takes 1 if individual is female and 0 if male
a3i Third domain specific indicator (3.i), at an individual level age Takes the age of individuals by the end of year 2013
cntry Takes the name of the country in which the survey was administered numeracy Performance in a Mathematical Test, ranging from 1 (if bad) and 5 (if good)
cf008tot Total of words learned at first trial from a 10 words list mobility Number of mobility, arm function and fine motor limitations
adl Number of limitations with activities of daily living
4. Results
4.1 Active Ageing Index computed at an aggregate level
Table 4: Country ranking (R) and respective values (V) of overall AAi and Domain-Specific Indices
This section presents the results derived from the computation of aggregate AAI. 27 As showed in Table 4, Sweden, Denmark, Switzerland and Netherlands are frontrunners at ageing in an active way among the country sample. They register overall AAI values of 50,37%, 49,91%, 48,96% and 46,44%, which indicate the share of the potential Active Ageing status that has been realized by each country, respectively. These countries not only come at the top of the overall Index ranking, but are also placed in the top 5 of any Domain-Specific Index ranking, too. At the end of the tables, one can find Portugal, Hungary and Poland accounting for considerably smaller values, such as 33,4%, 31,38% and 31,21%, respectively. It is noticeable that the last countries face a much longer path to approach the maximum Active Ageing status. Surprising performances on Active Ageing are those of Czech Republic (Czechia) and Estonia, as they are positioned before Austria and Spain, for example. All in all, numerical values of overall indices suggest that all countries have a clear scope for large improvements, even if top ranked countries score approximately more 20% than the bottom ones.This is, the AAI favorite - Sweden, still has a substantial untapped potential, as it falls short by approximately 50% of the most desired status possible.
Chart 1: Contribution of each Domain to the Overall Index, AAI
Taking a closer look at Chart 1, one can conclude that 1st and 4th domains contribute the most to the overall AAI (with average contributions of 33,08% and 37,98%, respectively) and that the 2nd domain contributes the least (with an average contribution of 15,51%). The contribution of each domain refers to the extent in which a given domain explains AAI’s accomplishment. Two different aspects explain the size of each contribution: the magnitude of the values of each domain and the explicit weights allocated among domains. This means that, for instances, despites having the same explicit weights, the 1st domain registers higher values than the 2nd and, consequently, contributes more to the overall Index result. As it becomes clearer that the exercise of drawing of policies implications requires more information than just the values and ranking of overall Active Ageing Index alone; one should find it is interesting to explore each Domain-Specific Index in detail.
Regarding the Employment domain, substantial differences are noted across countries and indicators. Sweden stands out as the top ranked country, covering 0.5438% of the desired status; while Hungary, which is the country performing the worst within the domain, lags more than 30% behind it.28 Moreover, employment rate indicators score worse as age increases. Therefore, the indicator that refers to employment of people aged between 55 and 59 accounts for the highest values (with an average of 69,48%) and the one referring to the age group of 70 to 74 for the lowest (with an average of 4,24%). Estonia’s experience on this domain is notable, as it not only registers the 4th highest index, but also it faces the most balanced contribution of the indicators to the index, due to the outstanding significance of silver workers.29
Subsequently, Netherlands, Denmark and Belgium are the best performers at getting the older
28 More on the Indicator’s contribution to the Domain-Specific Indices in “Annex H – AAI computed at an aggregate level” 29 Silver workers are the working population aged between 65 and 74 years old (Zaidi et al, 2013).
0% 20% 40% 60% 80% 100%
Au st ri a B e lg iu
m
Czechia
Switz
er
land
G e rma n y D e n ma rk Es
tonia Spain
Fra
n
ce
Hu
n
g
a
ry
Italy
Net
herl
a
nds
Pol
and
Port
ugal
Sweden Slovenia
participative in society through unpaid forms. Spain, Portugal and Estonia fare the worst, lagging 16% behind top ranked countries. As the average of the values of the 2nd domain-specific index indicate (16,71%), this domain refers to the Active Ageing’s scope with the most unrealized potential. Furthermore, all countries do particularly bad in political participation (indictaor 2.4), as average values range from 1,3% (Portugal) to 8,09 % (Belgium).
Netherlands scores the highest 3rd Domain-Specific Index, it only falls short in 19,51% of the independent, healthy and secure living potential status developed under the concept Active Ageing. On the other side, Portugal and Poland face an untapped potential of 36,70% and 33,04% to achieve the desired level predefined for this domain, respectively. There are also wide variations within the domain. Both physical activity (3.1) and education training indicators (3.8) register extremely low values, unlike remaining domain indicators that account for pronounced average values (equal or above 79,35%).
When considering the 4th domain-specific index, the same countries that are at the top 5 of the overall AAI are also frontrunners. Estonia, Poland and Hungary come out at the bottom of the ranking. This index scores high average (71,33%), but distinguishes countries throughout an interval of 30%. Here, Spain faces an interesting scenario, since it only lags the top ranked country by 7% in this domain-specific index, but it intervals them by more than 13% in the overall AAI.
Lastly, one can understand that it is possible to look at the Lisbon’s indices against the country as a whole.30 The region experiences a higher realization of its potential in all 1st, 2nd and 3rd domains, than Portugal as a whole. It is interesting to understand that this suggests that, despites facing weak capability and enabling environment for Active Ageing, Lisboners account for a smaller untapped potential to Active Ageing (59,41%) than the whole country (65,91%). Some differences in specific indicators are also worth mentioning.The most striking one refers to the astonishing participation in society of silver workers. Lisboners aged between 65 and 69 account for an employment rate of 65,04%, which is more than 50% of the same employment rate registered for the whole country. Lisbon performs fairly well in the unpaid
participation in society domain, however political participation indicator still accounts for a very low value (2,03%).
To conclude this assessment, it should be clear that this section is purely descriptive, so that it is out of this work’s scope to explain the factors that support each result. It is recognized this embodies a limited view, as similar results on a domain might hide different situations.31 Additionally, note that the original computation of AAI comprises EU-27 countries, which means that despites the smaller sample, this work computes AAI for Switzerland and for any specific region for the first time. In this sense, it is important to inform that these results do not fully coincide with the ones provided by UNECE. Among the common fraction of the samples, the main differences rely on the position of middle ranked countries, such as Austria, France, Belgium, and Estonia. Portugal is also a controversial case, as it is ranked fairly well in the original computations and especially bad in this work; this is mainly due to the divergent performance on the first domain. Note that the scores for Lisbon in the first domain are, in fact, closer to the original computations of Portugal’s values. Finally, results suggest that all countries must aim for further improvements to accomplish an active ageing desirable status. Portugal, Hungary and Poland, which face significant larger gaps, require greater policy efforts. Generally, countries must draw their attention towards the first and second domain, as they illustrate worst experiences of the older. Also, employment of people aged over 65 (indicators 1.3 and 1.4), political participation (indicator 2.4) and engagement on educational training (indicator 3.8) are the areas that claim a greatest urgency to capture merit specific actions.
4.2 Active Ageing Index computed at an individual level
This section reports on the association of AAI, at an individual level, and QOL indicators. AAI was originally developed as an aggregate measure to be interpreted under a comparative context, either across countries and within goalposts. Since there is no meaning attached to the individual values of AAI, the computation of the variables’ marginal effects is skipped in this work.32
31 For instances, a low Participation in Society Index might be achieved due to a national lack of engagement in volunteering and political activities or due to legal or operational constrains imposed by organizations or governments
Table 5: lifesat/lifehap vs AAI/a1d, a2d, a3d, a4d, female, age
lifesat lifehap
(1a) (2a) (1b) (2b)
AAI 37.32 -315.9***
a1d -11.45 -80.30***
a2d 34.51 -106.0
a3d -470.3*** -554.6***
a4d 464.4*** 371.3***
age -0.00190*** 0.00147* -0.00241*** 0.00183**
female -0.0720*** -0.0637*** -0.0332*** -0.0231*
cutb
Pseudo-R2 0.001 0.002 0.002 0.003
* p<0.05, ** p<0.01, *** p<0.001; b – A complete version of the table is provided in Annex J
Table 5 shows estimated Ordered Probit Models with lifesat and lifehap as dependent variables, (a) and (b), respectively. 33 Model (1) considers the association with the overall AAI; while model (2) splits AAI into its 4 domain-specific indices. Age and female controls were also included.
Comparing regression (1) across dependent variables, a salient difference can be identified. The AAI’s coefficient is positive in lifesat model and negative and statistically significant in (1b). These estimations suggest that, on one hand, an increase in the value of overall AAI is associated with a higher life satisfaction; and, on the other hand, it is associated with a lower frequency of happy feelings about life.34 Note that, even though QOL variables are not highly correlated,35 the negative nature of such difference needs explanation. Considering that Active Ageing experience is meant to narrate higher QOL standards, a negative association between life happiness and AAI is rather unexpected.
A closer look at model (2) indicates that for both (a) and (b) settings, only 4th domain-specific index yields a positive and statistically significant coefficient. Remaining coefficients are negative, being the estimated coefficient of a3d statistically significant at a 99,99% confidence interval.
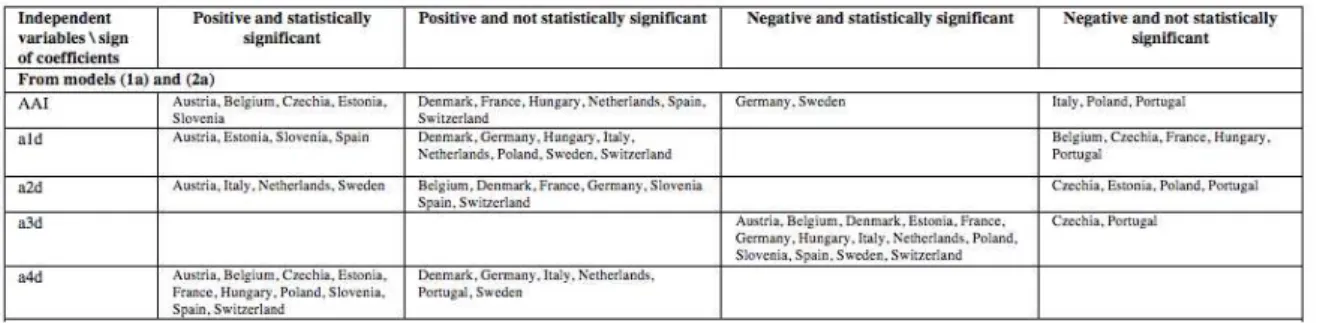
Table 6: Signs and statistical significance of coefficients derived from Models (1) and (2), for lifesat (a) and lifehap (b)
33 Both Orderd Probit and Ordered Logit models have been run; however, due to the similarity of the results, only estimations derived from the latter are presented. 34 The interpretation of coefficients will be done by refering to latent variables. One could also refer to the observed variable and interpret coefficients as: a higher value of AAI is associated with a higher probability of observing the highest self-reported level of life satisfaction, on average ceteris paribus, for example.
The same (1) and (2) regressions were estimated by country.36
Table 6 summarizes.The1st and 2nd
domain coefficients are positive for most of the countries; being in only two cases - Check Republic and
Slovenia - negative and statistically significant. The third domain, on its turn, registers consistency, as
coefficients are mostly negative; in fact, only for Check Republic, 3rd
domain faces a positive coefficient,
although not statistically significant. As for the 4th
domain-specific index, in both (a) and (b) models,
coefficients are always positive.
Table 7:lifesat/lifehap vs AAI, a1d, a2d,a3d, a4d, age, female, cntry
lifesat lifehap
(3a) (4a) (3b) (4b)
AAI 48.47 93.35**
a1d 12.29 27.70
a2d 46.76 142.5*
a3d -532.8*** -309.1***
a4d 492.3*** 279.7***
age -0.00120* 0.00283*** 0.000479 0.00295*** female -0.0731*** -0.0635*** -0.0393*** -0.0344*** Austriaa
Belgium -0.279*** -0.284*** -0.318*** -0.322*** Czech Republic -0.455*** -0.458*** -0.699*** -0.701*** Denmark 0.194*** 0.209*** -1.199*** -1.195*** Estonia -0.213*** -0.219*** -0.639*** -0.643*** France 0.144*** 0.140*** -0.188*** -0.192*** Germany -0.712*** -0.688*** -1.537*** -1.523*** Hungary 0.410*** 0.437*** -0.297*** -0.281*** Italy 0.376*** 0.374*** -0.494*** -0.495*** Netherlands -0.127*** -0.115*** -1.365*** -1.361*** Poland 0.250*** 0.264*** -0.485*** -0.475*** Portugal -0.00401 0.00655 -0.756*** -0.746*** Slovenia -0.441*** -0.425*** -1.549*** -1.540*** Spain -0.339*** -0.352*** -0.483*** -0.488*** Sweden -0.349*** -0.356*** -1.611*** -1.617*** Switzerland 0.0853*** 0.0716*** 0.113*** 0.105***
Cutb …
Pseudo-R2 0.027 0.029 0.080 0.080
p<0.05, ** p<0.01, *** p<0.001; a – base group ; b – A complete version of the table is provided in Annex L
Models (1) and (2) were extended to include a control variable, cntry. Here, coefficients are compulsory
equal throughout countries, only allowing for fixed level differences. These models yield the same
qualitative results as those presented in Table 6. In both (a) and (b) scenarios, AAI’s coefficients yield a positive sign, meaning that a higher overall AAI is positively associated with a higher level of life satisfaction and with a higher level of life happiness, on average ceteris paribus.37 Even though the 4th domain-specific index is the only positive and statistically significant (at 0.001% confidence level), the first two coefficients of
36 A more interested reader may refer to “Annex K: Model (1) and (2), sorted by country”
models (4a) and (4b) are now positive. Thus, an increase in the value of the 1st, the 2nd or the 4th domain-specific indices can be associated with an increase in the level of life satisfaction and of life happiness. On the contrary, a higher value on the 3rd domain still denotes a lower level of life satisfaction and of life happiness. Lastly, female’s coefficients are negative and highly significant; suggesting that, if everything else is held equal, a female has a lower level of life satisfaction and a lower frequency of happy feelings when compared to a male. Regarding the sign of age coefficient, no rigorous conclusion can be drawn.
Other explorations were performed.38 Domains were individually included in regressions in order to assess their exclusive association with the dependent variables.39 Results are identical to those estimated before.
After all these exercises, a paradox is identified. AAI can be considered as an element that defines QOL, since it is positively linked with lifesat and lifehap. A higher score on the overall AAI of an individual is then associated with higher levels of life satisfaction and with a higher frequency of happy feelings. Nevertheless, there is one domain of the overall index – the 3rd domain that opposes this association. This is, on one hand, and individual that experiences a higher level of independency, healthy and secure living accounts for a higher score in AAI, which is positively associated with higher QOL standards. On the other hand, a higher value on the same domain is also associated with lower standards. The next steps taken in this work project revisit the construction of the 3rd domain, by disaggregating it into its 8 indicators.
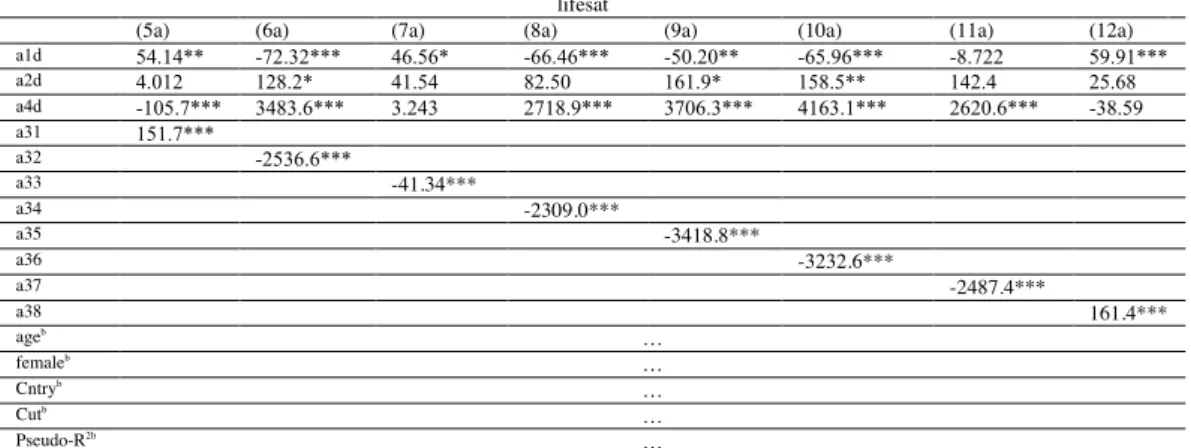
Table 8: lifesat vs a1d, a2d, a4d, a31, a32, a33, a34, a35, a36, a37, a38, female, age, cntry lifesat
(5a) (6a) (7a) (8a) (9a) (10a) (11a) (12a)
a1d 54.14** -72.32*** 46.56* -66.46*** -50.20** -65.96*** -8.722 59.91***
a2d 4.012 128.2* 41.54 82.50 161.9* 158.5** 142.4 25.68
a4d -105.7*** 3483.6*** 3.243 2718.9*** 3706.3*** 4163.1*** 2620.6*** -38.59
a31 151.7***
a32 -2536.6***
a33 -41.34***
a34 -2309.0***
a35 -3418.8***
a36 -3232.6***
a37 -2487.4***
a38 161.4***
ageb …
femaleb …
Cntryb …
Cutb …
Pseudo-R2b …
p<0.05, ** p<0.01, *** p<0.001; a – base group ; b – A complete version of the table is provided in Annex N
According to Table 8, most of the 3rd
domain indicators yield a negative and statistically significant sign
when they are individually included in the base regression; only indicators 3.1 and 3.8 account for a positive
value.40
If the reader’s attention is shifted towards 4th domain coefficients, it is clear that their magnitudes are much
larger in regressions (6), (8), (9), (10) and (11) than in the others. Note that these models refer to the inclusion
of indicators that were not computed with SHARE. The fact that respective indicators were kept constant
across individuals according to the respective national value is not evident in country-specific regressions
(table 6), which supports the presence of the control variable in the models.
Additionally, correlations between these 5 indicators and 4th
domain-specific index range from 0.97 to
0.984; whereas correlation of the remaining 3 indicators and the same domain index are 0.5477, 0.2729 and
0.1138, correspondingly.41
Due to the lack of wide ranging data respective to these 5 indicators, I reduce the assessment of the
negative association between the 3rd domain and QOL to the analysis of 3.1, 3.3 and 3.8 indicators. It remains
to be attested whether more suitable data would change the nature of the other 5 indicators. If the sign of their
coefficients is preserved negative, the construction of the 3rd domain should be definitely revisited and the
exclusion of these indicators should be considered.
Table 9: lifesat/lifehap vs a1d, a2d, a4d, a31, a33, a38, age, female, cntry lifesat lifehap
(13a) (13b)
a1d 40.64* 48.18**
a2d -52.85 82.88
a4d -62.75* -54.39
a31 146.2*** 83.84**
a33 -34.82*** -8.960
a38 166.3*** 135.3**
age 0.000802 0.00141*
female -0.0640*** -0.0351***
cntryb …
Cutb
…
Pseudo-R2 0.028 0.080
* p<0.05, ** p<0.01, *** p<0.001; b – A complete version of the table is provided in Annex P
In this sense, only 3 indicators were included in (13) models. In accordance to the previous reservations, table 9 reports a negative coefficient for indicator 3.3. This means that the livelihood in a single or double household of anyone aged over 74 is associated with a lower level of life satisfaction and life happiness, on average ceteris paribus. The signs of a31 and a18 are positively and statistically significant for a 99,99%
confidence interval. Domain-specific coefficients face unsteady signs, in this model.
Furthermore, while exploring the nature of a33, I have found that this indicator is, in fact, negative correlated with other indicators or domains, namely a1d and a38. Having no certainties on the signs of 5 indicators, it can be concluded that, at least, indicator 3.3 is not aligned with the ultimate goal of Active Ageing, as it is negatively linked to lifesat and lifehap. Henceforth, the authors of AAI might want to reconsider its inclusion in the scope of the 3rd domain.
By now, it is only reasonable to wonder why the association of such indicator and QOL variables is negative. Factors that might explain it are, for example, loneliness, isolation or little connection with relatives. One could even point out situations where people do not have the capabilities to live under such arrangement and/or situations where people do not freely choose to live. However, it is important to have in mind that the 3rd domain, as well as the 1st and 2nd, are aimed at assessing the experience of an active ageing and not at evaluating the provision of capabilities to live so.
Table X: lifesat/lifehap vs a1d, a2d, a4d, a31, a33, a38, mobility, adl, numeracy, cf008tot, age, female, cntry
lifesat lifehap
(14a) (14b)
a1d 102.3** 89.93*
a2d -110.6 131.9*
a4d -41.03 -43.14
a31 56.52* -2.356
a33 -25.67* -3.105
a38 208.8** 95.60
mobility -0.106*** -0.0577***
adl -0.0472*** -0.00872
numeracy 0.0610*** 0.0608***
cf008tot 0.0377*** 0.0402***
age …
female …
cntryb
…
Cutb
…
Pseudo-R2 0.052 0.071
* p<0.05, ** p<0.01, *** p<0.001; b – A complete version of the table is provided in Annex Q
Lastly, to answer some of the points raised above about the capabilities to live under a single or double household, I have decided to run two more regressions. As individuals’ physical and mental capabilities are additionally considered in the models, the association of a33 with lifesat and lifehap diminishes. This is, indicator 3.3 coefficient magnitudes are reduced. Accordingly, one can conclude that, in fact, a33 captures different effects, such as the incapability of the older to live under such arrangements.
5. Conclusion
pension and health systems provision, public goods’ availability and public finances’ sustainability. Henceforth, an urge to anticipate its impacts and to overcome its challenges has emerged. In this sense, EC has required the development of an evidence-gathering tool that assesses the countries’ experiences on ageing and measures the untapped potential to improve the older’s quality of life. Active Ageing Index was then created in 2012.
This work provides the computation of AAI for 16 European countries and for Lisbon. The calculation of AAI for Switzerland and for a specific region constitutes a debut practice. According to results, Sweden, Denmark and Netherlands are the frontrunners at actively ageing; while Portugal, Hungary and Poland are placed at the bottom of the AAI ranking. Employment and Participation in Society domains of AAI represent the ones in which all countries face the most untapped potential. On average, countries fall short of this domains’ desired status by 0.6435% and 0.8329%, respectively. Employment of people aged over 65, political participation and engagement on educational training are the areas that claim a greatest urgency to capture merit specific actions. Furthermore, Lisbon faces a smaller untapped potential to Active Ageing (59,41%) than the whole country (65,91%).
acknowledged of data limitations. It remains to be attested whether more suitable data would change the nature these 5 indicators. I have had consistently identified the negative association between indicator 3.3 and
QOL indicators, however; meaning that, the livelihood in a single or double household of anyone aged over
74 is associated with a lower level of life satisfaction and life happiness, on average ceteris paribus. It can be concluded that, at least, indicator 3.3 is not aligned with the ultimate goal of Active Ageing.
Henceforth, according to this work project results, AAI’ authors might want to revisite the construction of the index. AAI refers to a robust evidence-gathering tool, aimed at leading policy actions. Its validity is at stake if their elements are not all aligned with the safeguarding of the older’s quality of life.
Further research is suggested to clarify the assessment of the 5 indicators belonging to the 3rd domain that were not computed with individual data, in this work. Additionally, it would be valuable to study the specific situations that the index hides; this is, to explore the reasons for Sweden to be the frontrunner of Active Ageing, for example. I believe useful policy implications would be drawn from such exercises. Lastly, the association of AAI and QOL variables might represent the first step on the long path of identifying a more accurate relevance of each domain and thus, on the allocation of the explicit weights among them.
Main References42
Cameron, A.C. and P.K. Triverdi. 2005. Microeconometrics: methods and applications. New York, USA: Cambridge University Press
Christensen, D.A., Ervik R., Helgoy I. 2003.The impact of institutional legacies on active ageing policies: Norway and UK as contrasting cases. Stein Rokkan Centre for Social Studies. Working Paper 18.
COM.1999.Towards A Europe for All Ages – Promoting Prosperity and Intergenerational Solidarity. Comission of the European Communities.
Costanza, R., Fisher, B., Ali, S., Beer,C., Bond,L., Boumans,R., Danigelis N.L., Dickinson,J., Elliott, C., Farley, J., Gayer,D.E., Glenn,L.M., Hudspeth,T., Mahoney,D., McCahill,L., McIntosh,B., Reed,B., Rizvi,S.A.T., Rizzo,D.M., Simpatico,T., Snapp,R.2007. Quality of life: An approach integrating opportunities, human needs, and subjective well-being. Ecological Economics 61, 267–276.
Eurostat.2010. Europe in figures — Eurostat yearbook 2010. Eurostat.
HelpAge International.2013.Global AgeWatch Index- Purpose, methodology and results.HelpAge International.
Kaufmann, D., Kraay, A., Zoido-Lobatón, P.1999a.”Aggregating Governance Indicators”. Washington, D.C. World Bank Policy Research Working Paper No 2195
Kaufmann, D., Kraay, A., Zoido-Lobatón, P.1999b. Governance Matters. Washington, D.C.World Bank Policy Research paper No2196
OECD.2000.Reforms for an Ageing Society. OECD.
UNECE.2012.Report on the First Meeting of the UNECE Expert Group on conceptualizing and measuring Active Ageing. European Centre Vienna.
UNDP.1990.Human Development Report 1990.New York: Oxford University Press 1990
UNDP.2013.Human Development Report 2013 - The Rise of the South Human Progress in a Diverse World.Tecnhical Notes. UNDP
WHO.2002.Active Ageing - A Policy Framework. Copyright World Health Organization.
Zaidi, A., Gasior, K., Hofmarcher,M., Lelkes, O., Marin,B., Rodrigues,R., Schmidt,A., Vanhuysse,P., Zolyomi, E.2013. Active Ageing Index 2012 - Concept, Methodology and Final Results. European Centre Vienna.