a Corresponding author: [email protected]
Responses’ Prediction Standard Error Analysis in Pareto Solutions
Nuno Costa1,3,a, João Lourenço1,2
1Instituto Politécnico de Setúbal – Escola Superior de Tecnologia de Setúbal, Setúbal, Portugal; e-mail: [email protected], 2INESC-ID, Rua Alves Redol 9, 1000-029 Lisboa, Portugal; e-mail: [email protected]
3UNIDEMI, Faculdade de Ciências e Tecnologia-Universidade Nova de Lisboa, 2829-516 Caparica, Portugal
Abstract - A Pareto front provides to the decision-maker a set of optimal solutions from where a unique solution should be selected to solve a multiresponse problem. However, the responses’ prediction standard error for each one of the optimal solutions is different, which impacts on the reproducibility of Pareto solutions. This means that the decision-maker has to take into account the responses’ prediction standard error in the solution selection process. For this purpose, a metric is presented. A bi-objective problem is used as example and results displayed graphically.
1. Introduction
Industrial problems are multidimensional so the optimization of multiresponse problems has been an active research field. The simultaneous optimization of multiresponses is an often used practice to generate solutions for problems with conflicting responses, which are usual in real-life problems. A desired condition for any candidate solution for these type of problems is that the solution is non-dominated. This means that no better values for one or more responses can be achieved in another solution without degrading the value of, at least, another response.
A representative set of optimal or non-dominated solutions constitutes a Pareto front, and provide the most favorable alternative choices for solving a multiresponse optimization problem. However, assuming that the Pareto front was appropriately generated, the decision-maker faces another issue: to choose an optimal solution from the generated set. This is not a trivial task, because the reproducibility of optimal solutions cannot be ignored by the decision-maker. In fact, there is no guarantee that product or process performs as expected when is run at a chosen input variable location due to the existence of a natural process variability and uncertainty in the estimated responses. This means that the responses’ prediction standard error in each optimal solution has to be evaluated and considered in the decision process, which has been ignored so far. Therefore, the objective of this manuscript is to introduce a metric to assess the prediction standard error of each optimal solution to help the decision-maker in making a more informed decision in the solution selection process.
2. Pareto Optimality-Dominance Relation
A multiresponse optimization (MRO) problem can be defined as follows:
Minimize f(r, M)
x (1)
subject to
g(x, b)≤ 0
h(x, b) = 0
x x
where f is a scalar valued function, M represents the set of user-specified or preference parameters (weights, priorities, shape factors, …), and r is the vector of responses 1, … , . Parameters do not controlled by the decision-maker are denoted by b. Design or input variables, denoted by vector x, with lower bound x and upper bound x . Constraints are represented by g(x, b) and h(x, b).
In contrast to single response optimization problems, where the optimal solution is defined easily, for MRO problems a solution is more a concept than a definition [1]. In practice, a compromise solution has to be selected, because the utopia point (the variables setting that yields a solution with all responses at their target value) for formulation (1) cannot be achieved.
MATEC Web of Conferences
a) the value of any response in r is no worse (is lower or equal) than that of r ;
b) the value of at least one response in r is strictly better (is lower) than those of r .
Pareto frontiers can be displayed graphically only for problems with two or three responses, and consensus on what qualities a representation of the non-dominated set should possess do not exist. According to [2], quality measures that have been proposed and may be useful to this end are the following: 1- measures of cardinality (which refer to the number of points in a representation); 2- coverage (which refer to the regions of the outcome set that are represented); 3- spacing (which refer to the distance between points in the representation). Hybrid measures which overlap the above three categories have been also introduced in the literature. An example is the hypervolume measure, a well-established indicator of a front’s quality [3-4].
A representative set of non-dominated solutions for MRO problems is helpful as it provides a broad overview of alternative solutions. However, in practice, only one solution is selected. This leads to a critical question: which optimal solution must be chosen?
3. Reproducibility of Non-dominated
Solutions
A discrete representation of a Pareto frontier (a collection of solutions distributed along the Pareto front that provide a finite and manageable alternative solutions to the decision-maker) is, in general, sufficient for selecting a solution for MRO problems. Majority of the literature has focused on how to find the Pareto frontier with its most promising choices without providing more insights on how to proceed from those choices to a final decision [5]. However, it is important to be aware that some Pareto solutions may lead to operation conditions more hazardous, more costly or more difficult to implement and control than others. In fact, the responses’ prediction standard error is not the same for all the Pareto solutions and, if it is ignored, can potentially lead to suboptimal choices and selected solution yield, in practice, unexpected results. To minimize the gap between the theoretical and practical results, the decision-maker must assess the prediction standard error. For this purpose, one can use Eq. (2),
1 + x x (2)
which is the second term of a two-sided prediction interval for the r-th predicted response at optimal location x0. Note that prediction intervals give a range for the y-value of the next observation given specific x-y-values, and is defined as
x ± ,! " 1 + x ′ x (3)
where the mean square error MSE = SSE/(n−z), SSE is the
error sum of squares, n is the number of experimental
runs in the model matrix X, z is the number of terms in the response’s model, and α is the significance level.
4. Case Study
The objective of this example is to determine the settings for reaction time (x1), reaction temperature (x2), and amount of catalyst (x3) to maximize the conversion (y1) of a polymer and achieve a target value for the thermal activity (y2). A central composite design with four center points was run and the (mean)models fitted to responses are
$̂ = 81.0943 + 1.0290 + 4.0426 + 6.2060 −
1.8377 + 2.9455 − 5.2036 + 2.1250
+ 11.3750 − 3.8750
$̂ = 59.8505 + 3.5855 + 0.2547 + 2.2312 +
0.8360 + 0.0742 + 0.0565 − 0.3875
− 0.0375 + 0.3125
The range values for y1 and y2 are [80, 100] and [55, 60], respectively. Assuming that y1 is a Larger-The-Better response type - the estimated response value is expected to be equal or larger than an upper bound, the target value is set equal to 100; y2 is a Nominal-The-Best response type - the estimated response value is expected to be equal to a target value), the target value is set equal to 57.5. The constraints for the input variables are
) 3 2 1 ( 682 . 1 682 .
1 ≤xi≤ i= , ,
− .
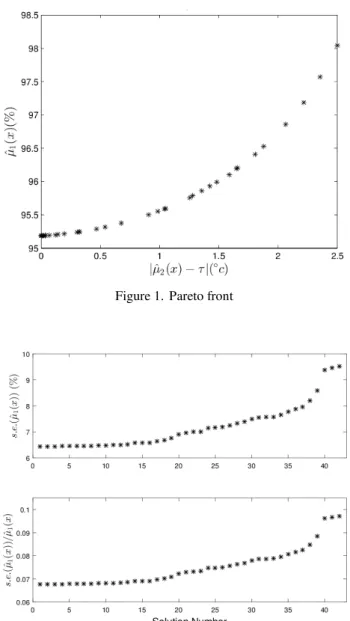
Figure 1 displays the Pareto front generated with the compromise programming-based criterion proposed in Ref. [6], varying the shape factor 1 &' 4 in
increments of 0.01 and a Sequential Quadratic Programming algorithm. This example deals with the optimization of two responses so it was possible to display the Pareto frontier graphically, and one can see that responses are in conflict: when $̂ increases, $̂ deviates from target and vice-versa.
Figures 2 and 3 show that pick up a solution based on technical, economic or decision-maker preferences may not produce the expected results in practice, because responses’ prediction standard errors are not homogeneous. Prediction standard error ranges from 6.5 % to 9.5 % for the polymer conversion and from 2.4 ºC to 3.6 ºC in thermal activity. These values range is not as small as desired and may impact on process or product performance. The normalized responses’ prediction standard errors (relative magnitude of the prediction error) for each solution [ . . $̂,))/$̂,] is also presented in Figures 2-3, and it is interesting to note that the values trend in both graphs are similar and analogous to those of
. . $̂,). This means that the same decision would be
taken from both pair of graphs, . . $̂ ) versus . . $̂ ) or . . $̂ )/$̂ versus . . $̂ )/$̂ .
1
x x2 x3
2 1
x x22 x32
2 1x
x x1x3 x2x3
1
x x2 x3
2 1
x x22 x32
2 1x
Figure 1. Pareto front
Figure 2. Standard error: Polymer conversion
Figure 3. Standard error: Thermal activity
5. Results Discussion
A compromise solution to solve a MRO problem must be selected among those of the Pareto front. However, those solutions may not yield the expected practical result, because responses’ prediction standard error of a selected solution at optimal variable settings can be (excessively) high. The magnitude of responses’ prediction standard error can be displayed graphically, such as shown in Figures 2 and 3, and may help decision-maker in making a more informed optimal solution selection.
Optimal solution selection is more complicated and Pareto front visualization impossible for more than four responses so alternative tools such as tabular lists are necessary to highlight more favorable solutions in an effective manner. Nevertheless, the decision-maker needs to balance the conflict between responses’ priority and responses’ prediction standard error. For instance, if priority is setting $̂ on target value ($̂ -; see Figure 1), one can see from Figure 3 that lower prediction standard error values for thermal activity [ . . $̂ )] are found for the first solutions, where $̂ -, as well as for solutions where $̂ is slightly deviated from its target ($̂ ≠ -), namely the solutions number 1 up to 12. Moreover, it is interesting to note that . . $̂ ) values are also low for these solutions. If priority is setting $̂ on target value, Figure 2 shows that . . $̂ ) value is undesirably higher for solution number 42 (the solution with the highest $̂ value) than for other solutions, for instance, the thirty-fifth solution, though its $̂ value are slightly worst (lower than 96.5%). Note that . . $̂ ) value for solution number 42 is also undesirably higher. This confirms that no conflict exists between . . $̂ ) and . . $̂ ) values if decision-maker assigns a higher priority either to $̂ or $̂ . Nevertheless, this case study shows that only by chance a better solution would be selected from the simple analysis of a list or a graph with a representative set of Pareto (optimal) solutions. Some solutions should be avoided because their prediction standard error is too high. This confirms that a compromise is necessary to select a solution for MRO problems and information about solutions reproducibility ( . . $̂') or . . $̂')/$̂' values) cannot be ignored. In
fact, responses are usually in conflict and s.e. values for some solutions in either one or both responses is undesirably high and likely lead to less favorable results in practice. Confirmatory runs can help in the decision-making process, and decision-maker must be aware that solutions whose response values are slightly deviated from target and . . $̂') or . . $̂')/$̂' values are lower
can be effective alternatives for solving MRO problems.
6. Conclusions and Future work
MATEC Web of Conferences
responses’ prediction standard error. However, this may not be possible due to the conflict between the responses’ priority and the responses’ prediction standard error. In fact, the prediction standard error may be higher for desired response values. Thus, in practice, a compromise between technical and economic considerations will dictate the final decision about the most favorable solution.
To help the decision-maker in making more informed decisions, future work shall investigate the impact of models coefficient uncertainty in Pareto fronts. Optimal solutions built on the worst-case estimated responses must be generated and other metric(s) developed to evaluate optimal solutions.
Acknowledge
The authors thanks for IPS/ESTSetubal and NOVA ID-FCT/UNIDEMI for the support received.
References
1. Marler, R., Arora, J. Survey of multi-objective optimization methods for engineering; Struct Multid Opt, 26(1), 369-395, 2004.
2. Faulkenberg, S., Wiecek, M. On the quality of discrete representations in multiple objective programming; Opt Engng, 11(3), 423-440, 2010.
3. Cao, Y., Smucker, B., Robinson, T. On using the hypervolume indicator to compare Pareto fronts: Applications to multi-criteria optimal experimental design; J Stat Plan Inf, 160(8), 60-74, 2015.
4. Lu, L., Anderson-Cook, C., Adapting the hypervolume quality indicator to quantify trade-offs and search efficiency for multiple criteria decision making using Pareto fronts; Qual Reliab Engng Int, 29(8), 1117-1133, 2012.
5. Chapman, J., Lu, L., Anderson-Cook, C. Impact of response variability on Pareto front optimization; Statistical Analysis and Data Mining: The ASA Data Science J, 8(5-6), 314-328, 2015.