__________________________________
1 Pesquisador da Embrapa Agrossilvopastoril, Sinop - MT, área de Manejo, Conservação e Uso de Recursos Hídricos. 2 Professor, Departamento de Engenharia de Biossistemas, ESALQ/USP, Piracicaba - SP.
3 Professora temporária, Universidade Federal de Mato Grosso - UFMT, Sinop - MT. 4 Professor, Departamento de Engenharia de Biossistemas, ESALQ/USP, Piracicaba - SP.
Recebido pelo Conselho Editorial em: 23-4-2010 Aprovado pelo Conselho Editorial em: 7-2-2012
ECONOMIC VIABILITY OF RETROFITING EMITTERS IN CENTER PIVOT IRRIGATION SYSTEMS
CORNÉLIO A. ZOLIN1, RUBENS D. COELHO2, JANAINA PAULINO3,
MARCOS V. FOLEGATTI4
ABSTRACT: Although several studies have been conducted to evaluate the uniformity of water application under center pivot irrigation systems, there are few studies concerning the economic perspective of such coefficient. The aim of this study is to present a methodology to accomplish an economic analysis as support for the decision-making to retrofit emitters in center pivot irrigation systems, and to attribute an economic meaning to the uniformity coefficient of water application taking into account the response function productivity to the amount of water applied and the sale price of the crops. In the hypothetic calculation example considering the variation of revenue of potato crop under center pivot irrigation system, it was verified that the area with uniformity coefficient of water application of 90% brought an income increase of BR$ 1,992.00, considering an area about 1,0 ha. Thus, it can be concluded that the methodology presented has met the objectives proposed in the study and made it possible to attribute an economical meaning to the coefficient of water uniformity application.
KEYWORDS: Heermann’s uniformity coefficient, production function, sale price of crops.
VIABILIDADE ECONÔMICA DA TROCA DE EMISSORES EM SISTEMAS DE IRRIGAÇÃO TIPO PIVÔ CENTRAL
RESUMO: Embora vários estudos tenham sido conduzidos para a avaliação da uniformidade de aplicação de água por equipamentos de irrigação do tipo pivô central, são escassos os trabalhos que tenham analisado de um ponto de vista econômico o significado de tal coeficiente. Objetivou-se com o presente trabalho apresentar uma metodologia de análise econômica como auxílio na tomada de decisão para troca de emissores de sistemas de irrigação tipo pivô central e atribuir um significado econômico ao coeficiente de uniformidade de aplicação de água, levando-se em consideração a função de resposta da cultura à lâmina de água aplicada e o preço de venda dos produtos agrícolas. No exemplo hipotético de cálculo, considerando-se a diferença na renda obtida com a cultura da batata irrigada com coeficiente de uniformidade de 90% e 70%, respectivamente, verificou-se que, para um pivô de aproximadamente 1,0 ha, a irrigação com 90% de uniformidade poderia incrementar em R$ 1.992,00 a renda do produtor. Conclui-se, portanto, que a metodologia apresentada atendeu aos objetivos propostos no trabalho e possibilitou atribuir um valor econômico ao coeficiente de uniformidade de aplicação de água.
PALAVRAS-CHAVE: coeficiente de uniformidade de Heermann, função de produção, preço de venda das culturas.
INTRODUCTION
appropriate methods of water management should always be considered (SANDRI & CORTEZ, 2009).
According to BERNARDO et al. (2008) uniform distribution and efficiency of water application of sprinkler irrigation systems are essential parameters to express the quality of irrigation. Thus, assessments of center pivots, beyond the application efficiency, should consider the uniformity of water distribution along the side of the system.
Moreover, the uniformity of water distribution and yield of irrigated crops are directly related, and the high uniformity of application can reduce percolation losses, resulting in economic and environmental benefits.
According to FARIA et al. (2009) sprinkler irrigation systems should apply water as evenly as possible, since an uneven water application reduces the economic return and increases the environmental impact of irrigation, due to the reduction in the productivity of irrigated crops and waste of water, energy and fertilizers. Therefore, it is of great importance that investments are made in maintenance and manpower to improve irrigation systems in order to promote a rational water management.
Amongst the methods of sprinkler irrigation, the center pivot has shown significant expansion in domestic irrigated agriculture. This is due, among others aspects, to the fact that this is a mechanized system that can be used even in large areas with uneven topography; it provides the potential for the use of fertirrigation; does not interfere with agricultural practices and enables the application of small blades with high frequency.
In a study published by PAULINO et al. (2011), which studied the situation of irrigated agriculture in Brazil and presented the expressiveness and evolution of the different methods and irrigation systems, it is possible to see the potential of center-pivot systems. According to the authors, 840 000 hectares are currently irrigated by center pivot, which corresponds to 19% of the total irrigated area in Brazil.
For analysis and evaluation of a system of center pivot irrigation, it is necessary, among other things, to have information on the distribution of the water applied by the equipment, since low distribution uniformity can result in unsatisfactory results in homogeneous areas of management, reducing the efficiency of application (RODRIGUES et al., 2001).
FRIZZONE et al. (2007), studying the grain yield under different uniformity of water distribution on soil surface and subsurface, concluded that the quality of irrigation affected the uniformity of soil moisture and influenced the variables of production of beans crop.
PINTO et al. (2006), studying the influence of climatic variables and hydraulic performance of a center pivot irrigation in western Bahia, noted that on the first 340 m from the center pivot, the blade applied was higher than the average water depth, except in the area ranging from 60 to 90 m from the center pivot which represented only 1.8% of the irrigated area. By contrast, in the last 164 m, which represented 45.5% of the total irrigated area, the authors observed blades below the average. It is noteworthy that, probably, these problems could be avoided by replacing the emitters on the system by more appropriate ones considering that the diameter of the pipe side of the system is sized properly.
In a reseach done by CASTIBLANCO (2009), in which was studied the energy savings in center pivot irrigation due to the improvement in uniformity of water distribution, the author considered different values of uniformity coefficient of water application and compared the net revenues obtained with five different values for the m³ of water consumed and sale price for the bean crop.
irrigation enabled higher profits and greater energy savings, especially for irrigation carried out in the wet season.
Although there are several studies in the literature regarding the uniformity of water application, in view of the importance of this parameter there are few studies that analyze from an economic point of view the relationship between the uniformity coefficient and the crop yield.
It is known that certain amounts of uniformity coefficient of water application are suitable, such as 90 and 95% for center pivot systems and drip systems, respectively, but this means little in economic terms, i.e.: what is the economic loss in terms of production if a producer irrigates a particular crop with a uniformity coefficient of 80%? And what will be its increase in profit if the producer opts to manage irrigation with a uniformity coefficient of 90%, refitting the emitters of the system?
The aim of this study is to present an analysis methodology to help in the decision making with regard to the exchange of emitters used in center pivot irrigation, and assign an economic meaning to the uniformity coefficient of water application based on the rainfall during the crop cycle, the production function (water) and the sale price of agricultural products.
MATERIAL AND METHODS
The methodology to assess the economic viability of the exchange of emitters used in center pivot irrigation considers the following steps described below.
The equation proposed by Heermann & Hein (1968), adapted from Christiansen, is used to calculate the uniformity coefficient of water application (CUCh)
N
1 i
i N
1 i
i i
H
A MP
MP w A 1
CUC (1)
Where,
N
1 i N
1 i i
i i
A A w
MP (2)
In which,
CUCH - uniformity coefficient of water application, %;
MP - weighted average water depth from sampled collectors, mm; wi - water depth colected at collector (i), mm;
Ai - area represented by collector (i), ha, and N - number of collectors.
To calculate the wetted area represented by each collector i, according to its importance over the pivot, a serial number is assigned to each of them, where the first collector receives the number 1 and so on until the last collector, its representative area being calculated according to the following equation:
l i 2πRS
A (3) In which,
R - distance from the collector (i) to the center pivot, m, and Sl - spacing between collectors, m.
which could be saved through the emitters’ refitting. The total number of emitters along the pivot is calculated using the following equation:
e l Te S S N
N (4)
In which,
NTe - yotal emitters number, and Se - spacing between emitters, m.
The total amount for the issuers is obtained by multiplying the total number of emitters (NTe)
by its unit value.
Response functions to applied irrigation, used for calculating the viability of the exchange of emitters can be generically represented by a quadratic polynomial equation as follows:
C w B w A
Y 2 (5) In which,
Y - crop yield, Mg ha-1;
A, B e C - constants of the equation (admensional), and w - water depth applied, mm.
To obtain the optimum blade (w*) of water to be applied, the crop response to applied water equation has to be derived and equal to zero; the maximum yield (Y*) is obtained by the substitution of the optimal blade in its respective function, and the maximum production (P*) is obtained by the product between maximum productivity and total wetted area of the pivot.
The blade estimated to be applied along the production cycle in the area, represented by the collector I, is obtained by the following equation:
C MPw C w
we * i
i
(6)
In which,
wei - estimated water depth to be applied over production cycle for collector i, mm, and C - precipitation occurred over crop production cycle, mm.
M P wi
- Admensional water depth.
The estimated yield for the area represented by the collector i (Yi), is obtained by assigning the values of wei in the production function and the estimated total average productivity (YMT) is
calculated by the following equation:
N 1 i i MT N YY (7)
Average production estimated for the total wet area of the equipment (PME) can be obtained
by eq.(8), where:
N 1 i i N 1 i i i ME ) A ( A YP (8)
In which:
The estimated profit from the exchange of emitters is obtained by the following equation:
((P* PME)1000)V (NTe Ve
LTE (9)
In which,
LTE - profit from emitters refitting, BR$; V - crop sale price, BR$ kg-1, and
Ve - emitters price per unit, BR$.
Regarding eq.(9) it is important to note that the profit from the exchange of emitters can be estimated for CUCH value below 100% and therefore for maximum production value (P*) inferior to that obtained with an optimal blade. In this case, for calculating the profit gained with the exchange of emitters the numbers used must be the estimated productions in initial and final conditions, namely before and after the emitters exchange, as described below in greater detail in the calculation example presented below.
Hypothetical example of calculation
To exemplify the application of this methodology two hypothetical calculation examples were performed, the first considering a CUCH of 70% and the second considering a CUCH of 90%, tables 1 and 2 respectively. The examples used hypothetical water depth value collected from each collector (i) to obtain CUCH value of 70% and 90%. The response function of the potato crop to water depth applied was used in the examples of calculation, according to Duarte (1989) cited by Coelho et al. (1998), which is represented by the following equation:
Y0,00014517w20,1818w28,3198 (10)
The calculation examples considered a 50 mm precipitation during the crop cycle and the spacing between emitters and collectors as being 2.5 and 3 m respectively. The unit value of emitters to be replaced was considered (hypothetically) to be BR$ 20.00 and the sale price per kg of potato crop was considered to be the average deflated price for the year 2007 according to the AGRIANUAL (2008).
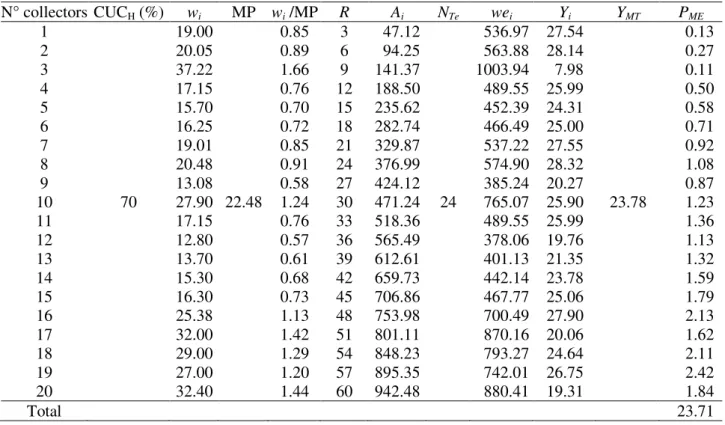
TABLE 1. Hypothetical data used in the calculation example under CUCH of 70%.
N° collectors CUCH (%) wi MP wi /MP R Ai NTe wei Yi YMT PME
1 19.00 0.85 3 47.12 536.97 27.54 0.13
2 20.05 0.89 6 94.25 563.88 28.14 0.27
3 37.22 1.66 9 141.37 1003.94 7.98 0.11
4 17.15 0.76 12 188.50 489.55 25.99 0.50
5 15.70 0.70 15 235.62 452.39 24.31 0.58
6 16.25 0.72 18 282.74 466.49 25.00 0.71
7 19.01 0.85 21 329.87 537.22 27.55 0.92
8 20.48 0.91 24 376.99 574.90 28.32 1.08
9 13.08 0.58 27 424.12 385.24 20.27 0.87
10 70 27.90 22.48 1.24 30 471.24 24 765.07 25.90 23.78 1.23
11 17.15 0.76 33 518.36 489.55 25.99 1.36
12 12.80 0.57 36 565.49 378.06 19.76 1.13
13 13.70 0.61 39 612.61 401.13 21.35 1.32
14 15.30 0.68 42 659.73 442.14 23.78 1.59
15 16.30 0.73 45 706.86 467.77 25.06 1.79
16 25.38 1.13 48 753.98 700.49 27.90 2.13
17 32.00 1.42 51 801.11 870.16 20.06 1.62
18 29.00 1.29 54 848.23 793.27 24.64 2.11
19 27.00 1.20 57 895.35 742.01 26.75 2.42
20 32.40 1.44 60 942.48 880.41 19.31 1.84
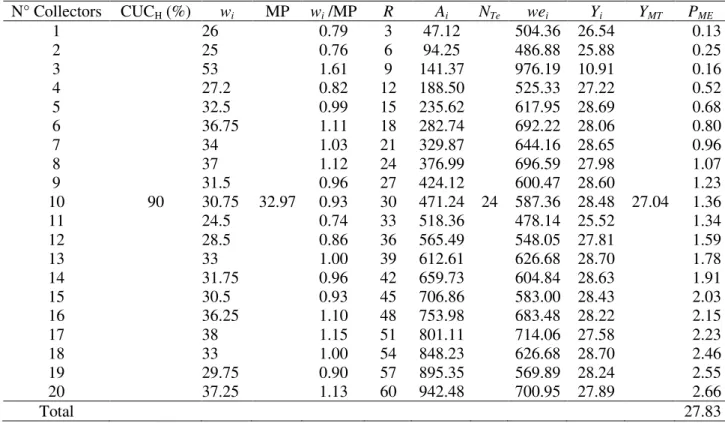
TABLE 2. Hypothetical data used in the calculation example under CUCH of 90%.
N° Collectors CUCH (%) wi MP wi /MP R Ai NTe wei Yi YMT PME
1 26 0.79 3 47.12 504.36 26.54 0.13
2 25 0.76 6 94.25 486.88 25.88 0.25
3 53 1.61 9 141.37 976.19 10.91 0.16
4 27.2 0.82 12 188.50 525.33 27.22 0.52
5 32.5 0.99 15 235.62 617.95 28.69 0.68
6 36.75 1.11 18 282.74 692.22 28.06 0.80
7 34 1.03 21 329.87 644.16 28.65 0.96
8 37 1.12 24 376.99 696.59 27.98 1.07
9 31.5 0.96 27 424.12 600.47 28.60 1.23
10 90 30.75 32.97 0.93 30 471.24 24 587.36 28.48 27.04 1.36
11 24.5 0.74 33 518.36 478.14 25.52 1.34
12 28.5 0.86 36 565.49 548.05 27.81 1.59
13 33 1.00 39 612.61 626.68 28.70 1.78
14 31.75 0.96 42 659.73 604.84 28.63 1.91
15 30.5 0.93 45 706.86 583.00 28.43 2.03
16 36.25 1.10 48 753.98 683.48 28.22 2.15
17 38 1.15 51 801.11 714.06 27.58 2.23
18 33 1.00 54 848.23 626.68 28.70 2.46
19 29.75 0.90 57 895.35 569.89 28.24 2.55
20 37.25 1.13 60 942.48 700.95 27.89 2.66
Total 27.83
Having the amounts shown in Tables 1 and 2, the profit made with the exchange of emitters was estimated from the difference between the estimated average yields with CUCH 90% and 70% respectively, as follows.
((27,83 23,71)1000)0,6 (2420,00)
R$1,992.00LTE (11)
It is important to note that the profit earned from the exchange of emitters obtained in the examples relates to the area irrigated by the equipment, which corresponds to approximately 1.0 ha, therefore the larger the irrigated area covered by the system of center pivot irrigation is, the higher the profit will be. It is also noted that the improvement of CUCH can substantially contribute to achieving higher incomes, corroborating the findings of CASTIBLANCO (2009).
Another important observation regarding the methodology involves the addition of precipitation in the yield calculation, considering that the larger this variable during the cycle, the smaller the difference of production and consequently the profit from the emitters refitting.
CONCLUSIONS
The methodology presented has met the purposes of this study since that based on it, it was possible to quantify the monetary value which represents the increase or decrease in the uniformity coefficient of water application, thereby attributing an economic significance to this coefficient, a fact which is scarcely studied.
ACKNOWLEDGMENTS
The authors thank the Ministry of Science and Technology (MCT), the National Council for Scientific and Technological Development (CNPq) and São Paulo Research Foundation (FAPESP), for financially supporting this research through the National Institute of Science and Technology in Irrigation Engineering (INCTEI).
REFERENCES
BERNARDO, S.; SOARES, A. A.; MANTOVANI, E. C. Manual de irrigação. 8. ed. Viçosa: UFV, 2008. 625 p.
CASTIBLANCO, C.J.M. Economia de energia em irrigação por pivô central em função da melhoria na uniformidade da distribuição de água. 2009. Dissertação (Mestrado em Irrigação e Drenagem) - Escola Superior de Agricultura “Luiz de Queiroz”, Piracicaba, 2009.
COELHO, R.D.; FOLEGATTI, M. V.; FRIZZONE, J.A. Simulação da produtividade de batata em função da regulagem do aspersor (sistema portátil). Revista Brasileira de Engenharia Agrícola e Ambiental, Campina Grande,v.2, n.3, 1998. Disponível em: <http://www.agriambi.com.br /revista/v2n3/273.pdf>. Acesso em: 12 abr. 2010.
FARIA, L.C.; COLOMBO, A.; OLIVEIRA, H.F.E.; PRADO, G. Simulação da uniformidade da irrigação de sistemas convencionais de aspersão operando sob diferentes condições de vento. Engenharia Agrícola. Jaboticabal, v.29, n.1, 2009. Disponível em: <http://www.scielo.br/scielo. php?script=sci_arttext&pid=S0100-69162009000100003&lng=pt&nrm=iso>. Acesso em: 9 abr. 2010.
FRIZZONE, J.A.; REZENDE, R.; GONÇALVES, A.C.A.; HELBEL, J.C. Produtividade do feijoeiro sob diferentes uniformidades de distribuição de água na superfície e na subsuperfície do solo. Engenharia Agrícola, Jaboticabal, v.27, n.2, 2007. Disponível em:
<http://www.scielo.br/scielo. php?script=sci_arttext&pid=S0100-69162007000300010&lng=pt&nrm=iso>. Acesso em: 9 abr. 2010.
HEERMANN, D.F.; HEIN, P.R. Performance characteristics of self-propelled center-pivot sprinklers irrigation systems. Transactions of the ASAE, St. Joseph, v. l, n.11, p.11-5, 1968. PAULINO, J.; FOLEGATTI, M.V.; ZOLIN, C.A.; SÁNCHEZ-ROMÁN, R.M.; JOSÉ, J.V. Situação da agricultura irrigada no brasil de acordo com o censo agropecuário 2006. Irriga, Botucatu, v.16, n. 2, 2011. Disponível em: <http://200.145.140.50/index.php/irriga/
article/viewFile/201/113>. Acesso em: 5 fev. 2012.
PINTO, J.M.; SILVA, C.L.; OLIVEIRA, C.A.S. Influência de variáveis climáticas e hidráulicas no desempenho da irrigação de um pivô central no oeste baiano. Engenharia Agrícola, Jaboticabal, v.26, n.1,2006. Disponível em: <http://www.scielo.br/scielo.php?script=sci_arttext&pid=S0100-69162006000100009&lng=pt&nrm=iso>. Acesso em: 9 abr. 2010.
RODRIGUES, T.R.I.; BATISTA, H.S.; CARVALHO, J.M.; ALEXANDRE, O.; GONÇALVES, A.O,; MATSURA, E.E. Uniformidade de distribuição de água em pivô central, com a utilização da técnica TDR na superfície e no interior do solo. Revista Brasileira de Engenharia Agrícola e Ambiental, Campina Grande, v.5, n.2, 2001. Disponível em: <http://www.scielo.br/scielo.
php?script=sci_arttext&pid=S1415-43662001000200002&lng=en&nrm=iso&tlng=pt>. Acesso em: 20 mar. 2010.