Cocoa has been recognized as a valuable source of polyphenols1,2, however epidemiological studies have shown a lower contribution of cocoa products3,4. These results
could be due to the fact that the most commonly used Food Frequency Questionnaires (FFQ) poorly distinguishes cocoa and chocolate products, and then its contribution may be underestimated. In spite there are several studies concerning polyphenol consumption, data do not point out cocoa and cocoa products as relevant sources which could be due to the scarce distinction between cocoa and chocolate products5,6. Additionally there is no known data about cocoa consumption within students who are
potential high consumers.
Considering this,the aim of this study was to validate a food frequency questionnaire to assess cocoa consumption (C-FFQ) in a population of university students.
Acknowledg men ts: We thank Eulàlia Rou re and J aume Se rra f rom the “Servei Educació Sani tària i Pro grames de Sal ut” in t he “Generalitat de Catalunya” for t heir as s is tance in the develop ment o f the F FQ. The s tudy was s upported by AGL2011.24279.
Filipa Vicente
1,2, Sandra Saldaña-Ruíz
1, Manel Rabanal
1, María J Rodríguez-Lagunas
1,3, Paula Pereira
2,
Francisco J. Pérez-Cano
1,3and Margarida Castell
1,31 Departament de Fisiologia, Facultat de Farmàcia, Universitat de Barcelona, 08028, Barcelona, Spain
2Instituto Superior de Ciências da Saúde Egas Moniz, Egas Moniz Cooperativa de Ensino Superior, Quinta da Granja - Campus Universitário, Portugal 3Institut de Recerca en Nutrició i Seguretat Alimentària, Universitat de Barcelona (INSA-UB); 08028, Spain, Barcelona.
D
EVELOPMENT AND VALIDATION OF A
F
OOD
F
REQUENCY
Q
UESTIONNAIRE TO
A
SSESS
C
OCOA
C
ONSUMPTION IN
U
NIVERSITY
S
TUDENTS
C-FFQ vs EFSA-Q C-FFQ vs 24HDR
Sp earman ’s co efficien t
(ρ) p
Sp earman ’s co efficien t (ρ) p
Hot Chocolate 0.341 0.015 n.d.*
Chocolate
snacks 0.479 0.000 0.320 0.023
Chocolate bars 0.330 0.019 0.279 0.050
Milk 0.429 0.002 0.358 0.011
Dark 0.569 0.000 0.330 0.017
Other 0.447 0.001
Dairy 0.666 0.000
Pastry 0.216 0.132
Desserts 0.118 0.416
Cereals 0.192 0.182
Spreads 0.228 0.112
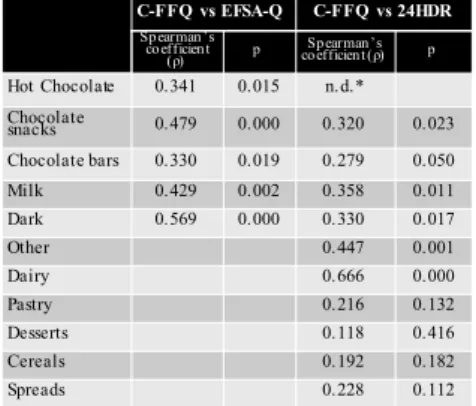
Table 3– Correlationsbetween the consumption chocolate-derived products (times/day) from the C-FFQ with that obtained from the EFSA-Q and the 24HDR.
Figure 2- Bland-Altman Plots for the daily intake frequencyestimated by either FFQ and EFSA-Q or C-FFQ and 24HDR. Solid lines are the mean difference and dashed lines are lower and upper 95% limits of agreement.
1Oxid. Med. Cell. Longev.2012, 2012, 906252 2 J. Chem.2013, 2013, 1–7
3 J. Nutr .2008, 138, 562–566. 4Br . J. Nutr .2011, 106, 1090–1099 5Nutr . Hos p.2008, 23, 242–252 6Nutr ition2014, 30, 236–239 7 Rev Es p Salud Publica2007, 81, 559–570 8 Eur . Food Saf. Author ity. Suppor t. Publ.2013, EN-394, 1–190
Table 1– Sample demographic characteristics. Data are
presented as average ±standard
deviation as well as range.
Table 4 – Classification of individuals regarding their consumption frequency for each of the foods considered of interest in the C-FFQ in three categories: high consumers, low consumers and non-consumers
e-mail:
franciscoperez@ub.edu
Introduction
Marterial and Methods
SampleA group of 50 university students (Table 1) has been recruited from several health science graduation and post-graduation programmes in the Faculty of Pharmacy at the University of Barcelona. The study was previously approved by the Ethical Committee of the University of Barcelona and has been conducted according to the guidelines laid down in the Declaration of Helsinki. Written informed consent from all students was obtained after the objectives and procedures have been presented.
Procedure
Students have filled an specifically designed FFQ (Figure 1) based on ENCAT-20037, a 24 Hours Dietary
recall and a validated questionnaire used as a gold standard, the “EFSA Gathering consumption data on specific consumer groups of energy drinks – Adults 18-65”
8.
Data management and Statistical analysis
The frequency of consumption obtained from C-FFQ and EFSA-Q has been converted to times daily. Data from both questionnaires have been compared as well as with 24HDR.
The agreement between C-FFQ with EFSA-Q and 24HDR has been evaluated with Bland Altman analysis. Spearman correlations test has also been conducted as well as the Wilcoxon test. The participants were classified in quintiles and proportions of subjects classified in the same, adjacent or grossly classified have been derived. Results were considered statistically significant at a two-tailedα
level of 0.05. Statistical analysis was performed using PASW Statistics version 18.
N 5 0
Ag e (y ) 2 4 .1 0 ±3 .2 9 [2 0 – 3 1 ]
Weig ht (kg ) 5 9 .6 8 ±8 .7 0 [4 1 – 8 0]
Heig ht (m) 1 .6 7 ±0 .0 7 [1 .4 8 – 1 .8 0]
BMI (kg /m2) 2 1 .4 2 ±2 .2 7 [1 7 .6 9 – 27 .6 8]
Figure 1 –TheC-FFQ was written in
Spanish and included90 food itemswith
clusters:
• Chocolate with cereals
• 12 most commonly consumed fresh
fruits, fruit juices, jam and canned fruit. • Intake of vegetables
• Products that can contain chocolate,
such as dairy, confectionery, kind of
chocolate bars, cocoa/chocolate
beverages and spreads.
• Intake of coffee, tea, infusions, wine (red, white or rosé), beer and other alcoholic beverages.
Results
Table 2– Consumption frequencyof a portion (times/day) of coffee and tea estimated by the C-FFQ, EFSA-Q and 24HDR (mean values and standard deviations).
C-FFQ EFSA-Q 24HDR
Hot chocolate 0 .0 1 4 2 ± 0.0 175 0 .0 4 6 4 * ± 0.0965 0 .0 0 0 0 ± 0.0 00 0
Chocolate
snacks 0 .3 2 2 8 ± 0.2 678 0 .1 4 2 9 * ± 0.1384 0 .3 2 0 0 ± 0.6 20 7 Chocolate Bars 0 .1 4 5 9 ± 0.1 341 0 .1 0 0 0 * ± 0.1127 0 .0 4 5 0 * ± 0.0991 White 0 .0 1 3 4 ± 0.0 259 0 .0 0 0 0 ± 0.0 00 0 .0 0 0 0 ± 0.0 00 Milk 0 .0 5 1 3 ± 0.0 785 0 .0 5 7 1 ± 0.1 04 1 0 .0 3 3 0 * ± 0.0818
Dark 0 .0 8 2 6 ± 0.1 051 0 .0 4 2 9 * ± 0.0829 0 .0 1 2 0 * ± 0.0627
Other products 1 .3 8 0 1 ± 1.5 036 0 .7 6 0 0 * ± 1.0606
0 .3 8 0 0 * ± 0.7796 Dairy 0 .6 2 1 1 ± 1.1 300
Pastry 0 .2 8 4 9 ± 0.3 430 0 .0 8 0 0 * ± 0.2740 Desserts 0 .1 5 6 4 ± 0.2 930 0 .0 6 0 0 * ± 0.2399 Cereals 0 .2 0 7 7 ± 0.3 821 0 .1 4 0 4 * ± 0.3981 Spreads 0 .0 9 9 0 ± 0.1 871 0 .0 8 0 0 * ± 0.2740
Total w/o others0 .4 8 2 9 ± 0.2898 0 .2 8 9 3 * ± 0.2 333 0 .3 6 5 0 ± 0.6 279
Total with others1 .8 6 3 5 ± 1.6075 No t ap p licab le 1 .1 2 5 0 ± 1.1 533
Conclusions
Bibliography
C-FFQ vs EFSA-Q C.FFQ vs 24HDR
Same q u in tile
Ad jacen t q u in tile
Gro ssly classified
Same q u in tile
Ad jacen t q u in tile
Gro ssly classified
Ho t cho co la te1 6 (3 2 %) 2 1 (4 2 %) 1 3 (2 6 %) n .d . Cho co la te
sna cks 1 1 (2 2 %) 2 2 (4 4 %) 1 7 (3 4 %) 1 1 (2 2 %) 1 6 (3 2 %) 2 3 (4 6 %) Cho co la te
ba rs 1 1 (2 2 %) 2 3 (4 6 %) 1 6 (3 2 %) 1 6 (3 2 %) 1 9 (3 8 %) 1 5 (3 0 %)
•White n .d .* n .d .* *
•Milk 1 1 (2 2 %) 2 3 (4 6 %) 1 6 (3 2 %) 1 5 (3 0 %) 2 1 (4 2 %) 1 4 (2 8 %)
•Da rk 2 0 (4 0 %) 1 8 (3 6 %) 1 2 (2 4 %) 1 6 (3 2 %) 1 5 (3 0 %) 1 9 (3 8 %)
Others:
n .d .
1 1 (2 2 %) 2 0 (4 0 %) 1 9 (3 8 %)
• Da iry 2 1 (4 2 %) 1 6 (3 2 %) 1 3 (2 6 %)
• Desserts 1 1 (2 2 %) 1 5 (3 0 %) 2 4 (4 8 %)
• Pa stries 1 1 (2 2 %) 1 6 (3 2 %) 2 3 (4 6 %)
• Sprea ds 1 2 (2 4 %) 1 5 (3 0 %) 2 3 (4 6 %)
• Cerea ls 1 6 (3 2 %) 1 2 (2 4 %) 2 2 (4 4 %)
To ta l with
o thers 2 0 (4 0 %) 2 1 (4 2 %) 9 (1 8 %) 1 5 (3 0 %) 2 2 (4 4 %) 1 3 (2 6 %)
To ta l witho ut o thers
2 0 (4 0 %)
2 1 (4 2 %) 9 (1 8 %)
1 1 (2 2 %)
1 8 (3 6 %)
2 1 (4 2 %)
In the present study, we assessed the validity of a 90-item FFQ designed for the precise evaluation of cocoa and chocolate products consumption (C-FFQ) through comparison to an EFSA-validated FFQ (EFSA-Q) and to a 24-hours dietary recall (24HDR). The results obtained show that this FFQ is able to provide precise data of frequency consumption for total and particular common cocoa products Moreover, distribution of participants according to their consumption frequency by these three methods is quite similar as reflected by a low misclassification among methods.