Examining the Effect of Company’s Size and Resources on the Relationship between Stakeholders’ Pressure and Environmental Strategies in the Malaysian Palm Oil Industry
1
Mohd Rafi Yaacob*, 1Mohd Nor Hakimin Yusoff 1
Faculty of Entrepreneurship and Business, Universiti Malaysia Kelantan, Malaysia *Corresponding e-mail: rafi@umk.edu.my
Abstract
Palm oil is one of the most important commodity exports for Malaysia. This industry contributes billions of ringgit to the country. In terms on number of employment half a million people involved in the industry. Due to its contribution, oil palm is known as a golden crop of Malaysia. Over the last four decades more and more plantation areas have been developed in the country. But nevertheless, the disproportionate expansion of this monoculture crops contributes to environmental degradations in the country. The excessive usage of insecticides and pesticides, soil erosion, air and water pollution and depletion of flora and fauna are closely related with this industry. As a result, various stakeholders including department of environment, environmental non-governmental organizations, medias and the public have exerted influenced on the industry to be environmentally responsible. Coping with these pressures, players the industry could not help but be environmentally responsible in their activities. In other words environmental strategies of players in the industry are determined by magnitude of pressures from their stakeholders. While it is well established in the literature that the extent of pressure would determine a business environmental strategies, but not many researchers measure the impact of company size and resources on the relationship between these two variables. This study seeks to examine the effect of a company’s size on the relationship between stakeholders’ pressure and environmental strategy in the Malaysian Palm Oil industry. The results of the study clearly show a company’s size and resources influence the relationship of stakeholders’ pressure and environmental strategy.
Keywords: company size and resources, stakeholders, environment, Malaysian palm oil industry
1. INTRODUCTION
Over the last four decades palm oil is one of the most important commodities for Malaysia. This industry contributes billions of ringgit to the country. In 2003 its earnings from foreign exchange contributed more than RM20 Billion (US$5 Billion), amounting for 45.9 percent of the export earnings from commodities and 6.5 percent of the whole country’s total export earnings (The Malaysia International Commodity Conference & Showcase, accessed on 12 June 2005 at http://www.miccos.com.my,). In terms on number of employment the industry provides employment to about 567,4000 workers in private plantations, government schemes and independent smallholdings; taken together with those who are linked to the palm oil industry in both the upstream and downstream sectors, approximately 1 million out of the total 10 million Malaysian workforce are engaged in the palm oil industry (Chandran, 2005). Due to its contribution, oil palm is known as a golden crop of Malaysia.
activities (Wong, 1998 p.2). Types of negative environmental impacts caused by the activities related to the industry are numerous. In planting, environmental impacts are deforestation, depletion of flora and fauna, soil erosion and sedimentation. In addition, air pollution occurs when operators use fire for land clearing. On the established plantations, various pesticides and artificial fertilizers are continuously applied for the ‘health’ of the oil palms. Additionally, processing of FFB at palm oil mills uses a large amount of fresh water, since for every tonne of FFB one tonne of water is required (Chuan, 1982 p.10). Untreated POME often pollutes rivers near to the mills. Moreover, palm oil mills emit black smoke when EFB are burnt for manure and to produce steam to sterilise FFB to facilitate the extraction of the palm oil. Due to of this range of harmful activities, the industry is one of the most highly regulated industries in Malaysia.
As a result, various stakeholders including department of environment, environmental non-governmental organizations, medias and the public have exerted influenced on the industry to be environmentally responsible. Coping with these pressures, players the industry could not help but be environmentally responsible in their activities. In other words environmental strategies of players in the industry are determined by magnitude of pressures from their stakeholders. While it is well established in the literature that the extent of pressure would determine a business environmental strategies, but not many researchers measure the impact of companies size and resources on the relationship between these two variables. Hence, this study seeks to examine the effect of a company’s size on the relationship between stakeholders’ pressure and environmental strategy in the Malaysian Palm Oil industry.
2. LITERATURE REVIEW
2.1 Stakeholders environmental pressure
The Stakeholder Theory emerged in the mid 1980s. One focal point in the movement was the publication of Edward Freeman’s book, Strategic Management: A stakeholder approach, in 1984 (Freeman & McVea, 2001 p.189). The central task in a strategic management process is to manage and integrate the relationships and interests of shareholders, employees, customers, communities and other groups in a way that ensures the long-term success of the firm (Freeman & McVea, 2001 p.192).
The term stakeholder is borrowed from the corporate governance literature, it connotes all the constituencies effected by or interested in the activities of a firm. Freeman (1984 p.46) defines stakeholder as ‘any group or individual who can affect or is affected by the achievement of the organization’s objectives.’ Another researcher Caroll (1996 p.60) defines a stakeholder as ‘any individual or group who can affect or is affected by the actions, decisions, policies, practices, or goals of the organization’. Meanwhile, Buchholz (1993 p.347) defines stakeholder as ‘[A]n individual or group that has some kind of stake in what business does and may also affect the organization in some fashion’. According to Clarkson (1995 p.106) ‘stakeholders are persons or groups that have, or claim, ownership, rights, or interests in a corporation and its activities, past, present, or future’.
also change in time and space. Second, Freeman’s definition is applicable to this study as its connotes strategic and moral values of stakeholders (Goodpaster, 1991). With the strategic stakeholder (the one who can affect a firm) there is a managing of interests of the stakeholder. The emphasis on managing the stakeholder makes this approach unidirectional in nature, with relationships being from a firm’s point of view. On the other hand, with the moral stakeholder (the one who is affected by a firm), stakeholder theorists seek some balancing interests.
A manager needs to understand the concerns of stakeholders in order to develop objectives that stakeholders would support for his or her organization’s long-term success. Therefore, business relationships with all stakeholders in developing effective business strategies should be explored (Freeman & McVea, 2001 p.190). The number of stakeholders and variety of their interests can be quite large; thus, a company’s decisions can become very complex (Henriques & Sadorsky, 1996 p.383; Post, Lawrence, & Weber, 1999 p.7). But in practice, it is difficult and costly to identify and meet all the stakeholders’ demands. Consequently, it is crucial for the manager to identify and analyze the meaning and significance of each individual group and to determine their respective power to be prepared for the conflict that may follow from the prioritizing of competing groups of stakeholders (Madsen & Ulhoi, 2001 p.79).
Each stakeholder has a unique connection with an organization, for example, stockholders have an ownership interest in the organization. Customers, suppliers, and retailers have different interests. Customers and suppliers are most interested in gaining fair value in the exchange of goods and money. Governments, public interest groups, and local communities wish to protect the environment, assure human rights, or advance other broad social interests (Post et al., 1999 p.12).
Traditionally the main focus of stakeholder interest has been upon the financial performance of a company. Indeed, the word stakeholder is in one way or another related to stockholder. Increasingly, however, stakeholder pressure is concentrating on the environmental performance of the company (Welford & Gouldson, 1993 p.7). Environmental pressure against palm oil companies may come from various stakeholders including environmental regulators such as Department of Environment, customers, suppliers and distributors, trade associations such as Malaysian Palm Oil Association, employees, shareholders, financial institutions, Malaysian Environmental Non Governmental Organizations (MENGOs), and Medias.
2.2 Environmental strategies
The word strategy has been borrowed from the military domain. It comes from a combination of two Greek words, stratos and agein, which respectively mean army and commander. In this perspective the word strategy literally can be defined as the art of commanding the army in the battlefield (Schaltegger, Burritt, & Petersen, 2003 p.173). In strategic management, business strategy is defined as ‘the direction and scope of organization over the long term which achieves advantage for organization through its arrangement of resources within a changing environment and fulfils stakeholder expectation’ (Johnson & Scholes, 2002 p.10). An environmental strategy is ‘a plan which aims to mitigate the environmental effects of the firm’s operations and products’ (Bansal, 1997 p.174). According to Sharma (2000 p.683) environmental strategy refers to ‘outcomes in the form of actions firms take for regulatory compliance and to those they take voluntarily to further reduce the environmental impacts of operations.’ Moreover, Banerjee, Iyer and Kashyap (2003 p.106) define environmental strategy as ‘the extent to which environmental issues are integrated with a firm’s strategic plans.’
environmental approach’ (Vastag, Kerekes, & Rondinelli, 1996); ‘corporate environmentalism’ (Banerjee, 1998, 1999); and ‘corporate greening’ (Preuss, 2005).
2.3 Company size and resources, and environmental strategy
Apart from stakeholders’ pressure, a firm’s size and its resources are seen as important factors that could determine companies’ environmental strategies. There are several arguments why the size of the business will be a determinant of environmental strategies. First, large companies are likely to have more resources, and that increases a company’s ability to a better access environmental information, which in turn provides the business more competitive advantage (Russo & Fouts, 1997; Sharma, 2000). Second, firm size has been related to the existence of economy of scale which is inherent in environmentally oriented investments (Chapple, Morrison, & Harris, 2005). Third, firm size is related to visibility to the public; where large businesses are more visible, this visibility might make them more sensitive to public opinion and in turn make them more likely to invest in environmental innovation and be perceived as an industry leader (Henriques & Sadorsky, 1996; Rothenberg & Zyglidopoulos, 2007). Fourth, larger companies have more power to influence regulatory authorities to set tighter standards for the industry (Epstein & Roy, 2000). Lastly, strategic management in small and medium-sized businesses focuses on short-term profitability, while on the contrary big businesses have a long-term vision, this puts big companies in a conducive situation to evaluate environmental investment (Epstein & Roy, 2000).
Although many authors believed that there was an impact of size on environmental strategy proactiveness, findings of empirical studies showed mixed results. On the positive side, a recent study by Elsayed (2006) of various businesses in the UK demonstrated that company size explained the different in environmental strategy. Likewise, Rothenberg and Zyglidopoulos (2007), in their recent study on the adoption of environmental innovations in the US printing industry, also found a strong correlation between size and environmental innovations. In a further study by Sharma (2000) on the 99 petroleum and gas businesses in Canada, he found company size (average annual sales for the last three years) had a positive effect on environmental strategy. In study of 197 companies of various industries in Belgium, Buysse and Verbeke (2003) found size (annual sales) moderate the relationship between environmental strategy and stakeholder orientation. In addition, a study of 750 large companies in Canada by Henriques and Sadorsky (1999) also found size (sales per assets) moderates the relationship between both regulatory stakeholders and community stakeholders on environmental strategy.
While the above-mentioned studies showed positive correlation between size of a company and its environmental strategy, other studies presented opposing findings. Using the survey data collected from a wide variety of firms and industries based in the US, Judge and Douglas (1998) examined the effect on size on environmental strategy of those companies, and found no significant correlation between size and environmental strategy. A further example is a study by Waddock and Graves (1997) who found no significant relationship - using three proxies for the firm size (i.e. total assets, total sales and total number of employees). Likewise, Toms’s study (2002) of 260 British companies found no significant correlation between company’s size (sales turnover) with either environmental reputation or environmental corporate disclosure.
strategic planning process. In a similar vein, Stanwick and Stanwick (1998) in their study concluded that environmentally responsible companies were likely to have more resources.
On the other hand, the recent study by Elsayed (2006) did not find any significant impact of the availability of resources on a company’s environmental orientation. This is further supported by study by Henriques and Sadorsky (1996) of various industries in Canada. In their study they found the level of environmental strategy proactiveness was not influenced by the resources owned by these companies. Similarly, a study by Toms (2002) in the UK found no support for the availability of resources influencing environmental strategy.
Due to inconclusive results regarding the effect of both size and resources of companies on their environmental strategies, more research is needed to investigate the relationship between both size and resources on environmental strategy proactiveness.
3. RESEARCH METHODOLOGY
Only private Malaysian palm oil companies involved in this research. Private companies are involved in this study for three main reasons. These companies are major players and increasingly more important to the industry. At present close to 60 percent of total area under oil palm in Malaysia is run by private palm oil companies. Since no more new oil palm plantation areas are available for development under FELDA (government scheme), at present and in the near future, the expansion of the plantations and other related activities will only come from these large palm oil companies. Secondly, private plantation companies are business organizations that have proper organizational structures that enable them to plan and implement corporate environmental management in their organizations. Although FELDA is another important industry member in the country, the organization is run like a cooperative and its management is directly controlled by the government. Finally, only the private plantation companies have the resources and capabilities to decide which strategies they want to pursue pertaining to corporate environmentalism in their organizations.
The list of palm oil companies on the Kuala Lumpur Stock Exchange (KLSE) was used as sampling frame of this study. Altogether 37 palm oil companies are listed on the stock exchange. There are two categories of palm oil companies; first - plantation companies whose main revenue comes from the palm oil industry; and second - diversified companies in which palm oil revenues are only part of their businesses activities. These companies not only have their own plantations (more than 10, 000 hectares to close 150,000 hectares) but also have their own palm oil mills. Only a handful of them have their own refineries. Some that are considered as main players in the MPOI have diversified into the downstream sector of the industry and have their own oleo chemicals plants. Many have expanded their business outside Malaysia, and are involved in plantation activities in Indonesia, Papua New Guinea and Solomon Islands. Others smaller companies only operate their businesses in Malaysia.
Due to the small number of private Malaysian Palm Oil companies, all of these companies were approached in the study. The details of these Malaysian palm oil companies were taken from the KLSE website. Since some have been involved in mergers and acquisitions due care was given when sending an invitation letter to parent companies. As well, the researcher needed to consider newly listed plantation companies on the stock exchange.
the study was explained, the number of prospective respondents in each company, and the confidentiality issues. As upper level management usually plays a vital role in design of environmental policy (Banerjee, 1998; Maxwell, Rothenberg, Briscoe, & Marcus, 1997) only those in positions at managerial levels were approached in the study. In each company, four participants from various managerial levels were sought to gain information.
Out of 37 palm oil companies nine companies voluntarily agreed to participate in the study, representing 25% of the total number of plantation companies on the KLSE. In each, four management personnel from various departments were approached. Altogether 36 surveys were completed.
Quantitative data analysis supports the central aim of the research model, which is to establish whether a relationship exists between selected independent variables and dependent variables. Based on the literature review on corporate environmental management, as well as the background information of the MPOI, two testable hypotheses have been developed for the study. Both a null hypothesis (Ha) and its alternative (Hb) have been developed for each:
Hypothesis 1
H1a Company’s size does not affect the correlation between stakeholders’ pressure and environmental strategies adopts by surveyed companies
H2b Company’s size affects the correlation between stakeholders’ pressure and environmental strategies adopts by surveyed companies
Hypothesis 2
H2a Company’s resource availability does not affect the correlation between stakeholders’ pressure and environmental strategies adopted by surveyed companies
H2b Company’s resource availability affects the correlation between stakeholders’ pressure and environmental strategies adopted by surveyed companies
Statistical tests aim to establish the probability of a specific event occurring from a set of possible events, expressed as proportion. If the probability distribution of p-value of a test is small, less than the significant level at 0.05, this would be used as evidence against Ha (null hypothesis). Rejection of Ha means accepting the alternative hypothesis (Hb). On the contrary, if the p-value is larger than the significant levels of 0.05, H0 fails to be rejected, on the basis that insufficient evidence has been recorded to justify the claim of significance (Hinton, 1995).
The Statistical Package for Social Science (SPSS), Version 14, was used to conduct all data analysis as well as hypothesis testing. Various statistical tests were performed on the data. Statistical techniques involved in this study were: data descriptives - mean, mode, median and standard deviation; a test of normality; reliability testing (Cronbach’s Alpha). Meanwhile, the two hypotheses of the study were tested using partial correlation analysis
management systems), (v) technological resources (e.g. unique technologies to produce quality products), and (vi) company’s reputation. These six major categories of resources were adopted based on a study by Grant (1991) on companies’ resources. The third section measured the managers’ perception of the pressure of stakeholders on their companies to improve their environmental performance. Using a scale of ‘1 = no pressure at all to 7 = a great deal of pressure’ respondents were asked to measure to what extent 14 identified stakeholders within the industry exerted influence on, or exercised power over, their organisations to be more environmentally responsible. Various stakeholders in this subscale were: shareholders, financial institutions, insurance companies, regulators, local communities, employees, media, customers, competitors, suppliers, distributors, ENGOs, and the MPOA and MPOB. The following section of the questionnaire, measured the company’s environmental strategies. This section was divided into three subscales: operational level, tactical level, and strategic level. Items in this section were adapted from those used in the studies examined in the extensive literature (Banerjee, 2001; Petulla 1987; Hunt and Auster 1990; Roome, 1992; Welford and Dodge 1995; Byrne and Kavanagh 1996; Hart 1997; Tilley 1999; Henriques and Sadorky, 1999) on corporate environmental strategies.
The surveyed data of thirty six individuals from the nine companies whose locations scattered across Malaysia (West and East Malaysia), were collected over five months, from mid April to mid August 2006. After the field work, the questionnaires were numbered and manually coded in SPSS for Windows. The data were then checked and corrected for coding and computer data entry errors. They were carefully examined and explored to understand the data and a potential relationship and differences among variables in the study.
3.1 Background of participated palm oil companies
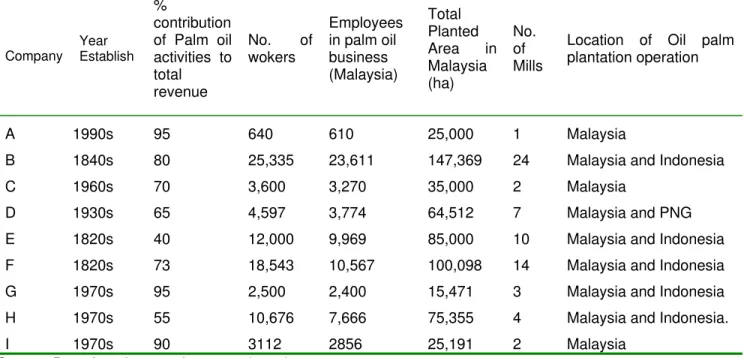
Altogether nine palm oil companies listed in the KLSE were involved in this survey. All companies were GLCs that were linked either to the federal or state governments of Malaysia. In order to disguise the surveyed companies they were given alphabetical designations - A to I. Table 1 shows details of the surveyed companies’ backgrounds.
Table 1: Participant companies’ backgrounds
Company Year Establish
%
contribution of Palm oil activities to total
revenue
No. of wokers
Employees in palm oil business (Malaysia)
Total Planted Area in Malaysia (ha)
No. of Mills
Location of Oil palm plantation operation
A 1990s 95 640 610 25,000 1 Malaysia
B 1840s 80 25,335 23,611 147,369 24 Malaysia and Indonesia
C 1960s 70 3,600 3,270 35,000 2 Malaysia
D 1930s 65 4,597 3,774 64,512 7 Malaysia and PNG
E 1820s 40 12,000 9,969 85,000 10 Malaysia and Indonesia
F 1820s 73 18,543 10,567 100,098 14 Malaysia and Indonesia
G 1970s 95 2,500 2,400 15,471 3 Malaysia and Indonesia
H 1970s 55 10,676 7,666 75,355 4 Malaysia and Indonesia.
I 1970s 90 3112 2856 25,191 2 Malaysia
3.2 Respondents’ profiles
Altogether thirty six participants from the palm oil companies were involved in the survey; each company was represented by 4 individuals who held various management positions. Obtaining multiple responses from both higher and middle management levels, and from various job categories, provided perspectives of corporate environmentalism from different levels and functional areas within a company. Table 2 shows respondents’ position, educational background, years in current position, and years working for their companies.
Table 2: Profiles of respondents from studied companies
Company Participant Current Position Educational
Background Years in Current Position Years in Company A 1 2 3 4 Estate Manager Estate Manager Mill Manager General Manager Degree Degree Degree Degree 6 6 2 5 14 6 5 14 B 1 2 3 4 Plantations Director Senior Estate Manager Mill Manager General Manager Diploma Degree Degree Diploma 4 1 10 1 28 21 16 32 C 1 2 3 4 Estate Manager Mill Manager Estate Manager Assistant Mill Manager
Certificate Degree Diploma Degree 17 5 12 3 26 5 16 3 D 1 2 3 4 General Manager Manager (Corporate) Environmental Officer Estate Manager Degree Degree Master Certificate 10 2 1 7 26 11 1 15 E 1 2 3 4
Visiting Agent *
Deputy Group Engineer Mill Manager Estate Manager Master Certificate Diploma Degree 13 10 3 6 26 25 3 6 F 1 2 3 4 Mill Manager
General Manager (Mills) General Manager (Mill operations)
General Manager (controller)
Degree Degree Degree Degree 4 2 10 12 11 17 15 22 G 1 2 3 4
Planting Advisor * Senior General Manager Group Engineer Estate Manager Diploma Degree Degree Master 10 10 10 4 25 20 21 23 H 1 2 3 4 Plantations Director Estate Manager Estate Manager Assistant Mill Manager
* Because of the same nature of the job, this position is categorised as general manager in SPSS analysis.
Source: Based on the sample survey (2006)
3.3 Company’s resources
Altogether, there were six items under the variable of company’s resources. Descriptive statistics of the company resources variable are shown in Table 3. All respondents (N=36) answered the items in the variable. In the scale 1 (scarce) to 7 (abundant), overwhelmingly, all respondents seemed to rate towards the high scale in regard to their company’s possession of resources. The highest mean and mode were for company’s reputation item - 6.28 and 7 respectively. Meanwhile, means of other resources were close to 6, except for technological resources, with its mean at 5.36. Among these resources, the two highest standard deviations were observed for financial resources (0.81) and technological resources (0.80) of which showed more deviation among respondents than other items. In contrast, organisational resources showed the lowest standard deviation, 0.62, indicates less deviation among respondents in their responses to the question. In general the differences among participants in this variable can be considered small, judging from variation being less than 1 in the 1 to 7 scale.
Table 3: Descriptive statistics of company’s resources
Descriptive statistics
Resources N Mean Media
n
Mode Min. Max. Std. Dev .
Skewness Kurtosis
Company’s
reputation 36 6.28 6.0 7 5 7
0.7
4 -0.51 -0.98
Organisational
resources 36 5.81 6.0 6 4 7
0.6
2 -0.59 1.22
Financial
resources 36 5.58 6.0 6 4 7
0.8
1 -0.11 -0.309
Physical
resources 36 5.58 6.0 6 4 7
0.6
0 -0.34 -0.07
Human
resources 36 5.56 6.0 6 4 7
0.6
9 -0.21 -0.01
Technological
resources 36 5.36 5.5 6 4 7
0.8
0 -0.41 0.70
Source: Based on the sample survey (2006)
Positive kurtosis of organisational resources and company’s reputation items indicated most answers from participants were closely clustered around the mode.
Overall, judging from all negative skewness values, and both positive and negative kurtosis, items under this variable, company’s resources were considered as not normally distributed.
3.4 Environmental Strategies
Overall environmental strategy level is also showed in table 4. Company F had the highest level of overall environmental strategies (m=5.84); this was closely followed by company B (m=5.72). For the other three companies, D, E, H their means were closely grouped at 5.18, 5.06 and 5.14 respectively. Two companies had their mean between 4 and 5 - company C (m=4.25) and company I (m=4.07). Companies A and G had the lowest means - 3.62 and 3.73 respectively.
Table 4: Levels of companies’ environmental strategies
Company Strategy A B C D E F G H I
Operational 4.89 5.50 5.45 5.29 4.89 5.42 4.95 5.84 5.05
Tactical 2.60 5.60 3.20 4.70 4.90 5.50 3.40 3.93 3.70
Strategic 3.36 6.05 4.09 5.55 5.41 6.61 2.85 5.64 3.45
Overall 3.62 5.72 4.25 5.18 5.06 5.84 3.73 5.14 4.07
Source: Based on the sample survey (2006)
3.5 Hypothesis Testing
In the test, the effects of control variables (plantation area and resources availability of companies) on the correlation between stakeholders’ pressure and environmental strategy can be observed by comparing zero-order correlations (without any control variable) with partial correlations (with control variable). Additionally, in the zero-order correlations, the correlation between the control variables (plantation area and resources availability) and stakeholders’ pressure and environmental strategies can also be observed, to see if there is any significant correlation between them.
Hypothesis 1
To evaluate the effect of the control variables for company’s size (that is, plantation size and number of employees of company) on the relationship between stakeholder pressure (average stakeholder pressure) and environmental strategies (average environmental strategy) the researcher performed a partial correlation (Pearson correlation). In this partial correlation the researcher used zero order correlations as basis of comparison.
Table 5: Zero order correlation and partial correlation between stakeholders’ pressures and environmental strategies using total planted area as control variable
Control Variables
Stakeholders’
pressure Strategy Area
None Stakeholders’ pressure
Correlation 1.00 0.77 0.78
Sign. (1-tailed) . 0.01** 0.01**
df 0 7 7
Strategy Correlation 1.00 0.92
Sign. (1-tailed) . 0.01**
Df 0 7
Area Correlation 1.00
Sign. (1-tailed) .
df 0
Area Stakeholders’ pressure
Correlation 1.00 0.23
Sign. (1-tailed) . 0.29
df 0 6
Strategy Correlation 1.00
Sign. (1-tailed) .
df 0
**Correlation is significant at the 0.01 level (1-tailed). Source: Based on the sample survey (2006)
On the other hand, the partial (Pearson) correlation control for company size (total planted area) is very low (0.23) and not statistically significant at 0.05 level. Based on this finding it is clear that plantation area of the company does influence the relationship between stakeholder pressure and environmental strategy. This is supported by the observation in the zero-order correlations, where both stakeholder pressure and environmental strategies are significantly correlated with the control variable (i.e. total planted area of oil palms) at a 0.01 significance level.
Table 6: Zero order correlation and partial correlation between stakeholders’ pressures and environmental strategies using number of employees as control variable
Control Variables
Stakeholders’
pressure Strategy Employee
s None Stakeholders’
pressure
Correlation 1.00 0.77 0.74
Sign. (1-tailed) . 0.01** 0.01**
df 0 7 7
Strategy Correlation 1.00 0.77
Sign. (1-tailed) . 0.01**
df 0 7
Employees Correlation 1.00
Sign. (1-tailed) .
df 0
Employees Stakeholders’ pressure
Correlation 1.00 0.47
Sign. . 0.18
df 0 6
Strategy Correlation 1.00
Sign. .
df 0
**Correlation is significant at the 0.01 level. Source: Based on the sample survey (2006)
So based on these two tests, the null hypothesis is rejected and the alternative hypothesis is accepted.
Hypothesis 2
The same statistical hypothesis testing was also used to determine the effect of another control variable, that is company’s resources (average resources), on the correlation between stakeholder pressure and environmental strategy.
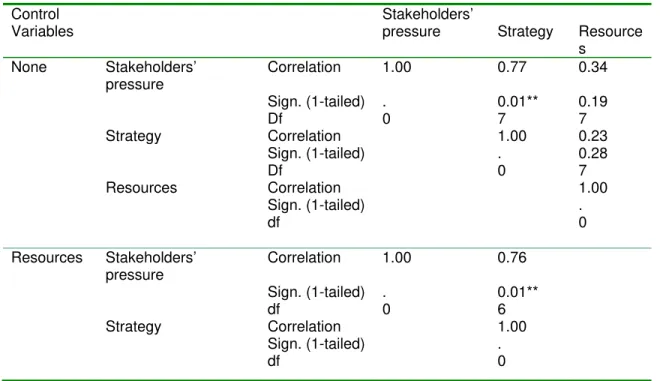
Table 7: Zero order correlation and partial correlation between stakeholders’ pressures and environmental strategies using company resources as control variable
Control Variables
Stakeholders’
pressure Strategy Resource
s None Stakeholders’
pressure
Correlation 1.00 0.77 0.34
Sign. (1-tailed) . 0.01** 0.19
Df 0 7 7
Strategy Correlation 1.00 0.23
Sign. (1-tailed) . 0.28
Df 0 7
Resources Correlation 1.00
Sign. (1-tailed) .
df 0
Resources Stakeholders’ pressure
Correlation 1.00 0.76
Sign. (1-tailed) . 0.01**
df 0 6
Strategy Correlation 1.00
Sign. (1-tailed) .
df 0
** Correlation is significant at the 0.01 level. Source: Based on the sample survey (2006)
Based on this finding it is clear that company’s resources does not influence the relationship between stakeholder pressure and environmental strategy This is supported by zero-order correlations, where both stakeholder pressure (r=0.34, p=0.19) and environmental strategies (r=0.23. p=0.28) are not significantly correlated with the control variable-of company’s resources. Therefore, this test shows that the null hypothesis fails to be rejected.
The impact of company’s size (number of employees and plantation area) was observable in the relationship between stakeholder’s pressure and environmental strategy; but there was no observable impact from company’s resources.
4. DISCUSSION AND CONCLUSION
large companies in Canada, which established that the size of a company moderates the relationship between stakeholders’ pressure and a company’s environmental strategy.
The results of this study also showed a significant positive relationship between size (i.e. plantation area and number of employees) and both stakeholders’ pressure and environmental strategy. This tends to imply that the larger the size of palm oil companies, the more likely that they will get pressure from stakeholders, and the more likely that they exercise a proactive strategy, and vice versa. This finding of a strong correlation between size and environmental proactiveness supports studies elsewhere by Elsayed (2006), Rothenberg and Zyglidopoulous (2007) and Sharma (2000). Hence is clear that the area of palm oil plantations related to stakeholders pressure. The respondents of the big companies admitted that due to their plantation area they are more vulnerable, as they are more visible to the public. This makes them more sensitive to public opinion, in turn makes them more likely to invest in environmental innovation to avoid negative publicity. For example, the expansion of the oil palm plantations is always associated with deforestation and depletion of flora and fauna. The big plantation companies who are involved in massive deforestation will be easily vulnerable to such kind of an accusation. Hence, to anticipate and manage stakeholders’ pressure, especially from ENGOs and the public, big companies exercise a proactive strategy. At the same time, they believe by doing so they could project their images to gain a better corporate reputation.
The average from responses of the four managers of each palm oil company in the study was used to represent a company’s resources - financial resources, physical equipment, human resources, management systems, technology, and reputation. The results of quantitative analysis showed that resources did not affect the relationship between stakeholder’s pressure and environmental strategy. This finding seems to support previous studies undertaken elsewhere by Elsayed (2006), Henriques and Sadorsky (1996) and Toms (2002). Nonetheless, these findings need to be treated with caution. Arguably, as explained in the previous chapter, the researcher suspects that respondents were more likely to exaggerate their companies’ resources in the survey. This is evident as, whatever the size of their company, respondents rated all resources variables at the high end of the scale. As a result, large companies and medium size companies in the study showed no difference. To validate this argument, the researcher compared the resources of one company, a medium size and newly listed company under the KLSE, with a number of multinational companies. Surprisingly it was rated as having higher resources than the multinational companies in the study. Perhaps, a more accurate alternative for measuring resources would be based on financial ratios from annual reports, rather than the multi-scale items measure as used in the study. Nevertheless, financial ratio statistics only provide information on financial resources of a company. Financial resources alone are not enough to explain other resources, such as physical resources, human resources, control systems, technological resources, and company reputation. All of this information is not usually available in a company annual report.
References
Banerjee, S. B. (1998). Corporate environmentalism: perspectives from organizational learning.
Management Learning, 29(2), 147-164.
Banerjee, S. B. (1999). Corporate environmentalism and the greening of strategic marketing: implications for marketing theory and practice in M. Charter & M. J. Polonsky (eds.),
Greener marketing: a global perspective on greening marketing practice (2nd ed.). Sheffield: Greenleaf Publishing.
Banerjee, S. B. (2001). Managerial perceptions of corporate environmentalism: interpretations from industry and strategic implications for organizations. Journal of Management Studies, 38(4), 489-513.
Banerjee, S. B., Iyer, E. S. & Kashyap, R. K. (2003). Corporate environmentalism: antecedents and influence of industry type. Journal of Marketing, 67(2), 106-122.
Bansal, P. (1997). Business Strategy and the Environment in P. Bansal & E. Howard (eds.),
Business and the natural environment (p. 173-194). Oxford: Butterworth-Heinemann. Brammer, S. & Millington, A. (2004). The development of corporate charitable contributions in
the UK: a stakeholder analysis. Journal of Management Studies, 41(8), 1411-1434. Bryant, R. L. (1992). Political ecology: an emerging research agenda in Third-World studies.
Political Geography, 11(1), 12-36.
Buchholz, A. R. (1993). Principles of environmental management: the greening of business. Englewood Cliffs, N.J.: Prentice Hall.
Buysse, K. & Verbeke, A. (2003). Proactive environmental strategies: a stakeholder management perspective. Strategic Management Journal, 24(5), 453-470.
Byrne, K. & Kavanagh, D. (1996). Strategic environmental management in the Irish chemical/pharmaceutical industry. Business Strategy and the Environment, 5(2), 106-114.
Carroll, A. B. (1979). A three-dimensional conceptual model of corporate social performance.
Academy of Management Review, 4(4), 497-505.
Chandran, M. R. (2005). Competitiveness of Malaysian palm oil industry. Paper presented at the Australia-Malaysia FTA Conference, held in Melbourne, 10 March 2005.
Chapple, W., Morrison, C. J. & Harris, R. (2005). Manufacturing and corporate environmental responsibility: cost implication of voluntary waste minimisation. Structural Change and Economic Dynamics, 16(3), 347-373.
Chuan, G. K. (1982). Environmental impact of economic development in Peninsular Malaysia: a review. Applied Geography, 2, 3-16.
Clarkson, M. E. (1995). A stakeholder framework for analyzing and evaluating corporate social performance. The Academy of Management Review, 20(1), 92-117.
Elsayed, K. (2006). Re-examining the expected effect of available resources and firm size on firm environmental orientation: an empirical study of UK firms. Journal of Business Ethics, 65, 297-308.
Epstein, M. J. & Roy, M.-J. (2000). Strategic evaluation of environmental projects in SMEs.
Environmental Quality Management, 9(3), 37-47.
Freeman, R. E. (1984). Strategic management a stakeholder approach. Boston: Pitman.
Freeman, R. E. & McVea, J. (2001). A stakeholder approach to strategic management in M. A. Hitt, R. E. Freeman, J. S. Harrison (eds.), The Blackwell Handbook of Strategic Management, Oxford: Blackwell.
Goodpaster, K. E. (1991). Business ethics and stakeholder analysis. Business Ethics Quarterly,
1(1), 53-73.
Hart, S. L. (1995). A natural-resource-based view of the firm. Academy of Management Review, 20(4), 986-1014.
Hart, S. L. (1997). Beyond greening: strategies for a sustainable world. Harvard Business Review75(1) 66-76.
Henriques, I. & Sadorsky, P. (1996). The determinants of an environmentally responsive firm: an empirical approach. Journal of Environmental Economics and Management, 30(3), 381-395.
Henriques, I. & Sadorsky, P. (1999). The relationship between environmental commitment and managerial perceptions of stakeholder importance. Academy of Management Journal, 42(1), 87-99.
Hunt, C. B. & Auster, E. R. (1990). Proactive environmental management: avoiding the toxic trap. Sloan Management Review31(2), 7-18)
Johnson, G. & Scholes, K. (2002). Exploring corporate strategy (6th. ed.). Harlow, England: Financial Times Prentice Hall.
Judge, W. Q. & Douglas, T. J. (1998). Performance implications of incorporating natural environmental issues into the strategic planning process: an empirical assessment.
Journal of Management Studies, 35(2), 241-262.
Madsen, H. & Ulhoi, J. P. (2001). Integrating environmental and stakeholder management.
Business Strategy and the Environment, 10(2), 77-88.
Malaysia International Commodity Conference & Showcase. Retrieved from http://www.miccos.com.my
Maxwell, J., Rothenberg, S., Briscoe, F. & Marcus, A. (1997). Green schemes: corporate environmental strategies and their implementation. California Management Review, 39(3), 118.
Moir, L. (2001). What do we mean by corporate social responsibility? Corporate Governance, 1(2), 16-22.
Petulla, J. M. (1987). Environmental management in industry. Journal of Professional Issues in Engineering, 113(2), 167-183.
Post, J. E., Lawrence, A. T. & Weber, J. (1999). Business and society: corporate strategy, public policy and ethics (9th ed) New York: Irwin McGraw-Hill.
Preuss, L. (2005). Rhetoric and reality of corporate greening: a view from the supply chain management function. Business Strategy and the Environment, 14(2), 123-139.
Roome, N. (1992). Developing environmental management strategies. Business Strategy and the Environment, 1(1), 11-24.
Rothenberg, S. & Zyglidopoulos, S. C. (2007). Determinants of environmental innovation adoption in the printing industry: the importance of task environment. Business Strategy and the Environment, 16(1), 39-49.
Russo, M. V. & Fouts, P. A. (1997). A resource-based perspective on corporate environmental performance and profitability. Academy of Management Journal, 40(3), 534-559.
Schaltegger, S., Burritt, R. & Petersen, H. (2003). An introduction to corporate environmental management: striving for sustainability. Sheffield: Greenleaf.
Sharma, S. (2000). Managerial interpretations and organizational context as predictors of corporate choice of environmental strategy. Academy of Management Journal, 43(4), 681-697.
Shrivastava, P. & Scott, H. I. (1992). Corporate self-greenewal: strategic responses to environmentalism. Business Strategy and the Environment, 1(3), 9-20.
Stanwick, S. D. & Stanwick, P. A. (1998). Corporate social responsiveness: an empirical examination using the environmental disclosure index. International Journal of Commerce and Management, 8(3), 26-40.
Sternberg, E. (1997). The defects of stakeholder theory. Corporate governance: An International Review, 5(1), 3-10.
Tilley, F. (1999). Small-firm environmental strategy. Greener Management International, 25(Spring), 67-80.
Toms, J. S. (2002). Firm resources, quality signals and the determinants of corporate environmental reputation: some UK evidence. British Accounting Review, 34(257-282). Vastag, G., Kerekes, S. & Rondinelli, D. A. (1996). Evaluation of corporate environmental
management approaches: a framework and application. International Journal of Production Economics, 43(2-3), 193.
Waddock, S. A. & Graves, S. B. (1997). The corporate social performance - financial performance link. Strategic Management Journal, 18(4), 303-319.
Welford, R. & Gouldson, A. (1993). Environmental management and business strategy. London: Pitman.