Modelling of upwelling in the coastal area of Cabo Frio
(Rio de Janeiro - Brazil)
Carlos Carbonel
Laboratorio Nacional de Computação Científica (LNCC/CNPq)
(Lauro Müller 455, Botafogo-22290-160, Rio de Janeiro, RJ, Brazil)
Abslracl: A 1 1Iz reduced-gravity model is proposed to study the hydrodynamic and
thermodynamic features of the coastal upwelling area of Cabo Frio (Rio de Janeiro-Brazil). The vertical structure of the model is described by an active layer overlaying a deep inert layer where the pressure gradient is set to zero. For lhe upper layer, the model includes the turbulent version of the momentum, continuity and heat equations. The conservation of heat is represented by a transport equation to describe the thermodynamic changes of the sea surface temperature (SST). The solution domain includes open boundaries in which weakly-reflective conditions are prescribed. Solutions are found numerically on a uniform grid and the fundamental equations are approximated by the finite difference method. Numerical experiments are performed to evaluate the dynamic response of the coastal area of Cabo Frio forced by uniform and non-uniform wind fields. The solutions differ considerably depending on the orientation of the winds. East and northeast winds correlate with colder waters in the zonal coastline of this area and the presence of flows toward Cabo Frio correlates with north wind components. The proposed model is validated with the numerical simulation of an observed event of upwelling, where a time-dependent and non-uniform wind field develops a SST pattern similar as the observations, particularly the extension of the cool water plume in south-west direction and the rapid time variation ofthe SST.
Resumo: Um modelo de gravidade reduzida de I 1Izcamada é proposto para estudar as
características hidrodinâmicas e termodinâmicas da área costeira de Cabo Frio (Rio de Janeiro
-Brasil). A estrutura vertical do modelo é descrita por uma camada ativa sobre uma camada profunda sem movimento onde o gradiente de pressão é zero. Para a camada superior, o modelo incluí a versão turbulenta das equações de momentum, continuidade e calor. A conservação do calor é representada por uma equação de transporte para descrever os câmbios da temperatura superficial do mar (TSM). O domínio de solução incluí fronteiras abertas onde condições debilmente retletantes são impostas. As soluções são obtidas numericamente numa malha uniforme e as equações são aproximadas usando o método de diferenças finitas. Experimentos numéricos são efetuados para evaluar a resposta dinâmica da área costeira de Cabo Frio gerada por distribuições de ventos uniformes e não uniformes. As soluções diferem bastante dependendo da orientação dos ventos. Ventos E e ventos NE correlacionam com águas fi'ias na linha costeira zonal desta área, e a presença de correntes na direção de Cabo Frio correlacionam com componentes de vento N. O modelo proposto é validado com uma simulação numérica de um evento de ressurgência, onde uma distribuição de vento não uniforme e dependente do tempo gera uma distribuição de TSM similar às observações, particularmente a extensão das águas frias na direção SO e as variações da TSM no tempo.
Descriplors:Coastal upwelling, Numerieal modelling, Cabo Frio.
2
Introduction
Coastal upwelling is an important process because it brings nutrient rich water to the surtàce, thereby allowing the development of phytoplankton blooms. Furthermore, the coastal currents and vertical mixing within the diurnal thermocline provide a way of dispersing pollutants that are located close to ports or industrialized cities. Coastal circulations are often characterized by a meander-like surface flows (Guillen & Calienes. 1981), associated with the presence of cold sllrt~lce temperatures in form of plumes and intrusion of warm oceanic waters. Coastline geometry, bottom topography as well as the driving wind fields, are ali likely important for determining the transient response of coastal areas (Hurlbllrt, 1974; McCreary & Kundu, 1988). Major areas of coastal upwelling are located off the Peruvian coast, Oregon coast (USA) and northwest Africa. However, coastal upwelling also occurs at many other places in the world oceans, including the coastal area of Cabo Frio in Rio de Janeiro (AlIard 1955; Mascarenhas el. ai.,
1971; Ikedael. ai., 1974).
There are numerous papers about circulation in coastal areas, some ofthem using analytical methods (Crepon & Richez, 1982, McCreary el. aI., 1989). Numerical models have difficulties simlllating coastal upwelling events, for the reason that some processes and features such as the upwelling, downwelling, coastal jets and mixing are very poorly resolved by their grids, because the coastal region of interest is generally part of a much larger complltational domain. Additionally, the delimitation of the complltational domain implies that it is TlL'L'l'''"an to define <;lIitahk hOllTld:IT"\ condi!I<1Tl'
Rev. bras. oceanogr.. 46( I). 1998
at open boundarie$. Many types of open bOllndary conditions have been reported, ali with the purpose of trying to eliminate the artificial retlection of waves at the open bOllndaries(Chapman, 1985). The open boundary conditions, based on the characteristic form of the governing equations for shallow water waves (Verboom, 1982), cOllld be very effective for sitllations encountered in estllaries (Verboomel. aI.. 1983) and for wind-driven ocean problems (Carbonel, 1982, 1992).
The purpose of this work, is to investigate using a I Y2layer model, the wind driven llPwelling dynamic of the coastal region of Cabo Frio, particularly the generation and evolution of upwelling plumes, which is an observed feature in this region. This paper describes idealized numerical ca\culations that simulate the coastal ocean's response to uniform east, uniform north, and non-uniform northeast winds. Next, it goes on to simulate the time dependent. respo~e of the model to a wind like that observed during an upwelling event along the Cabo Frio Coast (1971), and compares the solution with available observations in space and time.
The observational background of the coastal area of Cabo Frio
The coastal region of Cabo Frio is located in the Central-Southern Brazilian littoral (Fig. I) and is characterized by the occurrence of coastal upwelling events. The bottom topogt!tphy is smooth and flat, with the contours depth tending to follow the coastline. The maximllm depth in this coastal area is around 150 meters. The hydrology of the
water column near Cabo Frio is normally characterized by a thermocline that fluctuates according to the intensity and direction ofthe winds.
The first evidence for upwelling in this coastal area was reported by Allard (\955), indicating a strong correlation between colder water temperatures and northeast wind, and viceversa. In this region, the coastal upwelling is very sensitive to wind changes (Valentin,el. ai., 1987) and two main austral seasons are cIearly defined:
a) a spring-summer season, with the tropical maritime anticyclone being established and prevailing E-NE winds favorable to upwelling, and
b) an autumn-winter season, with &equent, passages of cold, polar &onts, and a rapid succession of changing wind cycles unfavorable to upwelling.
An interesting and commonly observed feature of the upwelling in this region is that a tongue' of cold water develops off Saquarema. These upwelling events in the coastal region of Cabo Frio were reported by several authors since 1959, but the contribution of Ikedael. a!.,(1974) provides thc best description of an upwelling event due to the extensive amount of observations taken. An interesting result was the rapidity of the upwclling process, with the sea surface temperature (SST) attaining its minimum value approximately 24 hours after the first signs of upwelling had appeared. The spatial development and variation of the cold tongue of Sea Surface Temperature was no-Iess surprising:
lhe upwelling minimum intensified at about 30
nautical miles to the west of Cabo Frio (Fig. 2), and a core of high salinity water moved upwind towards Cabo Frio at an average speed of 1/4 knot, presumably being advected by a surrace countercurrent. The possibility for existence of such a current was indicated previously by Mascarenhas el. ai. (1971). Southwest winds, caused by atmospheric cold polar fronts, change the circulation pattern of this coastal area by reversing the alongshore currents and generating gyres (Stech & Lorenzzctti,
1992; Torres & Santana, 1994).
The model
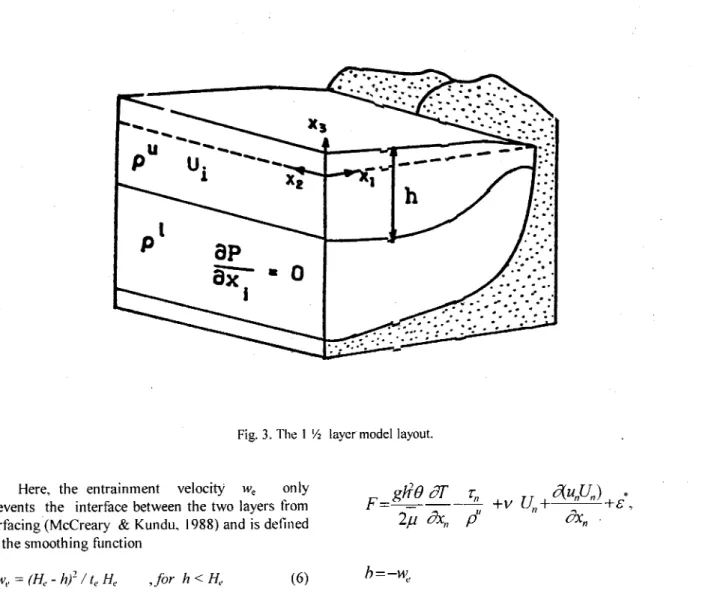
The model used in this study, has an active layer overlaying a deep inert layer where the pressure gradient is set to zero. We use a Cartesian coordinate system where Xi represents the planar coordinates and the usual summation convention with repeated indices is used. A schematic view of lhe coastal ocean mode! is presented in Figure 3 .
For the modeling of the coastal ocean the vertically-integrated non-linear equations of momentum, continuity and transport of SST, are used.
The basic equations are the following :
ô U Ô u. U ô h hB ô T ..
---~+ I'+c..u.+gh{a--~- +~ :+vU--'-=O
ô t ô XI 'I' Ô Xi 2# Ô Xi 'p"
(1)
(2)
aT aT -+u-+q;=::O
aI 'aXi (3)
where
(
O -f)
_
11 / I_
( I 11 )/ I
c."
=
' 11- P p, (j - p - p p,'I f
o
j.1=j.1/(j.1-(j)
and Ui, are the velocity components. Ui = Uih denotes the corresponding momentum flux in the upper layer and h represents the upper layer thickness. The wind stress components are represented by r; , v is the Raylcigh &iction coefficient representing the sum of ali the dissipative losses, f is the Coriolis parameter and p" ,ri are ocean water densities in the upper and lower layer respectively. The quantityp"varies in function ofthe temperature T. according to the expression
p"=ri[1-()(T-r)] andri is always constant. The sea surface temperature (SST) is represented byT.the constant temperature in the lower layer is represented byTI, and the constant () is the coefficienl of thermal expansion. The quantity q denotes thc source of cooling and warming ofSST, and it is approximated by
q= ú) T*/h ,for T>
T
(4)q=O ,for T;'{ T, (5)
4 Rev. bras. oceanogr., 46( I), 1998
4Z'
41'
Fig.2. Chartsofsinoptic observations(lkedael aI..1974).In the upperpaneLSSTfieldwith intormationcollectcdtrom14:00
..
.. .
..
:
.:....
.. ...
.. ..
. .
. .- .
.
.. ... J"
:...
. '."< :'. :~:.::':;
;
:;:'.:~y ~':: ;:<;:
Fig. 3. The I Y2layer modellayout.
Here, the entrainment velocity We only prevents .the interface between the two layers from surfacing (McCreary & Kundu, 1988) and is delined by the smoothing function
,for h<He (6)
(7)
where Heis the entrainment thickness and I,. the entrainment time-scale.
For the coastline, non-slip boundary conditions are prescribed and homogeneous conditions for11,T are assumed. The weakly reflective condition applied at the open boundaries, based on the character.istic method, is written in an axis normal to the boundary (x,,),in the following form:
ô(UnIch) +c O(UnIch) +G=O
Ot
oXn
(8)where,
c
=
~gah
, andG
=
FIChand f.*is the Coriolis term in the normal direction.u" ,U"denote the velocity and flux along the axis x". The weakly reflective conditions in the upper layer are defined by the in-going characteristic of the presented equations.
Finite difference solution scheme
The basic equations for the I 1/2 layer model, can be written in a general matrix form as :
oZ
oZ
OZ
-+A-+B-+fC+D\Z+E=O
01 - Oxl
-
Ox2 ~ _J(9)
6
gh2B/
iP
]
O ,
O
Uj
ç=
[
O - f O O
]
f O O O ,
O O O O
O O O O
[ U2
~= O
O O
[
V O O O
]
Q=OvOO,O O O O O O O O
To establish the numerical mode!, we introduce a set of points (XI,X2.t)= (kL1x1, 1L1x2. m,1t)of a discrete grid. The discrete vector variable Z(XIoX2.t)was placed in the same nodes of the grid such that the vector variable is described in the grid as Z;, = Z(kt:.xi,lt:.x2,mM).
The finite difference approximation is based in centered differences in space and a forward difference in time using a dissipative interlàce. Considering ~I
=
~2 and defining the centered difference operator 8 and the forward differcnce operatorÂas:Rev. bras. oceanogr., 46( I), 1998
4(2;/1,I)
_
2;1,12&- Z; 11, 'where
4,/ =az;': 1,/+aZ;~1,/+(1-4a)z;;,~+az;':'+i +az;'J-1 (lI)
is the dissipative interface ; then the finitc difference formulation takes the Lax-Wendroff scheme form
 m(ZZ:,)+A 4C4~,)+f} 4( Z!:,,)+ÇZ;',+I! 4,71+E~~,=0
(12) where Z represent the mean value vector. The parameter (Xranges in the interval O<a::;1/4 . If a = 1/4 the resulting scheme is the called Lax scheme. Here. it ir>used the value of a =1/8. In each open boundary poínt there are flux and levei llnknowns. First. the fluI' at the boundaries is evalllated using the finíte-dífference approximation described by (12), but replacin~ the centered finite-ditTerence O; opera to r by lateral finite-difference operator 9 B
whereRreprer>entsthe variable and the subscript"B" indicatcs the boundary point, and the decreasing poi!1ts "8-1.8-2" are interior points in an axis normal to the boundary. Afier that, we obtain h at m+ I time leveI, solving equation (8) by the following approximation,
U::1 hmtl
li..
*[_FI!;C, FI
]-[
FI:tchFl] +c Q(T71/1+clf" )+G.Il-O!y VB uB- /I
B-(14) where U* and h*are the dissipative intertàce for U
and hat the boundary points.
Results
spatial structure. Unless specified otherwise, the paral11eter used in the experiments, are the following: The tluid in the layers are initially at rest and the initial value ofh=30 m. The densities are assumed p/=1024kg/m3, p' = 1025 kg/m3. The Coriolis parameter correspond to the 23°S and taken as
I
= -5.68 X 10⁻⁵ sec-1. The Rayleigh friction coefficient is fixed at v=2x I0-5 sec-1 . The initial temperatures in the layers are assumed as T = 23°C andT
= 15°C and the coefficient of thermal expansion is () = 2.6xI0-4 (OCr'. The time step is ~t=600sec, the entrainment thickness is fixed inHe= 30 m and te = 1f4 day. The coastal ocean is limited to a rectangle of 1° 30' by 1° using an uniform grid spacing of ~x = I/60° ; the number ofdynamic grid points are 3902. The computational boundaries are partly open and partly closed.It was necessary several experiments to chose the mentioned parameters which are the mores adequate to simulate the mean features of the hydrodynamic and thermodynamic transient response of the coastal waters of Cabo Frio (calibrated which the numerical simulation described in scction Numerical simulation of a time-dependent upwelling event).
Response to uniform east winds
Figure 4 shows the model response at day 2 and 5 when it is forced by uniform east winds (L,=0.16N/mz).
At day 2, along the zonal coastline. an upwelling band is generated by the geostrophic motion of waters in the upper layer shoaling lhe h tield, increasing the entrainment intluence and decreasing T.The cooling of the SST is significant, decreasing by almost 7°C in the alongshore bando Due the coastline configuration the band is initially extended up to the Cabo Frio cape. In the meridional coastline ofthe coastal region there are not signals of upwelling.
At day 5 the colder water band, generated along the zonal coastline. is wider and turns around the Cabo Frio. This is due dynamical consequences of the coastal configuration (cape) which generates Kelvin waves in a manner similar to the wind variability as reported by Creponet aI.(1984).
During the experiment, the current system shows a wind dependent response. Along the zonal coastline it is possible to note that close to the shore, the alongshore velocity component is stronger in comparison to the offshore side, indicating lhe presence of a coastal jet.
In Figure 5, is presented the time dependent variation of the velocity components and SST off Saquarema and Buzios. In the zonal coastline (off Saquarema) the cooling of the waters reaches the minimum of 15°C in an periqd as short as 2 days and the velocity components show a tlow in eastward direction (u, < O ) with a small component in southward direction ( uz<O) and when the waters reach the minimum SST of 15°C, the velocity component in offshore direction increases and the alongshore component decreases (because theterm ôT/Ox, is suppressed and intluence ofthe term
-
luz increases).In the meridional coastline (off Buzios), the onshore tlow (U1component) forced by the wind during the first stages is suppressed shortly thereafter (14 hours) the first signals of cooling of the SST, due the Kelvin wave motion (see SST offBuzios).
Response to uniform north winds
Figure 6 shows the model response at day 2 and 5 when it is forced by north winds (Lz=0.16N/mz). In the zonal coastline, dose to the shore, the upwelling is weak in comparison to the upwelling generated in the east wind case. The presence of cold upwelled water is due the ageosttophic motions only, forced by the nort!~',vindo In the offshore side due the gcn"ti"ol':1icinfiuence a zonal current is generateõ:1.)wing in eastward direction. This can explain dlc countercurrent reported in many occasions in this coastal area.
In the meridional coastline of this region, upwelling centers are g":;1erated with a stronger intensity in the downwind side of the capes as observed at day 2. At day 5 the favorable winds help to increase the cold upwelling bando The area of stronger upwelling is extended up to Cabo Frio.
In Figure 7 is presented the history of SST and the velocity components in the control poinls. The SST reaches a minimum only at nay :; oll Buzios. Note that the u, component off l3uziús increases a little more during the day 5, after the SST reaches the minimum at day 4. In the control point off Saquarema, the tlow is going offshore with a detlection in eastward direction (u, >0).
Response to a non-uniform wind field
Rev. bras. oceanogr.. 46( I), 199~
17
DAY2
S.quareDla
_._~- ,.. .,- "..'"",..,..",..-" "...-... .., " " ",..""".." "..,;, " , ..
, , , ,..", ", " ,..., ,, .. , ,...,.." "" ""..., ,..., ,---" ,...----....
"'*'-"'-"...",-,...,-,.., ",-,...,...", --" ",,.,. ,,,"-...-...
~~ ;::;: x~
":';-:.:.::.;"..", ,."",..., , ,..."..,i!!:t."...~
""" """ "
0.15 0.1 0.05
-0.05 -0.1 -0.15 -0.2 -0.25
O
SSToffSaquarema-SST off Buzios
---...
"
...... ...
...----.-...
,
1, '2. 3
TIme (days)
4 5
U1 off Saquarema -U2 off Saquarema
---U1 off Buzios ... U2 off Buzios
--1 2 3
lime (days)
4 5
Fig. 5. Time history 01'SST and velocity components ofl' Saquarema and Buzios (5 km in front) for the east wind solution.
24
22
I-
20
cn
cn
18
16
l
10 Rev. bras. oceanogr., 46(1), 1998
DAY2
19\
DAY5
16\
SaauareUla
...-....-...
SST off Saquarema
-SST off Buzios---\
",
... "....
".
...
..---...-.---1 2 3
Time(days)
4 5
U1 off Saquarema
-U2 off Saquarema ---U1 off Buzios
U2 off Buzios
--:...--...-..
..,....---.\\
\
"'---.---1 2 3
Time(days)
4 5
Fig. 7. Time history 01'SST and velol:ity componentsolTSaquarema and Buzios (5 km in front)
lor the north wind solution. '
1'02(t) are time dependent functions. The Figure 8 shows the two-dimensional structures Ip/xI,xz),'fIz(xl'xz)used in the model and the resulting wind field. In this case, '01(t) and l'oz(t) are constant in time and prescribed as 't01=-0.IIN/m2, 't02=-0.11N/m2.
Non uniform wind fields are described hy lhe composition ofpalches ofthe form
where 'fI1(X"XZ)''fIz(xl,xZ) are the two-dimensional structures of the patches and 1'01(I) ,
24
22
... 20
cn cn
18
16'
L
O
0.2
0.15
0.1 U
CI) 0.05 C/)
E
O '0
O -0.05
(i) >
-0.1
-0.15
12 Rev. bras. oceanogr., 46( I), 1998
The Figure 9 illustrates the response of the non-linear model to the non-uniform wind forcing, showing the velocity and the SST fields at day 2. Afier 2 days a tongue of upwelled cool water is generated and extended in south-westward directíon reaching a minimum in &ont of Saquarema. In this sector the SST reaches the minimum of 15°C. Warmest temperatures occur well offshore and eastward approaching its initial value. The velocity field shows a current going offshore, which is forming at the coast and by continuity has !low contribution along the coast &om the east side as a coastal current and &om the west side as a coastal countercurrent. The maximum velocity obtained in the flow field is 17.7 cm/sec. The calculated SST pattern is similar to the observed one (upper panel of Fig. 2) characterized by the upwelling center in &ont of Saquarema and a spreading of cool waters of arollnd 17.5°C in
south-westward direction. .
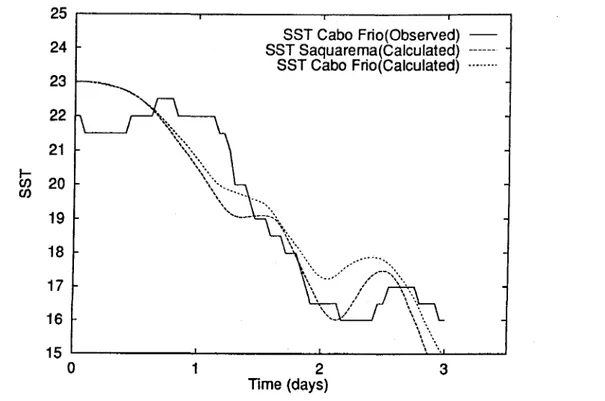
Numerical simulation of a time-dependcnt upwelling event
In this numerical simulation, the model 01'the coastal region of Cabo Frio is forced by a wind lie1d which has a spatial structure and a time variability. The wind fieIds are composed of patches of the lorm described in (15). The horizontal structure of the wind stress components are proposed taking into accollnt observed pattern. The structures 'f/t(X"X2), 'f/2(X"X2) used in the modeI are the same showed in Figure 8. The hourly observations (Fig. 10) at an industrial meteorological statíon ("Companhia Nacional de Alcalis", situated on the coast a little west of Cabo Frio) were corrected in order to extrapolate for the ocean, increasing the wind velocities in a 30%. The time variation of the wind stress functions 'o I(t) and '02(t) were calculated using the aerodynamic square law. In this simulation, for calibration purposes, were chosen vallles for the wind drag coefficient cw=2.25xI0-3 and the Rayleigh friction coefficient v=1.8 x I0-5 sec-I.
The observed wind velocities at the beginning 01' the upwelling event were very weak (2m/sec) and upwelling conditions were not reportcd. Additionally, information about the wind pattern and dircction bcfore the initial date was not enoug,h to define a correet initial state, therefore, the initial conditions were defined at rest, which are aeeeplable to represent ocean condition under weak winds. The simulation of the upwelling is started at O hours of 08/18/71 and integrated forward in time during 3
days to compare with observed spatial SST patterns, presented in Figure 2, and the time evolution of the SST in the coastal station of Cabo Frio.
Figure 1I íllustrates the response of the non-linear model to the time dependent and non-uniform wind forcing, showing the velocity and the SST tields at 2 and 3 days. Afier 2 days a tongue of upwelled cool water is generated and extends in south-westward direction reaching a minimllm temperature of 16.3°C in &ont of Saquarema. Note that a cool water cell enclosed bya contour of 17°C is formed offshore. This cell is mainly a consequence of the changes in direction and magnitude of the wind foreing. Remember that in the previous test calculation , using the same spatial structure of the wind but constant in time, the cool water cell offshore is not present in the solution a!ter 2 days (Fig. 9).
Afier 3 days the tongue of cool water is more intense, due the persistence of favorable wind. It reaches an absolute minimum of 15°C in a band between Saquarema and Cabo Frio which extends offshore in south-west direction. Warmest temperatures occur well offshore and eastward approaehing its initial value, and SST rises to 23°C. The velocity field shows a current flowing offshore, which is being formed at the coast and by continuity has flow contribution along the coast, from the east side as a coastal eurrent and &om the west side as a coastal counterflow. In the offshore side, there is a drifi in eastward direction which is not really a surface countercurrent, it is only a deflection of the flow due the response of lhe coastal water to the non-uniform wind tield forcing used in this simulation, with a tendency to form a cyclonic gyre. The maximum velocity at third day is 26.5 cm/sec.
Figure 12 shows the calculated time dependent variations of the SST in points representing Saquarema (at the shore) and the coaslal station of Cabo Frio. The time-dependent patterns in these points are particularly similar to the obscrved in the coastal station of Cabo Frio. The SST dropping is very intensive during the second day due higher wind velocities. A wind relaxation during the third day increases the SST during some hours.
The resuIts indicate that the model describes remarkably well the time-dependent physical features of the observed coastal upwelling and the
rapid change of SST in the coastal regionofCabo
~ ..0_- _...._..._.._____________...__...__________________..._ ---.
_o..0_ ..___...___...___________...________________.._.. ::::::::::::::: :~:::::::::::::::::::::::::::::::::::::::::::::::::
...--..----...--14 Rcv.hras. oceanogr., 46( 1), 1998
Fig. 9. Solution by non-unit{)rmwind th:ld. The arrows are normalized to the maximum velocity 01' 17.7 cm/sec and the contour intcrval 01' the SST is 0.5°e.
5
zonal campo meridional campo
n..._..._...___... , "...
i .,
I I. ~,
Ir, r-~:\ :\ Ar,
I' \..., I
í \j
\
. .,'i
'.,i
\/\. :
I\1
\
f,i \__J\
-../-\ '---'l
. ,/ \ ,--~"
'I
-15
o 30 40 50
Time (hours)
70 80
10 20 60
Fig. 10. Local timc variations 01'thc wind \'l.'locity (in components) collccted in a l11eteorologicalstatioll
a littlc \Vcst 01' Caho Frio.
o
ô
CI) fi)
g
-5
'0
O
ã)
>
AT 48 HOURS
AT 72 HOURS
Saquarema
...
Rcy. hras. occanogr.. 46( I). 1998
SST Cabo Frio(Observed) SST Saquarema(Calculated)
SST Cabo Frio(Calculated)
2
Time (days)
3
Fig. 12. limc history 01' thc COl1lputcJ 5Sl in thc coastal points 01' Saquarcma anJ Caho Frio anJ the ohscrvcd SST in thc coas tal station ol'Cabo Frio.
Conclusions
A modcl for the coastal area 01' Cabo Frio (Rio de Janeiro
-
Brazil), based on the non-lincarI Yzlayer model, is presented. The model includes the hydrodynamic momentum and continuity equations; a thermodynamic equation to describc the changes of SST, and a properly treatment 01' the open boundaries. The equation system is approximated by the tinite ditlerence method.
It was analyzed the dynamic response 01' the coastal region of Cabo Frio. East winds generatcs an upwelling band along the zonal coastline 01' the region. North winds prodllces a weak ageostrophic lIpwelling at the zonal coastline but offshore a castward tlow is obtained. In this case, along the meridional coastline 01'the region, the upwelling is more intense. When the model is forced by a l1on-1IIliformwind tield, representing an idealized \\'ind p;lttern of the region, it was possible to reprodllL'ca plume of cool upwelled water \vhich intensifiL's in sOllthwest direction. In this experiment it was vcritied the presence 01' coastal eastward tlows. The presence 01' eastward tlows in the solutions, associatcd with north wind components, might L':o;plainthe prcscnce 01'"countercllrrcnts" reportcd in many occasion in this coastal area.
A time-dependent simulation of an upwclling event in 1971 is obtained successflllly. The modcl is !i,rced by a time dependent wind tield with an
idealized spatial structure. The results describe the rapid evolution, during 3 days, 01'a plume 01' cool upwelled water extended in southwest direction, and the time response of the SST in the Cabo Frio station. These results compare remarkably well with the observations in space and time. The calculated current system is characterized by a current flowing otlshore, which is 1'ormedat the coast, and by signals of eastward tlows otlshore. During the simulation, due the changes 01' magnitude and wind direction, cells of cool upwelled water separate frol11the initial upwelling center flowing in southwest direction. The 1110dellingresult gives support to the hypothesis that the observed tongue of upwelling is mainly driven by the spatial contiguration 01' wind tield in this coastal region.
Conclusively , the success1'ullyobtained results in the numerical experil11entsvalidate the conceptual formulation of the model presented in this papel'. Improvements of the model for further application is possible increasing the complexity with processes which were not consider in this papel'.
Acknowlcdgements
Rcfcrcnces
Allard, P. 1955. Anomalies dans les températures de I'eaux de mer observées au Cabo Frio (Brésil). BulI. Inf Com. cent. Oceanogr. Études Côtes, 2: 58-63.
Carbonel, C. 1982. Numerisches model der zirkulation in auftriebsgebieten mit anwendung auf die Nord-Peruanische Kueste. Ph.D. Thesis. 1nstitute fuer Stroemungsmechanik, Hannover Universitaet. 92p.
Carbonel, C. 1992. Numerical modeling of layered ocean fluids on a limited-area domain. RelatÓrio 33. Instituto Politécnico do Rio de Janeiro. 35p.
Crepon, M. & Richez, C. 1982. Transient upwelling generated by two-dimensional atmospheric forcing and variability in the coastline. 1 phys. Oceanogr.,12(12):1437-1457.
Crepon, M.; Richez, C. & Chartier, M. 1984. Effects of coastline geometry on upwelling. .I. phys. Oceanogr., 14(8):1365-1382.
Chapman, D. C. 1985. Numerical treatment of cross-shelf open boundaries in a barotropic coastal ocean model. 1 phys. Oceanogr.,
15(8):1060-1075.
Guillen, O. & Calienes, R. 198I. Upwelling off Chimbote. In: Richards, F. A. ed. Coastal upwelling. American Geophysical Union. p.312-326.
I-Iurlburt, H. E. 1974. The intluence of coaslline geometry and bottom topography on the easkrn ocean circulation. Department of Meteorology Florida State University, Tallahase.
Ikeda, Y.; Miranda, L. B. & Rock, N. 1 1974. Observations on stages of upwelling in the region of Cabo Frio (Brazil) as conducted by continuous surtàce temperature and salinity measurements. Bolm Inst. oceanogr., S Paulo, 23:33-46.
Mascarenhas Jr., A. S.; Miranda, L. B. & Rock, N. 1 1971. A study of oceanographic conditions in the region of Cabo Frio. In: Costlow .Ir.. J. D. ed. Ferilitty ofthe sea. New York, GordOll& Breach Science Publishers. p. 285-308.
McCreary, 1 P. & Kundu, P. 1988. A numerical investigation of the Somali Current during the SOllthwestMonsoon. 1 mar., Res., 46( 1):25-58.
McCreary, J. P.; Lee, H. S. & Entield, D. B. 1989. The response of the coastal ocean to strong offshore winds: with application to circulations in the Gulfs of Tehuantepec and Papagayo. 1 mar. Res.,47(1):81-109.
Stech, L. & Lorenzzetti,.I. 1992.The response of the South Brazil Bight to the passage of wintertime cold fronts. 1 geophys. Res., 97(C6):9507-9520.
Torres A. & Santana, A. I. 1994. Resposta local da ressurgência costeira de Cabo Frio a passagem de um sistema frontal. Pesquisa Naval,
7:107-116.
Valentin, 1; Andre, D. L. & Jacobs, S. A. 1987. Hydrobiology in the Cabo Frio (Brazil) upwelling: two-dimensional structure and variability during a wind cycle. Continent. Shelf Res., 7( 1):77-88.
Verboom, G. K. 1982. Weakly-reflective boundary conditions for the shallow water wave equations. Delft Hydralllic Laboratory. Publication n. 266. 14p.
Verbool1l,G. K.; Stelling, G. S. & Otlicier, M. J. 1983. Boundary conditions for the shallow water equations. In: Abbott, M. B. & Cunge, 1 A. eds Engineering applications of computational hydraulics I. Boston, Pitman. p.230-262.